Abstract
This technical note demonstrates an ultra-sensitive method for confidently identifying and structurally elucidating drug metabolites (Figure 1), leveraging the enhanced MS1 and electron-activated dissociation (EAD) MS/MS sensitivity of the ZenoTOF 8600 system.
Metabolite identification studies are essential to drug discovery and development, and they are often conducted using LC-MS due to their high sensitivity and characterization capabilities. Drug metabolite structures with labile functional groups can often lose information with CID. Thus, complementary fragmentation methods such as EAD have gained recognition with the earlier generation ZenoTOF 7600 system, as they preserve labile functional groups and provide information-rich spectra. EAD spectra consist of unique fragments for more reliable drug metabolite analysis identification.1-4 Additionally, identifying low-abundant metabolites or detecting critical fragments with trace abundance is always a challenge due to low sensitivity. Here, an enhanced sensitivity information-rich fragmentation technique enables users to achieve increased confidence in metabolite structure assignments by utilizing EAD, on the ZenoTOF 8600 system, with improved front-end technology, advanced optical detector and the Zeno trap.
Key benefits for metabolite identification and characterization using the ZenoTOF 8600 system
- Identify metabolites with confidence: Unique fragments were generated using an ultra-sensitive method on the ZenoTOF 8600 system with EAD, providing confident identification of critical drug metabolites
- Enhanced sensitivity in MS1 and EAD MS/MS mode: Achieve improved MS1 and EAD MS/MS signal compared to the ZenoTOF 7600 system for structural elucidation of phase I and phase II drug metabolites with the Optiflow Pro ion source and an advanced optical detector
- Improved robustness: Perform robust metabolite identification workflow with reduced downtime compared to the ZenoTOF 7600 system, using the Mass Guard technology
- Streamlined workflow: Manage data using a single platform on SCIEX OS software, with the integrated Molecule Profiler software
Introduction
Drug metabolite analysis is a critical analytical method in drug discovery and development, providing crucial information about the drug’s metabolism and potential toxicity. Early stages of drug discovery involve in vitro studies to evaluate the drug's metabolic stability through incubation in liver microsomes or hepatocytes, which can provide a more physiological environment and a comprehensive picture of the metabolic outcome.
Drug metabolites can vary in abundance and structure; therefore, analytical platforms such as LC-MS have been crucial in detecting and characterizing metabolites. The ZenoTOF 8600 system provides improved sensitivity for detecting metabolites at low levels and EAD to capture unique fragments for more confident structure assignment, compared to the ZenoTOF 7600 system.
Methods
Sample preparation: Midazolam, diltiazem and propranolol (Figure 2) at a starting concentration of 1 µM were incubated with rat liver hepatocytes (1e6 cells) in the CryostaX hepatocyte incubation media (BIO-IVT) at 37°C. Samples were collected at 60 minutes. Protein crash was performed on the total incubation volume (0.2 mL) using 0.6 mL of acetonitrile. Samples were centrifuged at 13000 rpm for 10 mins and the supernatant was transferred to a vial for analysis.
Chromatography: Analytical separation was performed on the ExionLC AD system using a Phenomenex Kinetex XB-C18 (2.1 × 50 mm, 2.6 µm) column at a 0.5 mL/min flow rate. Mobile phase A was 0.1% (v/v) formic acid in water and mobile phase B was 0.1% (v/v) formic acid in acetonitrile. The column temperature was set to 40°C. The gradient conditions used are summarized in Table 1. A 5 µL sample injection was used for analysis.


Ultra-sensitive MS1 and EAD MS/MS for phase I and II metabolite identification and characterization
In vitro incubations of midazolam, diltiazem and propranolol were performed in rat liver hepatocytes. MS1 and Zeno EAD data were collected on the ZenoTOF 8600 system and compared with data from the ZenoTOF 7600 system. MS/MS data evaluation between the 2 MS platforms was performed using signal intensity (cps) due to the negligible noise levels observed. For data processing and analysis, Molecule Profiler software, integrated into SCIEX OS software, was applied.
Phase I metabolites, such as oxidation and cleavage metabolites of propranolol and diltiazem, were evaluated using ZenoTOF 8600 system and the results were compared to those from the ZenoTOF 7600 system. A loss of C2H2O from diltiazem was identified, as shown in Figure 3.5 MS1-based analysis of the deacetyl diltiazem demonstrated a 9x better signal response on the ZenoTOF 8600 system compared to the ZenoTOF 7600 system, while the EAD MS/MS spectra provided a 6x signal improvement. As a result, the ZenoTOF 8600 system demonstrated an ultra-sensitive platform for both MS1 and MS/MS level identification of phase I metabolites.
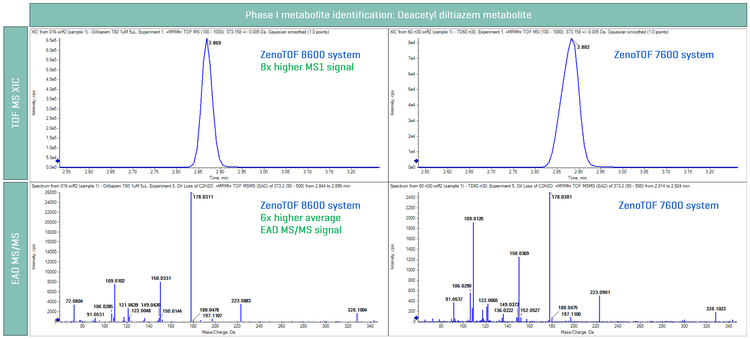
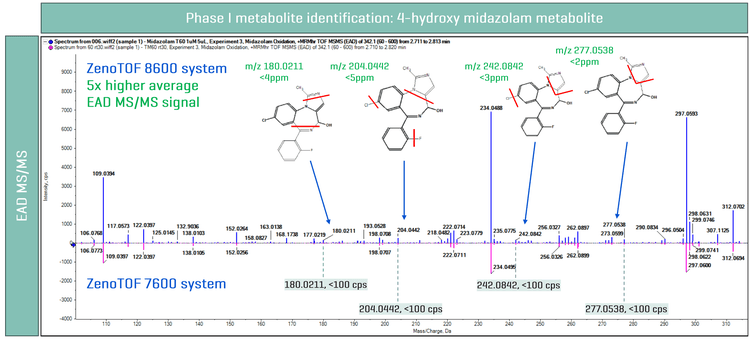
Figure 4 shows the EAD MS/MS spectra of 4-hydroxy midazolam metabolite on both MS platforms. On average, a 5x higher EAD MS/MS signal was observed on the ZenoTOF 8600 system compared to the ZenoTOF 7600 system. The enhanced sensitivity of the ZenoTOF 8600 system enabled a more confident identification of 4-hydroxy midazolam metabolite,6 where 4 unique EAD fragments (m/z 180.0211, m/z 204.0442, m/z 242.0842 and m/z 277.0543) were identified (Figure 4). Here, the evaluated fragments from EAD indicated mass error <5 ppm, further ensuring confident identification. In comparison, the 4 fragments were observed at <100 cps in signal on the ZenoTOF 7600 system and, therefore, could not contribute to the localization of the biotransformation.
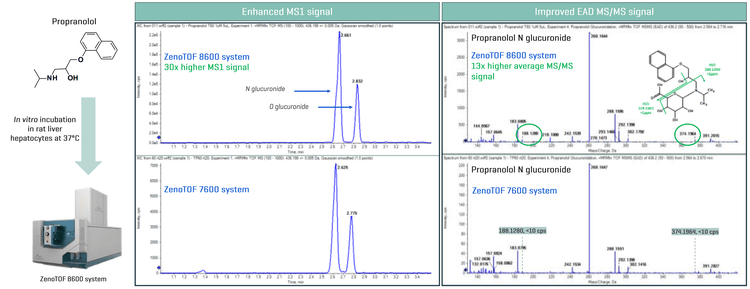
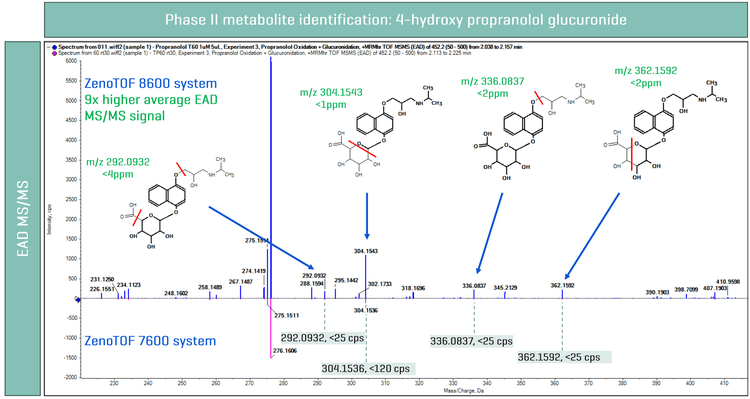
Phase II metabolites, such as glucuronides, were also evaluated using the ZenoTOF 8600 system. The chemical structure of propranolol suggests the probability of forming both N or O glucuronide metabolites. MS1-based analysis on the ZenoTOF 8600 system and ZenoTOF 7600 system showed 2 glucuronide metabolite peaks. A 30x improvement in MS1 signal was observed on the ZenoTOF 8600 system compared to the ZenoTOF 7600 system (Figure 1). As demonstrated in previous publications,1-4 EAD is essential for maintaining the integrity of glucuronide during fragmentation, where sensitivity is crucial for accurate fragment assignment. Here, EAD MS/MS spectra were evaluated for the glucuronide peak at 2.661 min (ZenoTOF 8600 system) and 2.625 min (ZenoTOF 7600 system). A 13x improvement in EAD MS/MS signal was observed, given the greater sensitivity on the ZenoTOF 8600 system. As a result, this enabled the identification of unique EAD fragments (m/z 188.1280 and m/z 374.1966) and proposed propranolol N glucuronide metabolite structure, the evaluated EAD fragments had a mass error of <1ppm (Figure 1). However, on the ZenoTOF 7600 system, both EAD fragments had a signal intensity of <10 cps and, therefore, did not have a significant contribution to the localization of glucuronidation.
Conclusions
- Generation of unique fragments enabled the confident identification of critical phase I and phase II drug metabolites using EAD on the ZenoTOF 8600 system. EAD-based fragment identification was performed with mass error <5 ppm.
- Enhanced sensitivity was demonstrated using MS1 and EAD MS/MS mode on the ZenoTOF 8600 system compared to the ZenoTOF 7600 system, enabling more confident structural characterization of phase I and phase II drug metabolites with the new front-end Optiflow Pro ion source and an advanced optical detector
- Robust metabolite identification was performedusing the Mass Guard technology on the ZenoTOF 8600 system, enabling increased instrument uptime to support lab productivity compared to the ZenoTOF 7600 system
- Data acquisition, management and processing were performed using a single platform on SCIEX OS software with the integrated Molecule Profiler software
References
- Yao M, Tong N, Rahul B, Ruan Q. Advancing structural elucidation of conjugation drug metabolites in metabolite profiling with novel electron-activated dissociation. Rapid Commun Mass Spectrom. 2024; 38(20):e9890. doi:10.1002/rcm.9890
- Tunable electron activated dissociation (EAD) MS/MS to preserve particularly labile PTMs. SCIEX technical note, RUO-MKT-02-13006-B.
- Peptide fragmentation using electron activated dissociation (EAD). SCIEX community post, RUO-MKT-18-13296-A.
- Innovative drug metabolite identification and characterization using electron activated dissociation. SCIEX technical note, MKT-34162-A.
- Molden E, Johansen PW, Bøe GH, Bergan S, Christensen H, Rugstad HE, Rootwelt H, Reubsaet L, Lehne G. Pharmacokinetics of diltiazem and its metabolites in relation to CYP2D6 genotype. Clin Pharmacol Ther. 2002; 72(3):333-42.
doi: 10.1067/mcp.2002.127396. - Hyland R, Osborne T, Payne A, Kempshall S, Logan YR, Ezzeddine K, Jones B. In vitro and in vivo glucuronidation of midazolam in humans. Br J Clin Pharmacol. 2009; 67(4):445-54.
doi: 10.1111/j.1365-2125.2009.03386.x. - Fan Y, Sijie L, Gerhard W, Mattias B, Maria K. Complete Reaction Phenotyping of Propranolol and 4-Hydroxypropranolol with the 19 Enzymes of the Human UGT1 and UGT2 Families. Int. J. Mol. Sci. 2022; 23(13): 7476
doi: 10.3390/ijms23137476