Abstract
This technical note describes a streamlined workflow for the identification and localization of glucuronide metabolites using the ZenoTOF 7600+ system . Here, EAD enabled confident identification of the metabolite and its site of metabolism, with more informative MS/MS spectra, by preserving labile modifications such as glucuronidation (Figure 1).
Confident characterization of drug metabolites is essential for evaluating safety and efficacy, as metabolites can contribute to therapeutic activity, toxicity, and drug–drug interactions. LC – HRMS is widely used for drug metabolism and pharmacokinetics (DMPK) studies, with collision -induced dissociation (CID) traditionally applied for fragmentation. However, with CID, there are often challenges in preserving labile modifications such as glucuronides . In contrast, EAD provides complementary structural information and improves retention of labile functional groups, such as glucuronide bonds, facilitating confident localization of biotransformation that may be difficult to achieve using CID alone .
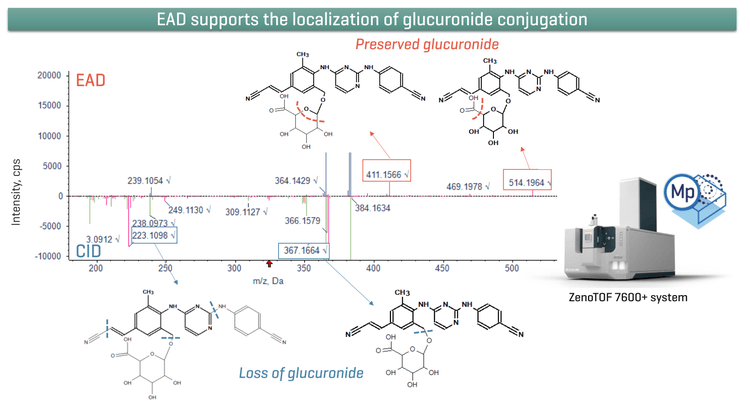
Key benefits for metabolite identification using ZenoTOF 7600+ system
- Enhanced structure assignment: EAD provides informationrich MS/MS spectra that facilitates confident localization of the biotransformation sites while preserving labile modifications such as glucuronides.1
- Low-abundance metabolite identification: Effortlessly identify low- abundant metabolites using a sensitive MS/MS approach with Zeno trap.
- Quick data processing: Easily c ompare CID and EAD spectra and identify unique fragments using a single result file in Molecule Profiler software.2
- Streamlined workflow: An integrated LC-HRMS platform enables seamless data acquisition and processing, facilitating efficient evaluation of structure -metabolism relationships (SMRs).
Introduction
Comprehensive elucidation of drug metabolism pathways is critical for ensuring drug safety and therapeutic efficacy, as drug metabolites can contribute to therapeutic activity, toxicity, and drug–drug interactions. Therefore, accurate identification and structural characterization of metabolites are essential t o support safety and efficacy assessments.
Liquid chromatography coupled with high-resolution tandem mass spectrometry (LC –HRMS/MS) has become a central tool for studying drug metabolism and pharmacokinetics (DMPK). Because many metabolites are present at trace levels and differ from the parent compound by subtle chemical modifications, confident metabolite identification requires sensitive detection combined with structurally diagnostic MS/MS fragmentation to localize sites of biotransformation. Conventionally, metabolite characterization is performed using CID. However, CID can be limited in its ability to retain information from labile modifications, which are often lost through neutral fragmentation. When relying solely on CID-derived information, non-MS secondary analytical platforms are often required to achieve accurate localization and complete structural elucidation of drug metabolites.
The ZenoTOF 7600+ system provides an alternative fragmentation approach based on EAD, which uses tunable electron kinetic energy to fragment while preserving labile functional groups. Unlike CID, which often results in neutral loss of chemically unstable moieties, EAD generates complementary fragment ion series that retain structural information associated with biotransformation sites. This capability is particularly valuable for characterizing conjugative metabolites, such as glucuronides, where site-specific modifications are critical for confident annotation. By producing information-rich and structurally diagnostic spectra, EAD improves the localization of metabolic transformations and reduces ambiguity in metabolite identification workflows, thereby supporting more reliable structure elucidation in drug metabolism studies.
In this technical note, rilpivirine was used as a model compound to demonstrate the benefits of EAD for structural elucidation within a streamlined, automated metabolite identification workflow using Molecule Profiler software on the ZenoTOF 7600+ system.
Methods
Sample preparation: Rilpivirine at 10 µM starting concentration was incubated in human hepatocytes at 37 °C for 4 hours. Samples were removed from the incubation and quenched with acetonitrile at a 2:1 (v/v) ratio. Samples were vortexed for 30 seconds and centrifuged at 12000 rcf for 12 minutes at room temperature. Samples were dried under liquid nitrogen and reconstituted with a 2:1 (v/v) water/acetonitrile mixture before being transferred to a vial.
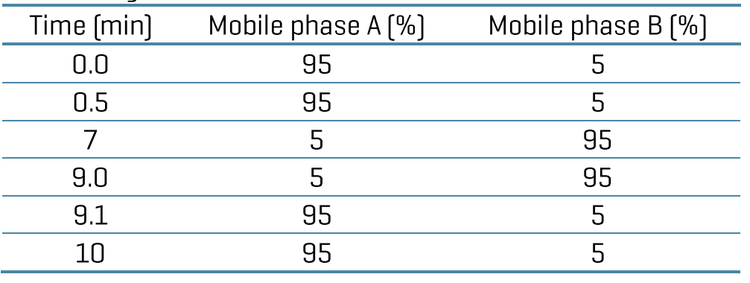
Chromatography: Analytical separation was performed using an ExionLC system (SCIEX) at a 0.6 mL/min flow rate on a Phenomenex Kinetex Polar C18 (2.1 x 100 mm, 1.7 µm, 100 Å) column. A 10- minute gradient was run using 0.1% formic acid in water as mobile phase A and 0.1% formic acid in acet onitrile as mobile phase B (Table 1). The column temperature was maintained at 55 °C. An injection volume of 5 µL was used for analysis. A mixture of equal volumes of acetonitrile, methanol, and water was used as the needle wash solvent.
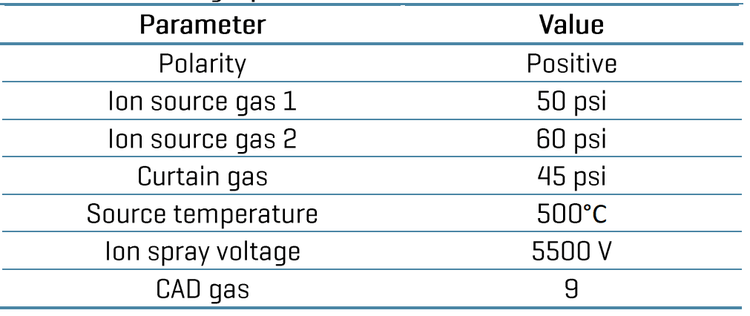
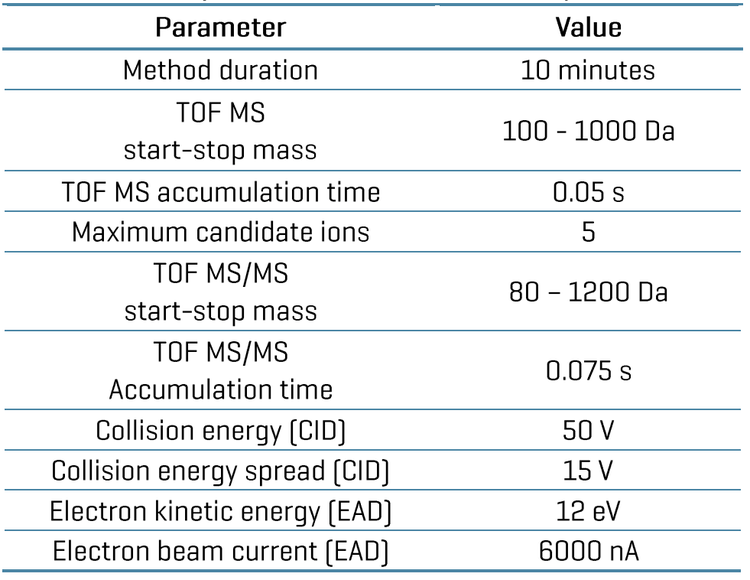
Data processing: Zeno CID DDA and Zeno EAD DDA datawere acquired using SCIEX OS software , version 4.0. The Molecule Profiler software (SCIEX) , version 1.3 integrated into SCIEX OS software was used to process and analyze both data sets in a single file. Biotransformation elucidation and site prediction was performed using an automated algorithm integrated into the Molecule Profiler software.
Identification of rilpivirine glucuronide metabolites
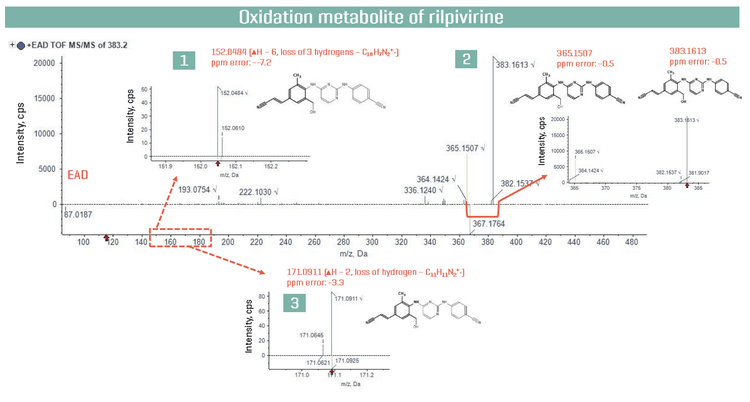
Rilpivirine metabolites have been extensively profiled across several species.3 In the present study, rilpivirine was incubated with human hepatocytes for 4 hours, resulting in the formation of several phase I and phase II metabolites. Here, we specifically examined 1 oxidative metabolite (Figure 2) and 2 glucuronide metabolites (O- glucuronide (Figure 3) and N-glucuronide (Figure 4 )) to determine their structures using Zeno CID DDA and Zeno EAD DDA methods. Molecule Profiler software was used for data processing into a single results file. The software used an automated process to assign structures based on the weighting of Zeno EAD and Zeno CID spectra with a 1-100% scale, ensuring the proper interpretation of the site of metabolism. Additionally, the software provided the ability to modify structures in the interpretation pane and assign new structures to selected MS/MS spectra. Here, all rilpivirine metabolites and fragments were identified with <6 ppm error, enabling confident identification and demonstrating the excellent mass accuracy of the ZenoTOF 7600+ system.
Figure 2 shows EAD spectrum of oxidation metabolite of rilpivirine eluted at a retention time of 3.21 min. Here, oxidation metabolite m/z 383.1617 formed by the hydroxylation of the methyl group. Figure 2 highlights 3 EAD- derived fragments at m/z 152.0484, 171.0911, and 365.1507 (Figure 2; 1-3) that provide structural evidence supporting assignment of the rilpivirine oxidation metabolite at the methyl site. The ion at m/z 365.1507 shows the loss of water compared to parent ion at m/z 383.1613. The ions at m/z 171.0911 (–2 H) and 152.0484 (– 3 H) are indicative of benzylic alcohol fragmentation, as radical-type ions preferentially form at benzylic positions due to resonance stabilization, supporting aliphatic (benzylic) oxidation and ruling out oxidation on the aromatic ring.4,5
Figure 3 shows inverted overlay CID and EAD MS/MS spectra of rilpivirine O-glucuronide, eluting at 3.26 min and detected at m/z 559.1938. The top panel highlights unique EAD-derived fragments at m/z 211.0609, 411.1566, 469.1978, and 514.1964 (Figure 3; 1–4). The bottom panel shows CID -derived fragments at m/z 223.1098, 365.1510, and 383.1626 (Figure 3; 5–7), with fragment 6 (m/z 365.1510) observed in both CID and EAD spectra. Key fragments supporting metabolite identification include the EAD- derived ion at m/z 211.0609 (fragment 1), the common fragment at m/z 365.1510 (fragment 6), and the CID-derived ion at m/z 383.1626 (fragment 7).
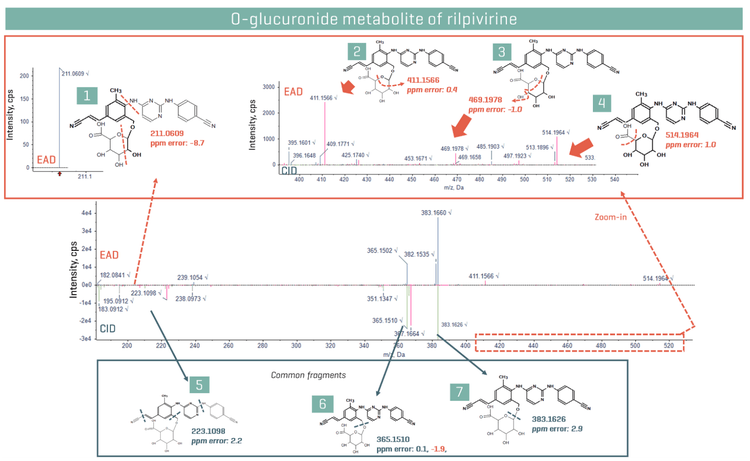
The fragment at m/z 211.0609 retains a portion of the O-glucuronide moiety at the methyl site, providing direct structural evidence of conjugation. Fragments at m/z 365.1510 and 383.1626 (Figure 3; 6 and 7) are also observed in the oxidation metabolite (Figure 2; 2), supporting a metabolic pathway in which glucuronidation follows initial hydroxylation.3 Additional diagnostic EAD fragments are observed in the high m/z region (Figure 3; 2–4). Fragment ions at m/z 411.1566, 469.1978, and 514.1964 retain glucuronide-related structural information and enable confident localization of the biotransformation site.
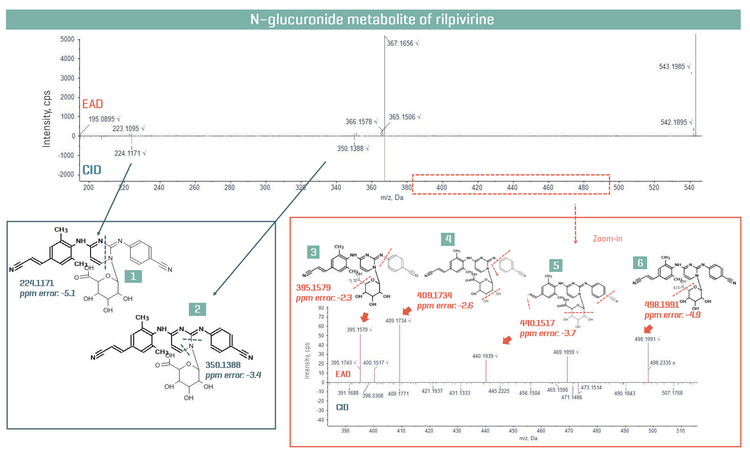
Figure 4 shows mirror plot of CID and EAD MS/MS spectra of rilpivirine N- glucuronide, eluting at 3.26 min and detected at m/z 543.1992.³ The blue panel highlights CID derived fragment ions at m/z 224.1171 and 350.1388, both associated with loss of the glucuronide moiety, thereby limiting confident localization of the conjugation site (Figure 4; 1 and 2). By contrast, the orange panel shows diagnostic EAD fragments in the high m/z region which preserve the glucuronide moiety. Unique EAD fragment ions at m/z 395.1579, 409.1734, 440.1517, and 498.1991 (Figure 4; 3–6) support localization of the biotransformation site.
Conclusions
- Improved localization of biotransformation sites and confident metabolite identification was performed with information-rich EAD fragmentation on the ZenoTOF 7600+ system.
- Identification of low-level metabolites was easily achieved with the Zeno trap, enabling enhanced MS/MS sensitivity for both EAD and CID applications.
- Unique fragments from EAD and CID spectra were identified and processed in a single result file using Molecule Profiler software to achieve more accurate structure assignment of metabolites and localization of the modification sites.
- Informative data was generated using a quick and easy-to-use workflow on a streamlined platform, accelerating the early drug discovery process .
References
- Tunable Electron-Assisted Dissociation (EAD) MS/MS to preserve particularly labile PTMs. SCIEX technical note, RUO-MKT- 02-13006-B.
- Enhanced drug metabolite identification using collision-induced dissociation (CID) and electron-activated dissociation (EAD). SCIEX technical note, MKT-29204-A.
- Lade, J. M.; Avery, L. B.; Bumpus, N. N. Human Biotransformation of the Nonnucleoside Reverse Transcriptase Inhibitor Rilpivirine and a Cross - Species Metabolism Comparison. Antimicrobial Agents and Chemotherapy 2013, 57 (10), 5067 –5079. https://doi.org/10.1128/aac.01401-13.
- Carey, F. A.; Sundberg, R. J. Advanced Organic Chemistry, Part A: Structure and Mechanisms, 5th ed.; Springer, 2007. Chapter: Free Radical Reactions.
- Baba, T.; Campbell, J. L.; Le Blanc, J. C. Y.; Hager, J. W.; Thomson, B. A. Electron Capture Dissociation in a Branched Radio- Frequency Ion Trap. Analytical Chemistry 2014, 87 (1), 785–792. https://doi.org/10.1021/ac503773y.