A sensitive method for the quantitation of per- and polyfluoroalkyl substances (PFAS) in pharmaceutical packaging containers
Abstract
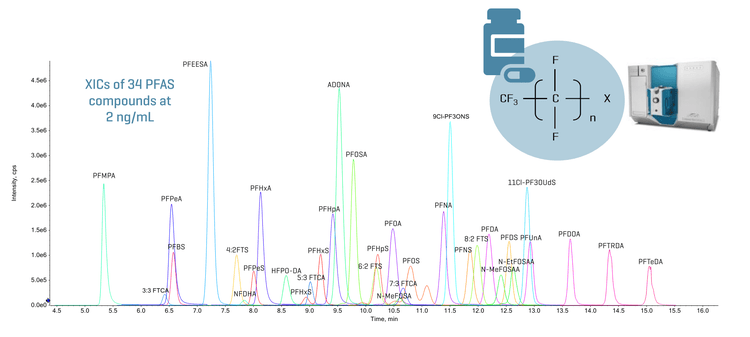
This technical note demonstrates a sensitive quantitation method for PFAS using the SCIEX 7500+ system. Baseline chromatographic separation was achieved for the analyzed 34 PFAS compounds (Figure 1). Accurate and highly reproducible quantitative performance was achieved. The method was applied to measure PFAS in example pharmaceutical packaging containers, achieving an overall recovery of ≥96.7% across 34 compounds.
Currently, government agencies worldwide have established stringent safety limits and regulations for PFAS in drinking water to protect public health.1 More recently, the involvement and impact of PFAS in pharmaceutical applications have started to attract attention. As interest in this area continues to grow, the accurate evaluation of PFAS in pharmaceutical products will require highly sensitive and selective analytical methods to ensure reliable detection and quantitation. In this technical note, a sensitive quantitation method was developed using 34 PFAS compounds as model analytes for this assay. The method was subsequently applied to pharmaceutical packaging containers, in which no PFAS compounds were detected.
Key benefits for quantitation of PFAS in pharmaceutical packaging containers using the SCIEX 7500+ system
-
Baseline chromatographic separation: Achieve baseline separation of 34 PFAS compounds using a simple LC gradient method
-
Sensitive quantitation of PFAS compounds: Limit of quantitation (LOQ) ranging between 0.001 and 0.005 ng/mL was achieved with an accurate and highly reproducible (%CV <14) quantitative performance across 34 PFAS using a low injection volume (3 µL)
-
Method applicability to pharmaceutical packaging containers: An overall recovery of ≥96.7% was achieved when measuring 34 PFAS compounds in pharmaceutical packaging containers
-
Excellent quantitative performance: A wide linear dynamic range (LDR) spanning ≥3.2 orders of magnitude was reached with a coefficient of determination (r2) of ≥0.99 for all PFAS analyzed on the SCIEX 7500+ system
Introduction
Pharmaceutical packaging containers may inadvertently harbor trace levels of PFAS, making sensitive and reliable measurement essential. Quantitation of PFAS at ultra-trace levels is required to safeguard drug product quality and patient safety, especially given PFAS’ persistence and potential health risks.
Under the evolving REACH (Registration, Evaluation, Authorization and Restriction of Chemicals) framework, European authorities are proposing expanded restrictions on PFAS, which may impact pharmaceutical packaging, excipient materials, and container closure systems.2 Following the FDA’s revocation of PFAS use in food contact materials, concerns have intensified regarding the use of fluoropolymer materials in pharmaceutical packaging containers. Due to the progression of regulations, there is a potential need for sensitive methods to quantify PFAS in pharmaceutical containers for safe packaging and transport.
This study evaluated the LC-MS-based quantitative performance of 34 PFAS compounds and the method applicability in pharmaceutical containers.
Methods
Samples and reagents: PFAS mixture (PFAS-C-ES Mixture) was purchased from LGC Standards.
Sample preparation: A working stock of 20 ng/mL was prepared in an 80:10 (v/v) methanol/water mixture and serially diluted to prepare the calibration curve samples. The concentrations ranged between 0.001 and 10 ng/mL. For the extraction procedure, a 10 mL aliquot was added to the pharmaceutical packaging container (ophthalmic drug container). The weight of the container was 3.85 g. The container was spiked with 0.1 ng/mL of PFAS and 10 mL of methanol as the extraction solvent. The samples were sonicated for 1 hour at 50°C. After sonication, 0.2 mL of water was added to the samples and vortexed.4 The samples were transferred into the autosampler vials and injected for analysis.
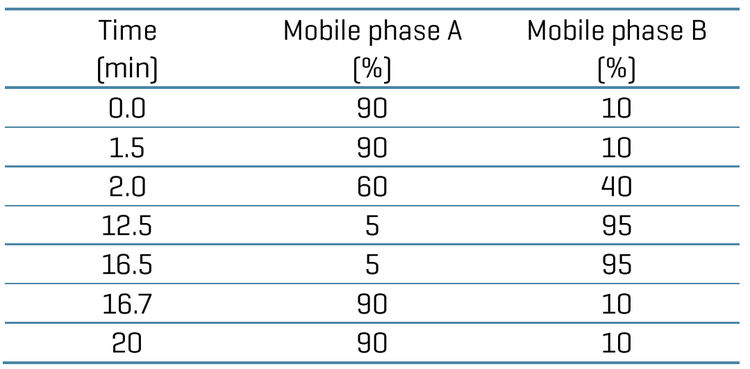
Chromatography: Chromatographic separation was achieved on an ExionLC AD system (SCIEX). A delay column (Phenomenex Luna Omega PS C18 column; 3 x 50 mm, 5 μm, 100 Å) was used after the LC mixer for chromatographic delay of any possible PFAS contamination coming from mobile phase solvents. A Phenomenex Luna omega PS C18 column (2.1 x 100 mm, 3 μm, 100 Å) was used to achieve baseline analytical separation of the PFAS compounds. The column temperature was set at 50°C. A flow rate of 0.6 mL/min was used. Mobile phase A was 2 mM ammonium acetate in water and mobile phase B was 0.05% acetic acid in methanol. An injection volume of 3 μL was used for the analysis.
The chromatographic gradient conditions are summarized in Table 1.
Quantitative performance
This technical note demonstrates the quantitation of PFAS at sub-ng/mL levels using the SCIEX 7500+ system. Baseline separation was achieved for the 34 PFAS compounds (Figure 1) using a simple gradient system.
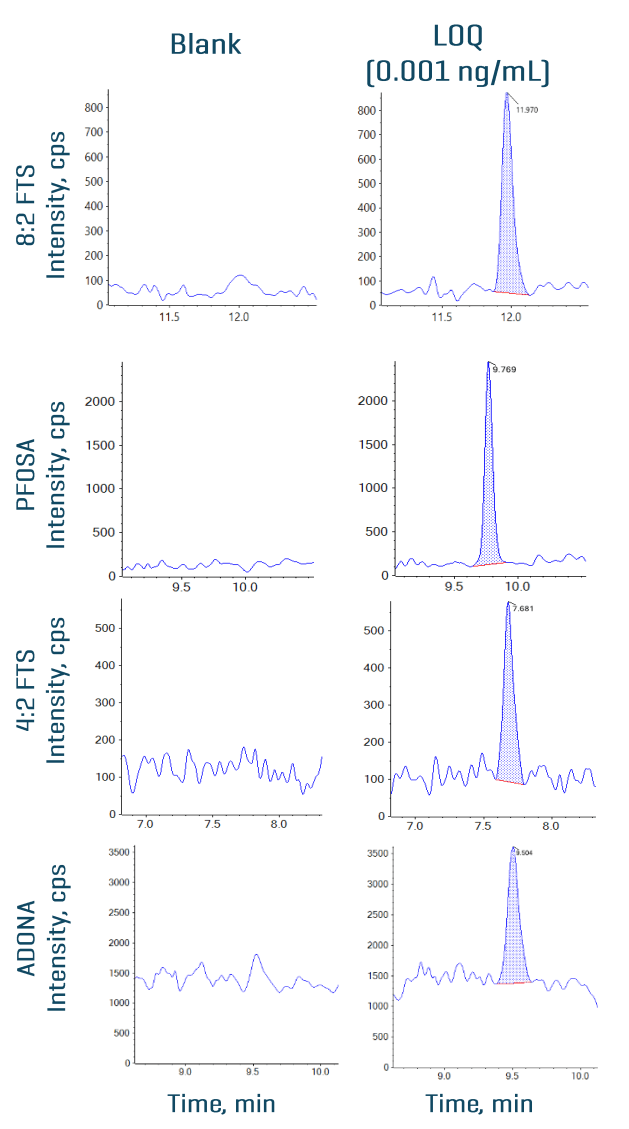
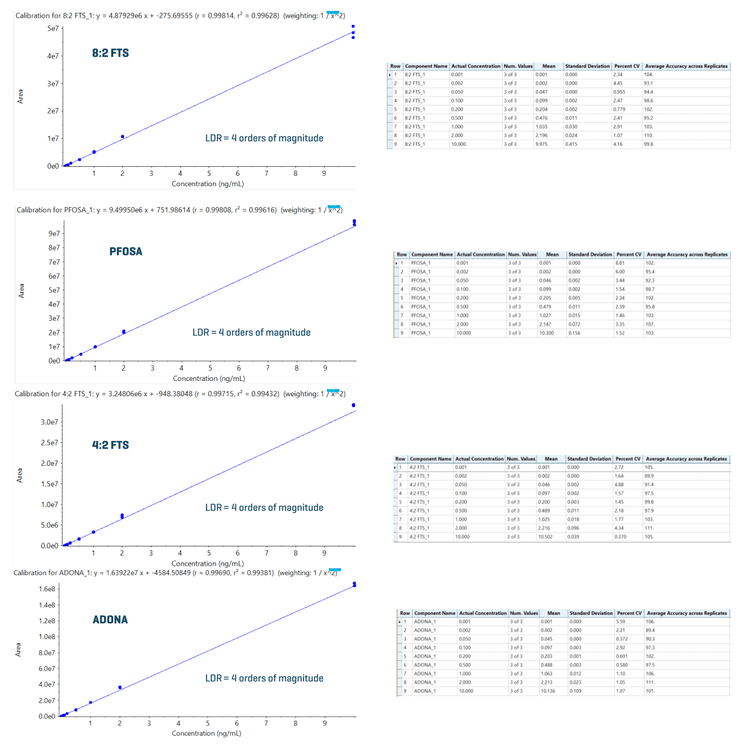
An LOQ of ≤0.005 ng/mL was achieved for all 34 PFAS compounds. Figure 2 shows the XICs at the LOQ levels for 8:2 FTS, 4:2 FTS, PFOSA and ADONA. No background interference was observed in the blank samples. Figure 3 shows quantitative performance for 8:2 FTS, 4:2 FTS, PFOSA and ADONA. For the 4 representative PFAS compounds, the LDR was ≥3.3 orders of magnitude with an r2 of ≥0.993 and an assay accuracy of ±12% (of the nominal concentration) with %CV <6.
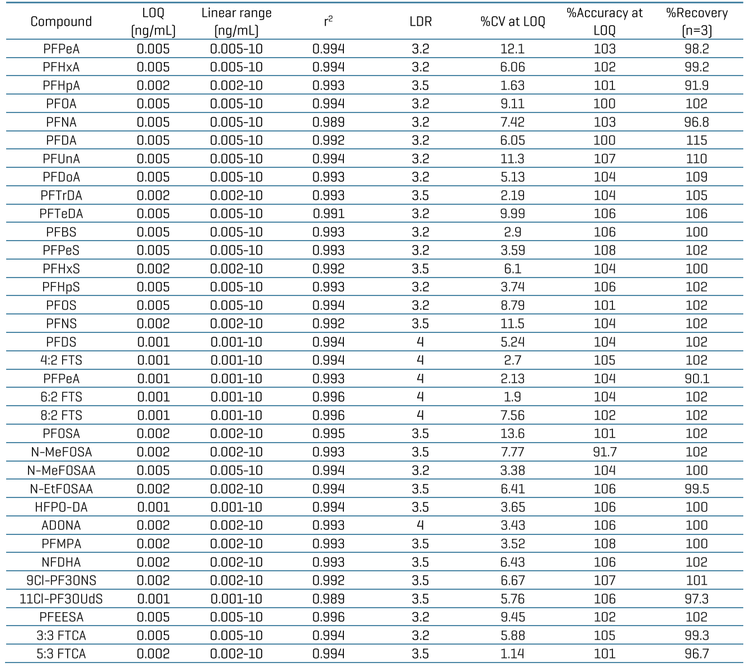
Table 4 summarizes quantitation performance for the 34 PFAS compounds. LOQs ≤0.005 ng/mL were achieved with LDRs spanning a ≥3 orders of magnitude. Linearity was achieved with an r2 of ≥0.993. The assay accuracy was within ±15% (of the nominal concentration) with %CV <9 for 34 PFAS compounds at the LOQ level.
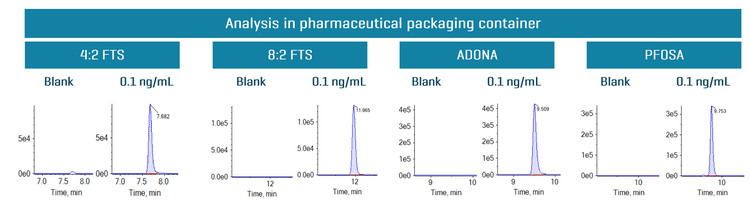
Figure 4 shows representative XICs of the blank samples from the pharmaceutical packaging container and at 0.1 ng/mL of spiked in 8:2 FTS, 4:2 FTS, PFOSA and ADONA. No PFAS compounds were detected in the pharmaceutical packaging container as represented in the blank XICs.
Recovery was evaluated by comparing the peak area of each PFAS compound at 0.1 ng/mL in a pre-spiked pharmaceutical packaging container against the peak area of each PFAS compound at 0.1 ng/mL in the post-spiked sample (Table 4). Testing was performed using 3 replicates for all 34 PFAS compounds. Good assay recovery was achieved with an overall recovery of ≥96.7%.
Conclusion
-
Good baseline separation was achieved between 34 PFAS compounds using a simple gradient system.
-
Sub-ng/mL levels of LOQs were achieved for 34 PFAS compounds analyzed on the SCIEX 7500+ system.
-
The method demonstrated seamless applicability to measuring PFAS in pharmaceutical packaging containers.
-
Excellent quantitative performance was achieved with an r2 of ≥0.99 for all PFAS and LDR spanning ≥3.2 orders of magnitude achieved on the SCIEX 7500+ system.
-
An overall recovery of ≥96.7% was achieved for all PFAS tested in the pharmaceutical packaging container
References
- Per- and Polyfluoroalkyl Substances (PFAS) Final PFAS National Primary Drinking Water Regulation, EPA, Safe drinking water act.
- European Chemicals Agency (ECHA). (2023). PFAS restriction proposal.
- Quantitative Extraction and Analysis of PFAS from Plastic Container Walls with Cut Coupons by LC/MSMS. OPP/BEAD/Analytical Chemistry Branch, Version 1.0 – February 12, 2024