Abstract
This technical note shows the intermediate precision results involving 3 BioPhase 8800 systems, 3 neutral capillary cartridge lots, 3 users and 3 lots of cIEF chemistry. The results revealed great inter and intra-capillary reproducibility for migration time, isoelectric point and corrected area composition (%). We also demonstrate the capillary cartridge run life where we were able to obtain 100 runs (800 injections) per cartridge.
Introduction
Recent development of new antibody modalities has led to an increased demand for fast and high-throughput capillary isoelectric focusing (cIEF) analysis for charge heterogeneity characterization. Now scientists can achieve high throughput cIEF analysis up to 8 times faster than a single-capillary system. In this work, we show the intermediate precision results with high accuracy in isoelectric point (pI) determination with 4-point standard curve and R-square value above 0.9980 as well as exceptional intra- and inter-capillary and overall reproducibility for pI and corrected peak area percentage (Figure 1). We also demonstrate a long capillary cartridge run life by obtaining 100 runs or 800 injections per cartridge with test samples.
In the past two decades, cIEF has become an indispensable analytical tool in development, quality control and process control of manufacturing biologic therapeutic drugs. By determining the pI of charge isoforms, cIEF provides critical information for establishing identity, purity, post-translational modifications and stability for monoclonal antibodies (mAbs). It is also an invaluable technique for establishing equivalency of a biosimilar mAb to its original brand product. 1 cIEF is an elegant mechanism of separation that requires a robust instrument, chemistry and capillary to achieve accurate and reproducible results. Combining a multi-capillary system with a complete set of robust chemistry and capillary cartridge enables scientists to use cIEF in their routine biologics characterization workflow confidently.
Key features
- High-throughput cIEF analysis with parallel processing of 8 samples simultaneously enables faster data collection, requiring less than 8.5 minutes per sample
- Easy-to-use software with improved algorithm streamlines data analysis
- High-accuracy pI determination, with 4-point standard curve and R-square value above 0.9980, provides confidence in results
- Excellent intermediate precision, evidenced by remarkable intra- and inter-capillary and overall reproducibility, warrants high assay robustness
- Ready-to-use cIEF kit and pre-assembled neutral coated cartridge save user time and ensure data reproducibility
- Capillary cartridge is robust, generating reliable and reproducible data for 100 runs or 800 injections with test samples
Methods
Materials: The BioPhase capillary isoelectric focusing (cIEF) kit (PN C30101), containing cIEF cathodic stabilizer, cIEF anodic stabilizer, cIEF gel, cIEF urea, cIEF anolyte, cIEF neutral capillary conditioning solution, cIEF catholyte, cIEF chemical mobilizer, cIEF formamide and CE-grade water was from SCIEX (Framingham, MA). BioPhase sample and reagent plates (PN 5080311), BioPhase sample plates (PN 5080313), BioPhase reagent plates (PN 5080314), BioPhase outlet plates (PN 5080315), BioPhase neutral capillary cartridge, 8 x 30 cm, 50 μm inner diameter (PN 5080119) and cIEF peptide marker kit (PN A58481) were from SCIEX (Framingham, MA). The USP mAb IgG SS RS (PN 1445550) was from USP (Rockville, MD). Pharmalyte IEF carrier ampholytes, broad range 3-10 (PN 17-0456-01, Cytiva) was from VWR. NIST mAb (PN RM 8671) reference material was from the National Institute of Standards and Technology (NIST) (Gaithersburg, MD).
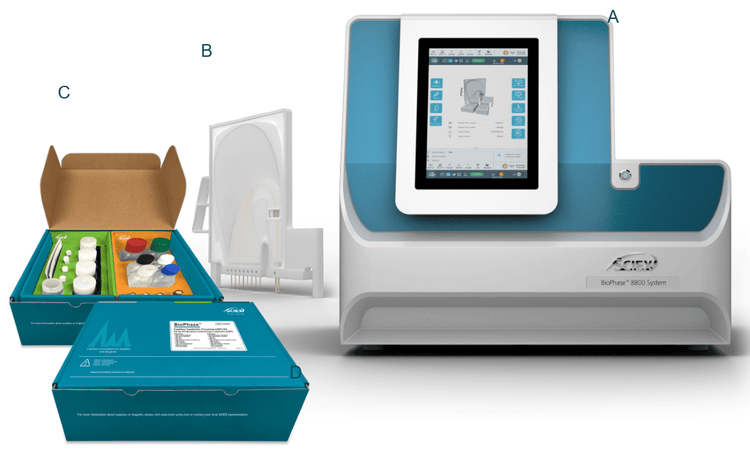
Instrument and software: The BioPhase 8800 system (PN 5083590) equipped with a UV detector was from SCIEX (Framingham, MA). Data acquisition and analysis were performed using the BioPhase 8800 system software 1.0.
Sample preparation: All buffers and reagents were prepared following instructions in the Capillary Isoelectric Focusing (cIEF) Kit for the BioPhase 8800 system application guide 2. For each row of 8 sample wells with pI markers, a master mix containing 800 μL 4M urea-cIEF gel, 100 μL cathodic stabilizer, 12 μL anodic stabilizer, 48 μL pharmalyte 3-10 and 8 μL of each of the 5 pI markers (pI 10.0, 9.5, 7.0, 5.5 and 4.1) was prepared and mixed thoroughly at room temperature. After a brief spin to collect the solution to the bottom of the tube, a 100 μL aliquot was transferred to each well of the sample plate.
For analysis with USP mAb IgG SS RS, the lyophilized standard (2 mg) was first resuspended in 400 μL of CE-grade water to make a solution with a final concentration of 5 mg/mL. For each row of 8 sample wells with USP mAb IgG SS RS, a master mix was prepared as described above, with 32 μL USP mAb IgG SS RS at 5 mg/mL substituting for 8 μL of pI marker 7.0. After thorough mixing and a brief spin, 100 μL aliquots were transferred to each well on the sample plate.
For analysis with NIST mAb, the NIST mAb was diluted from the stock concentration of 10 mg/mL to 5 mg/mL with CE-grade water. Samples were prepared following the same procedure as the USP mAb IgG SS RS, using the NIST mAb.
Methods and sequence creation: Methods were created using the intuitive, tile-based, drag-and-drop interface in the “Method Editor” module of the BioPhase 8800 system software. This module permits the user to select the desired buffers, reagents and specific actions such as “rinse” and “inject” steps to assemble a method. Similarly, run sequences were created in the “Sequence Editor” module, by selecting the desired method and applying it to each sample column, as described in the Capillary Isoelectric Focusing (cIEF) Kit for the BioPhase 8800 system application guide. Alternatively, validated methods and sequences provided with the BioPhase 8800 system software were modified and saved with new names. Amounts of reagents needed were calculated by the software, based on the methods and number of sample injections in the sequence. Once a sequence was created, the sample and reagent plate layouts were generated automatically by the software.
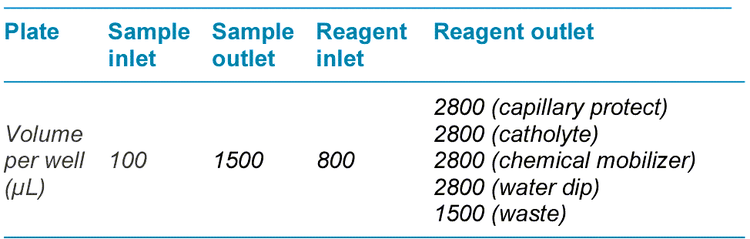
Preparation of sample and reagent plates: Recommended fill volumes are shown in Table 1. Wells that needed to be filled were indicated by the plate layouts generated by the BioPhase 8800 system software. For outlet plates, reagents were added to the indicated wells on the lower side of the plate, away from the chamfered corner. CE-grade water was added to sample outlet wells and to capillary protect, water dip and waste wells on the reagent outlet plates.
Conditioning of BioPhase neutral capillary cartridge: New cartridges were conditioned using the “Conditioning Method for a New Cartridge.” Cartridges that were run previously were conditioned using “Conditioning Method,” as described in the Capillary Isoelectric Focusing (cIEF) Kit for the BioPhase 8800 system application guide.
Preparation of the BioPhase 8800 system for a sequence run: After user login, a neutral capillary cartridge was installed. The sample, reagent and outlet plates prepared as described above were loaded onto the BioPhase 8800 system using the touch screen on the front panel. A sequence was selected from a project folder on the network. The run was started by pressing the “Run Sequence” button. Each set of 8 samples was processed in parallel.
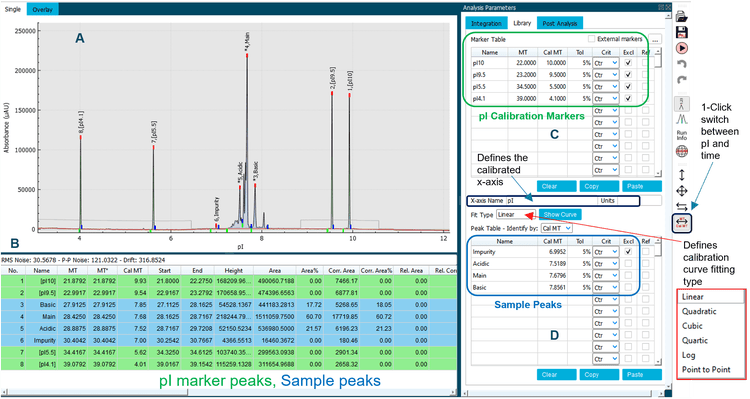
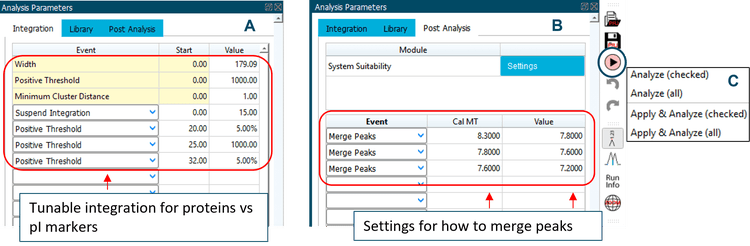
Data analysis: Data were analyzed using the BioPhase Analysis module (Version 1.0) of the BioPhase 8800 system software. The Optimizer feature on the “Integration” tab was enabled to automatically select a best-fit analysis, based on a minimum signal-to-noise ratio of 10. Peaks for pI 10.0, pI 9.5, pI 5.5 and pI 4.1 were selected as markers and added to the “Marker Table” on the “Library” tab with pI values as “Cal MT” values. Peaks of interest were added to the “Peak Table” with “Cal MT” selected as method of peak identification. An example of data analysis is shown in Figure 2. Additional adjustments with peak integration and post-analysis to merge peaks for each isoform group were performed, as needed. Examples of adjusting peak integration and merging peaks are shown in Figure 3. Once the analysis parameters were optimized, they were applied to the selected data files by the software. The pI values were calculated for peaks of interest using the pI markers in the “Marker Table”. A results table was automatically generated with all raw and analyzed data and associated statistics. This table was exported for further analysis in Excel.
Results and discussion
Accuracy and intermediate precision for high-throughput pI determination on the BioPhase 8800 system for pI 7.0 marker
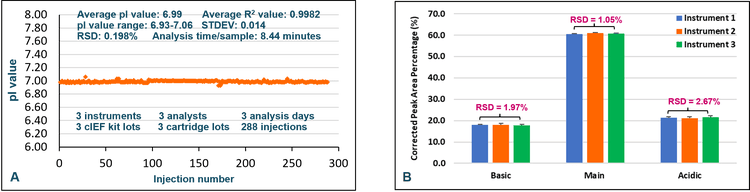
In a comprehensive accuracy and precision study, 3 BioPhase 8800 systems were used for cIEF analysis with pI markers by 3 analysts on 3 different days. Each used a neutral cartridge from a different lot and a cIEF kit from a different lot. Samples for 96 injections were prepared by each analyst as described in Methods. An in-depth analysis of the accuracy for pI determination was performed. The standard curve used to calculate the pI value (not shown) had excellent curve fitting, with an R-square value of 0.9982. The calculated pI values for all injections were plotted in orange diamonds (Figure 1, Panel A). Remarkable reproducibility was obtained across the 288 injections performed in the 3 independent experiments. The average pI value calculated for the pI 7.0 marker was 6.99, with a range of 6.93 to 7.06 and RSD less than 0.20%. The total analysis time for 96 injections was 810 minutes, translating to 8.44 minutes per injection. In summary, excellent accuracy and intermediate precision were obtained for pI marker 7.0 using high-throughput pI value determination by cIEF on the BioPhase 8800 system.
Accuracy and intermediate precision for cIEF analysis of USP mAb IgG SS RS
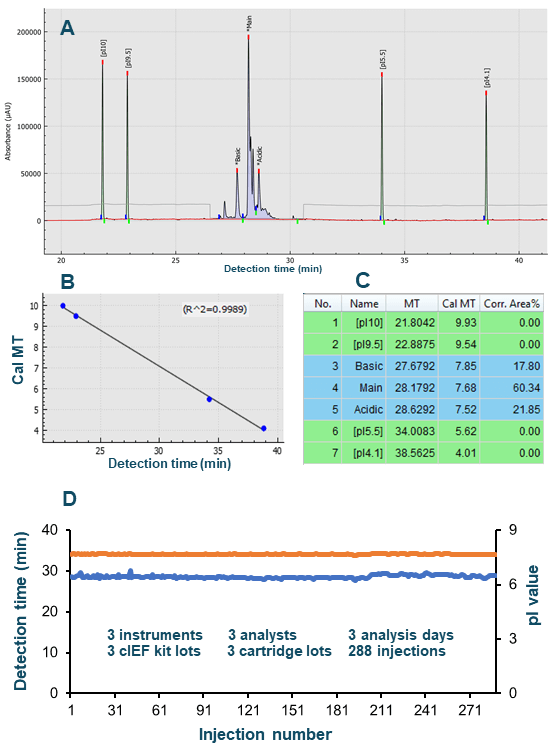
The accuracy of pI determination of the USP mAb IgG SS RS was assessed and representative results are presented in Figure 4. Panel A shows the electropherogram with peak identification and peak name displayed in annotation. Panel B illustrates excellent curve fitting with an R-square value of 0.9989, indicating high accuracy of pI determination. Panel C shows part of the results generated by the software. The calculated pI value for the main isoform was determined to be 7.68.
Next, a comprehensive and independent intermediate precision study of USP mAb IgG SS RS was performed on separate BioPhase 8800 systems with reagents and consumables from different lots. The 288 data points collected across these experiments for the detection time and calculated pI of the main isoform are plotted in Panel D of Figure 4. Small variation was observed for the detection time of the main isoform. However, remarkable intermediate precision was demonstrated for the calculated pI value due to the use of the standard curve for each sample run.
Assay robustness for cIEF analysis of USP mAb IgG SS RS on 3 BioPhase 8800 systems
Panel B of Figure 1 highlights the outstanding assay robustness achieved with cIEF analysis for the USP mAb IgG SS RS across independent experiments. Each bar represents the average corrected peak area percentage for basic, main or acidic isoforms, calculated from 96 data points collected on each of the three different BioPhase 8800 systems. Error bars indicate the standard deviation. The RSD values for corrected peak area percentage across all data points collected on 3 instruments were 1.97%, 1.05% and 2.67% for basic, main and acidic isoforms, respectively.
High intra- and inter-capillary reproducibility of cIEF analysis of USP mAb IgG SS RS
Since each neutral cartridge for cIEF analysis contains 8 different capillaries, consistency between results obtained from different injections from the same capillary (intra-capillary reproducibility) and consistency between results obtained from different capillaries (inter-capillary reproducibility) were assessed. Results from a representative BioPhase 8800 system were analyzed.
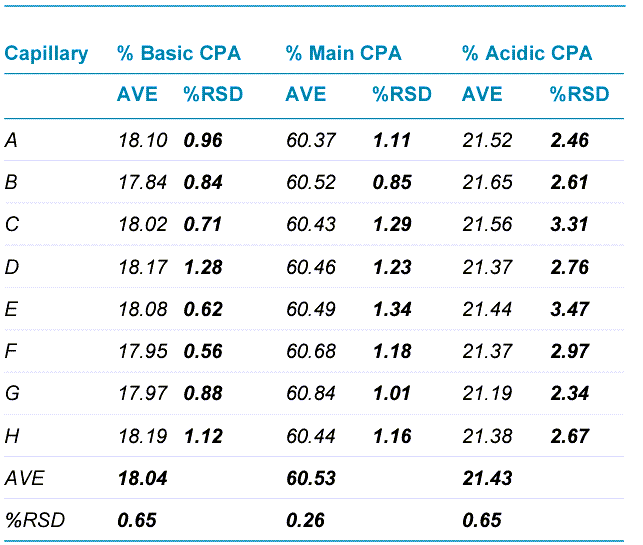
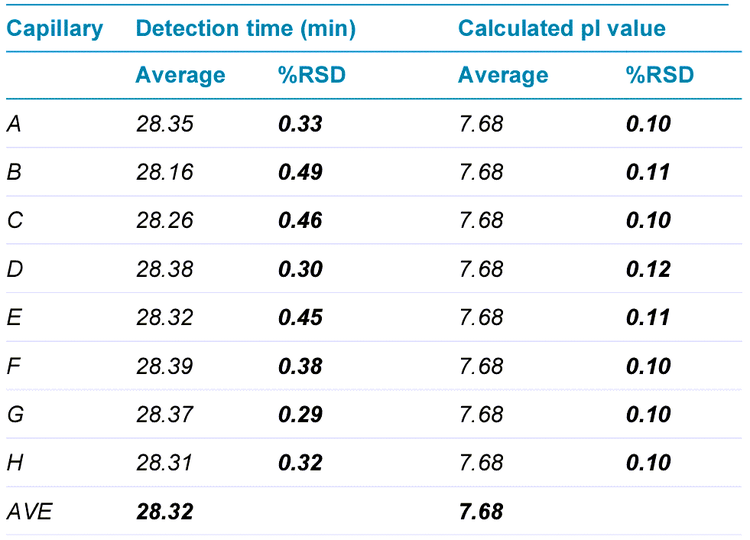
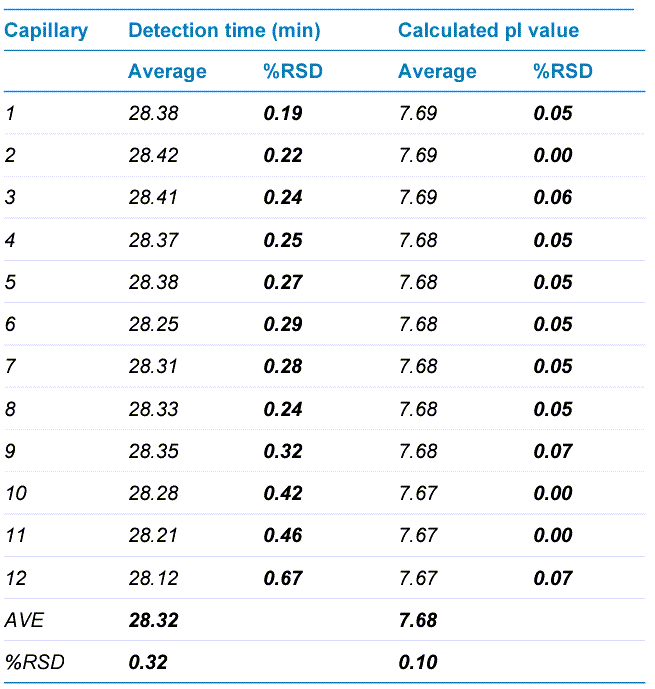
Table 2 summarizes high intra-capillary reproducibility in analysis of the corrected peak area percentages (%CPA) of the main,basic and acidic isoforms of the UPS mAb IgG SS RS. Each value in the “AVE” column represents the average value from 12 data points collected for each capillary. The corresponding RSD values are listed in the column labeled with “%RSD”. RSD values for %CPA of basic, main and acidic isoforms for each capillary were less than 1.30%, 1.35% and 3.50% respectively. The average values for %CPA for all 8 capillaries were similar, with RSD values of 0.65%, 0.26% and 0.65% for the basic, main and acidic isoforms, respectively. Therefore, these results demonstrate excellent inter-capillary reproducibility as well. Similarly, outstanding intra-capillary reproducibility and consistency were demonstrated for detection time and calculated pI values. These values for the main isoform of UPS mAb IgG SS RS are presented in Table 3. RSD values for detection time and calculated pI values for each capillary were less than 0.50% and 0.15%, respectively, for the main isoform. In addition, the average values for detection time and calculated pI value for all 8 capillaries were close, with RSD values of 0.27% and 0.02% for detection time and calculated pI value respectively. These results indicate remarkable consistency between the 8 capillaries. Similar results were obtained for the basic and acidic isoforms (data not shown). Detection time and calculated pI values were also compared between capillaries to test inter-capillary reproducibility. Table 4 reports the average values from 8 capillaries per sample column for the main isoform of UPS mAb IgG SS RS. RSD values for detection time and calculated pI values per sample column were less than 0.70% and 0.08%, respectively, indicating high inter-capillary reproducibility. Furthermore, average values for detection time and calculated pI value for all 12 columns were comparable, with RSD values of 0.32% and 0.10% for detection time and calculated pI value respectively. These results demonstrate excellent reproducibility between different sample columns. Similar results were obtained for the basic and acidic isoforms (data not shown).
Run life study of neutral cartridge
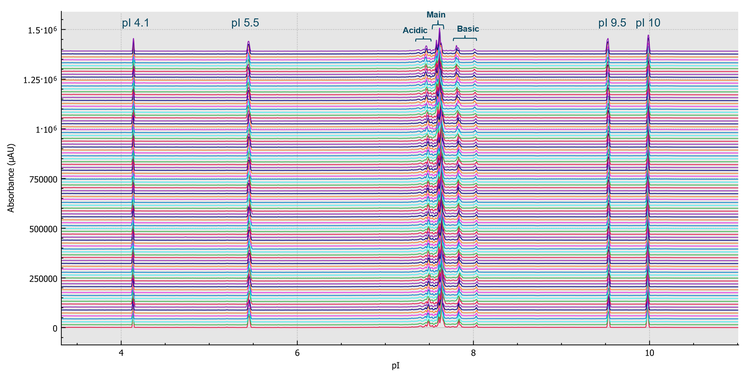
To demonstrate the durability of the neutral coated cartridge used on the BioPhase 8800 system, a run life study was performed by multiple analysts using multiple cartridges on multiple BioPhase 8800 instruments over multiple days. USP mAb IgG SS RS, pI markers and NIST mAb were used as test samples. An average of over 100 runs or 800 injections per cartridge were obtained using these test samples. Figure 5 shows an overlay of 96 representative electropherograms obtained for USP mAb IgG SS RS from runs 49 to 60. These electropherograms demonstrate excellent reproducibility in resolving the basic, main and acidic isoforms of the USP mAb IgG SS RS.
Conclusion
- The BioPhase 8800 system provides rapid, accurate and reproducible charge heterogeneity analysis via multi-capillary isoelectric focusing
- Ready-to-use cIEF kit and pre-assembled neutral coated cartridge simplify user workflow and assure assay reproducibility
- User friendly software with improved algorithm enables fast peak integration and post analysis
- Highly accurate pI determination was obtained with 4-point standard curve and R-square values above 0.9980
- Outstanding intra- and inter-capillary as well as overall reproducibility were demonstrated
- Long run life was demonstrated by obtaining reproducible results for 100 runs or 800 injections with test samples, which can save cost and add value
- Parallel processing of 8 samples simultaneously allows for significant improvements in method development optimization time in comparison to single capillary systems