Abstract
This technical note demonstrates the high-throughput N-linked glycan analysis of the NIST monoclonal antibody (NISTmAb), trastuzumab and etanercept (Figure 1) utilizing the Fast Glycan Labeling and Analysis kit for the BioPhase 8800 system. It describes the entire workflow—from sample preparation (denaturation, digestion, labeling and cleanup) to data analysis— and shows the accuracy and reliability of the workflow.
Introduction
In early therapeutics development, the ability to quickly screen many clones and cell culture expression conditions is critical, while in later stages, extensive characterization becomes essential. Since glycosylation plays a significant role in the stability, safety and efficacy of protein therapeutics, glycan expression profiling is a critical quality attribute (CQA) that must be monitored closely. Therefore, a streamlined, accurate and high-throughput glycan analysis assay is necessary for all phases of biopharmaceutical development.
The BioPhase 8800 system is a multi-capillary platform that consists of eight capillaries, enabling users to process five 96- well plates (or 480 samples) in one working day using the Fast Glycan Labeling and Analysis kit. The streamlined data analysis utilizes predefined integration parameters. The automatic glycan peak assignment is based on glucose units and uses a fully customizable glycan library, which enables accurate identification.
Key features of released N-linked glycan analysis
- High-throughput glycan analysis workflow: The workflow can achieve a 1-minute-per-sample analysis rate.
- Intuitive and flexible data analysis software: BioPhase software provides automatic peak identification for common N-glycans. It also allows customers to customize their glycan libraries based on molecule type.
- All-inclusive sample preparation in one kit: The Fast Glycan Labeling and Analysis kit provides all the chemicals and enzymes needed for N-glycan analysis.
Methods
Materials: The Fast Glycan Labeling and Analysis kit (P/N: C30098) was from SCIEX. The NISTmAb, Humanized IgG1κ Monoclonal Antibody, was from NIST reference material (RM) 8671. The adalimumab and trastuzumab were purchased from the local pharmacy.
Instrument: The BioPhase 8800 system (P/N: 5083590F), a BFS capillary cartridge – 8 x 30 cm (P/N: 5080121) and a starter kit of four sample plates, four reagent plates and eight outlet plates (P/N: 5080311) were from SCIEX. The BioPhase 8800 system was equipped with a laser-induced fluorescence (LIF) detector and 520 nm emission filter (P/N: 144940).
Software: BioPhase software 1.2 was used to create the instrument method and sequence for data acquisition and processing.
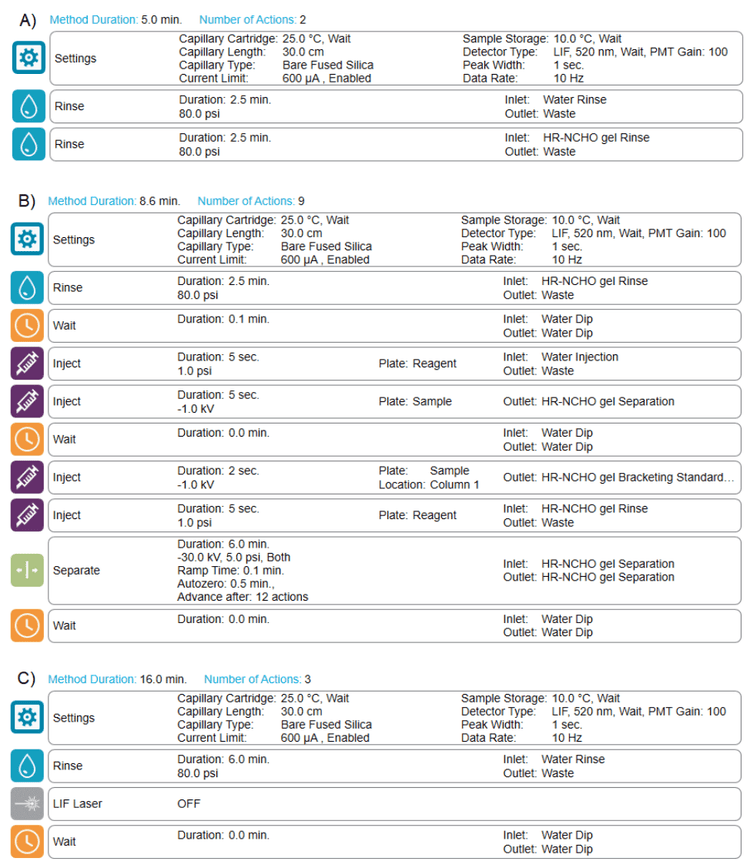
Methods and sequence: Figure 2 shows the A) conditioning method, B) separation method and C) shutdown method for glycan analysis. A typical fast glycan analysis sequence starts with the conditioning method, progresses to the separation method for analyzing standards and unknown samples and then ends with the shutdown method.
Instrument setup: Reagents and sample plates were loaded according to the reagent plate map for the corresponding sequence. Multiple sequences were performed using two instruments, two cartridges from different lots and reagent kit from three different lots.
Superior fast glycan sample preparation
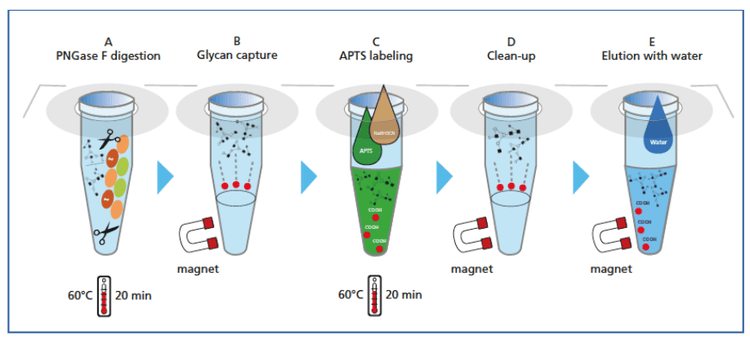
Figure 3 shows the magnetic bead-mediated sample preparation workflow, which consists of five steps: A) sample denaturation and digestion, B) glycan capture C) APTS labeling, D) cleanup and E) elution with water. The detailed steps for sample preparation can be found in the application guide for the Fast Glycan Labeling and Analysis kit.1
This magnetic bead-mediated sample preparation shows great benefits. First, the sample is prepared with an open tube, so better labeling efficiency can be achieved. Second, this method does not require centrifugation, and is therefore amenable to automation. In addition, the throughput is much higher: eight samples can be prepared simultaneously within 70 minutes.
High-resolution glycan separation and streamlined data analysis
Preloaded separation methods and sequence templates for glycan analysis are available in the BioPhase software, facilitating usability.
A bracketing standard with DP2 and DP15 is integrated in the first sample row as anchors to ensure correct glucose unit calculation and peak assignment for later data analysis.
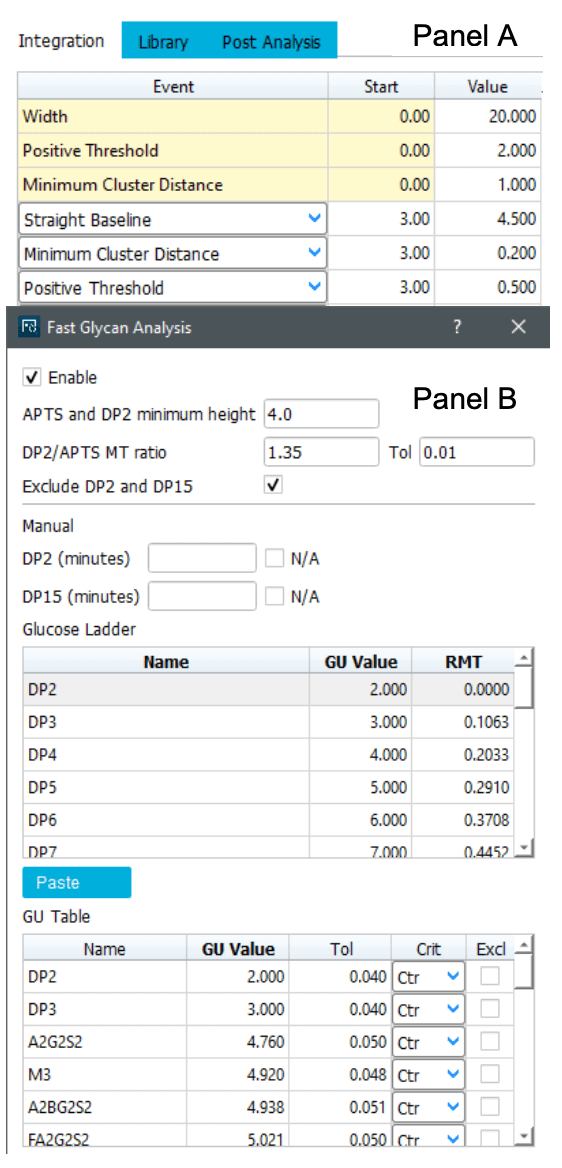
Predefined integration parameters (.dana file) and a glycan library (.glycan file) are also preloaded for data analysis. All parameters needed for data integration, glucose unit tables for glucose ladder and N-linked glycan species (Figure 4) are embedded in these files.
As all parameters will directly impact the identification, it must be customized based on different modalities during data analysis.
The integration process is described in a previous technical note2 and is beyond the scope of the discussion here.
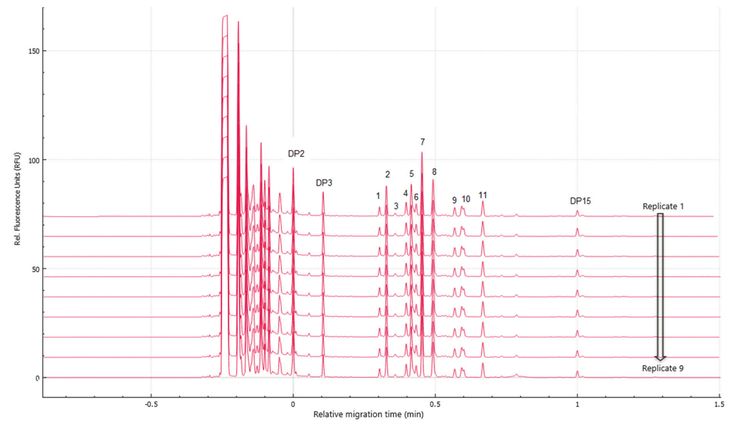
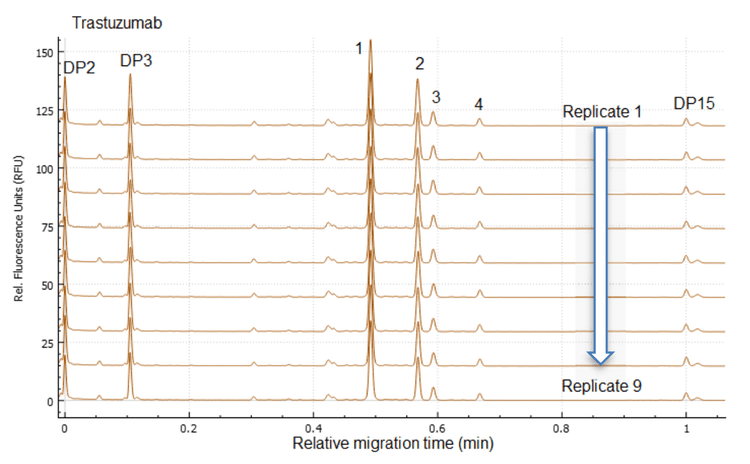
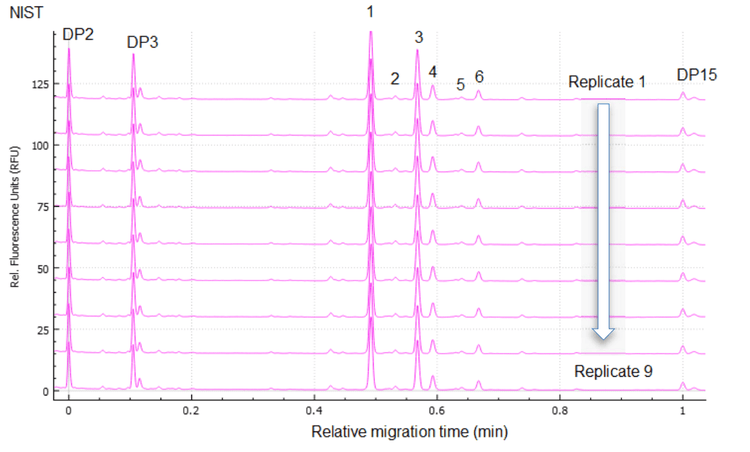
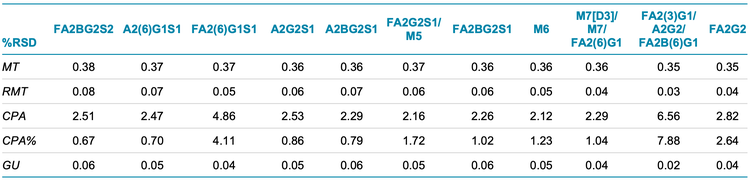
Figure 1, Figure 5 and Figure 6 show the overlays of nine replicates of N-linked glycan analysis from etanercept, trastuzumab and NISTmAb, demonstrating a high level of reproducibility. Four major N-linked glycans were detected in trastuzumab, including FA2, FA2(6)G1, FA2(3)G1 and FA2G2 (Figure 5). In addition to the four glycans detected in trastuzumab, three more glycans were observed in the NISTmAb electropherogram: FA2B, M7[D1] and A2BG2 (Figure 6). A more complex glycan profiling was achieved by employing the Fast Glycan Labeling and Analysis kit. The data (Figure 1) from etanercept demonstrates the ability of the kit to complex fusion proteins. Eleven N-linked glycans were separated and identified, including high mannose species and complex glycans. Sialylated glycans are the dominant species observed in the profile, including bi- and tri-antennary glycans. All of the glycan assignments are consistent with the findings detailed in previous publications3,4, highlighting the accuracy and reliability of the automatic software characterization.
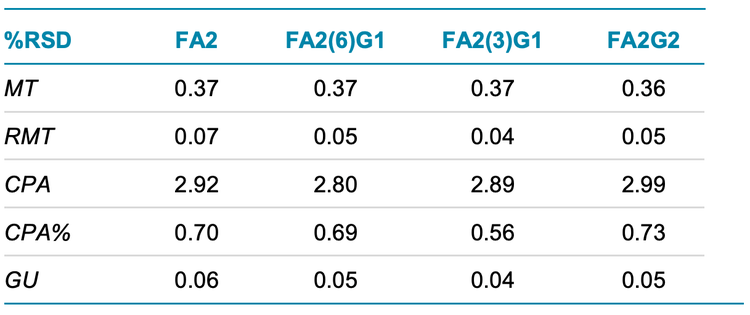
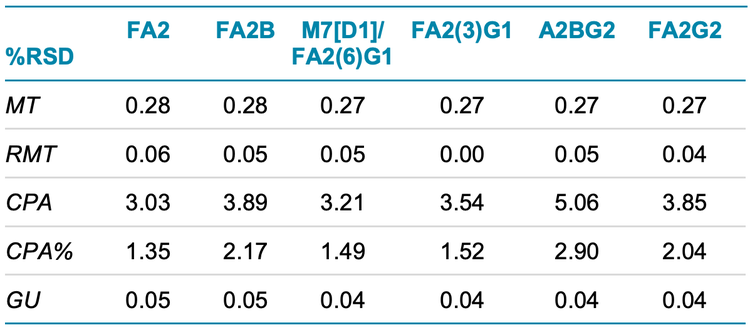
To evaluate the reproducibility of this workflow, a statistical analysis was performed on the nine replicates of N-linked glycan analysis from trastuzumab, NISTmAb and etanercept. The results are separately presented in Table 1, Table 2 and Table 3. The tables include migration time (MT), relative migration time (RMT), corrected peak area (CPA), corrected peak area percentage (CPA%) and glucose units (GU).
Conclusion
- The Fast Glycan Labeling and Analysis kit for the BioPhase 8800 system provides all-inclusive sample preparation and a high-throughput glycan analysis workflow for mAbs and complex glycan profiling
- BioPhase software performed reliable glycan peak identifications with average GU %RSD values lower than 0.06% for all three proteins
- The customizable library allows for streamlined and reliable data analysis
- The workflow can achieve a 1-minute-per-sample analysis rate
References
- Fast Glycan Labeling and Analysis kit for the BioPhase 8800 system. SCIEX application guide, RUO-IDV-05- 8648-A.
- Wang, F. et al. High-throughput released N-glycan identification using CE and a customizable glycan library. SCIEX technical note, MKT-26425-A.
- Giorgetti, J. et al. Monoclonal antibody N-glycosylation profiling using capillary electrophoresis – Mass spectrometry: Assessment and method validation. Talanta. 2018, 178: 530–537. doi: 10.1016/j.talanta.2017.09.083.
- Tan, Q. et al. Characterization and comparison of commercially available TNF receptor 2-Fc fusion protein products; mAbs 2012, 4(6): 761–774. doi: 10.4161/mabs.22276.