High-throughput released N-glycan identification using CE and a customizable glycan library
Featuring the BioPhase 8800 software and the BioPhase Fast Glycan Labeling and Analysis kit
Fang Wang, Roy Estrada and Greg Manley
SCIEX, USA
Abstract
This technical note demonstrates the procedures for a highthroughput N-linked glycan identification using the new BioPhase Fast Glycan Labeling and Analysis kit with the BioPhase 8800 system. This kit allows customers to achieve large-scale Nglycan profiling with streamlined sample preparation. The userfriendly BioPhase 8800 software empowers customers to customize molecule-specific glycan libraries, which can be employed in a platform separation method.

The SCIEX solution for glycan analysis on the next-generation multichannel BioPhase 8800 system.
Introduction
The early stages of biotherapeutics development require thousands of samples to be screened monthly. High-throughput assays are therefore needed to shorten the development time, while providing reliable data to comprehensively characterize and monitor critical attributes, such as protein purity, charge variant distribution and glycan profiling. Glycosylation plays a significant role in the stability, safety and efficacy of protein therapeutics and is often considered a critical quality attribute (CQA). Therefore, it is necessary to closely monitor the glycan profile of a biotherapeutic molecule throughout the entire development process.
In 2017, SCIEX launched a Fast Glycan Labeling and Analysis kit that can be used on the PA800 Plus system. The kit provides fast sample preparation with a separation cycle time less than 9 minutes for N-linked glycans. But when such technique (now using the BioPhase Fast Glycan Labeling and Analysis kit) is coupled with the parallel capabilities of the 8 capillaries on the BioPhase 8800 system, it allows glycan analysis to be performed at rates as fast as 1 minute per sample. Further, the newly released BioPhase 8800 software allows customers to modify the N-glycan library based on a specific molecule, which provides flexibility in data analysis and increases confidence in the identification.
Key features of the glycan analysis workflow
- High-throughput glycan analysis workflow: The workflow can achieve a 1-minute per sample analysis rate
- Flexible data analysis software: The BioPhase 8800 software provides automatic peak identification for common N-glycans and allows customers to customize their glycan libraries based on molecule type
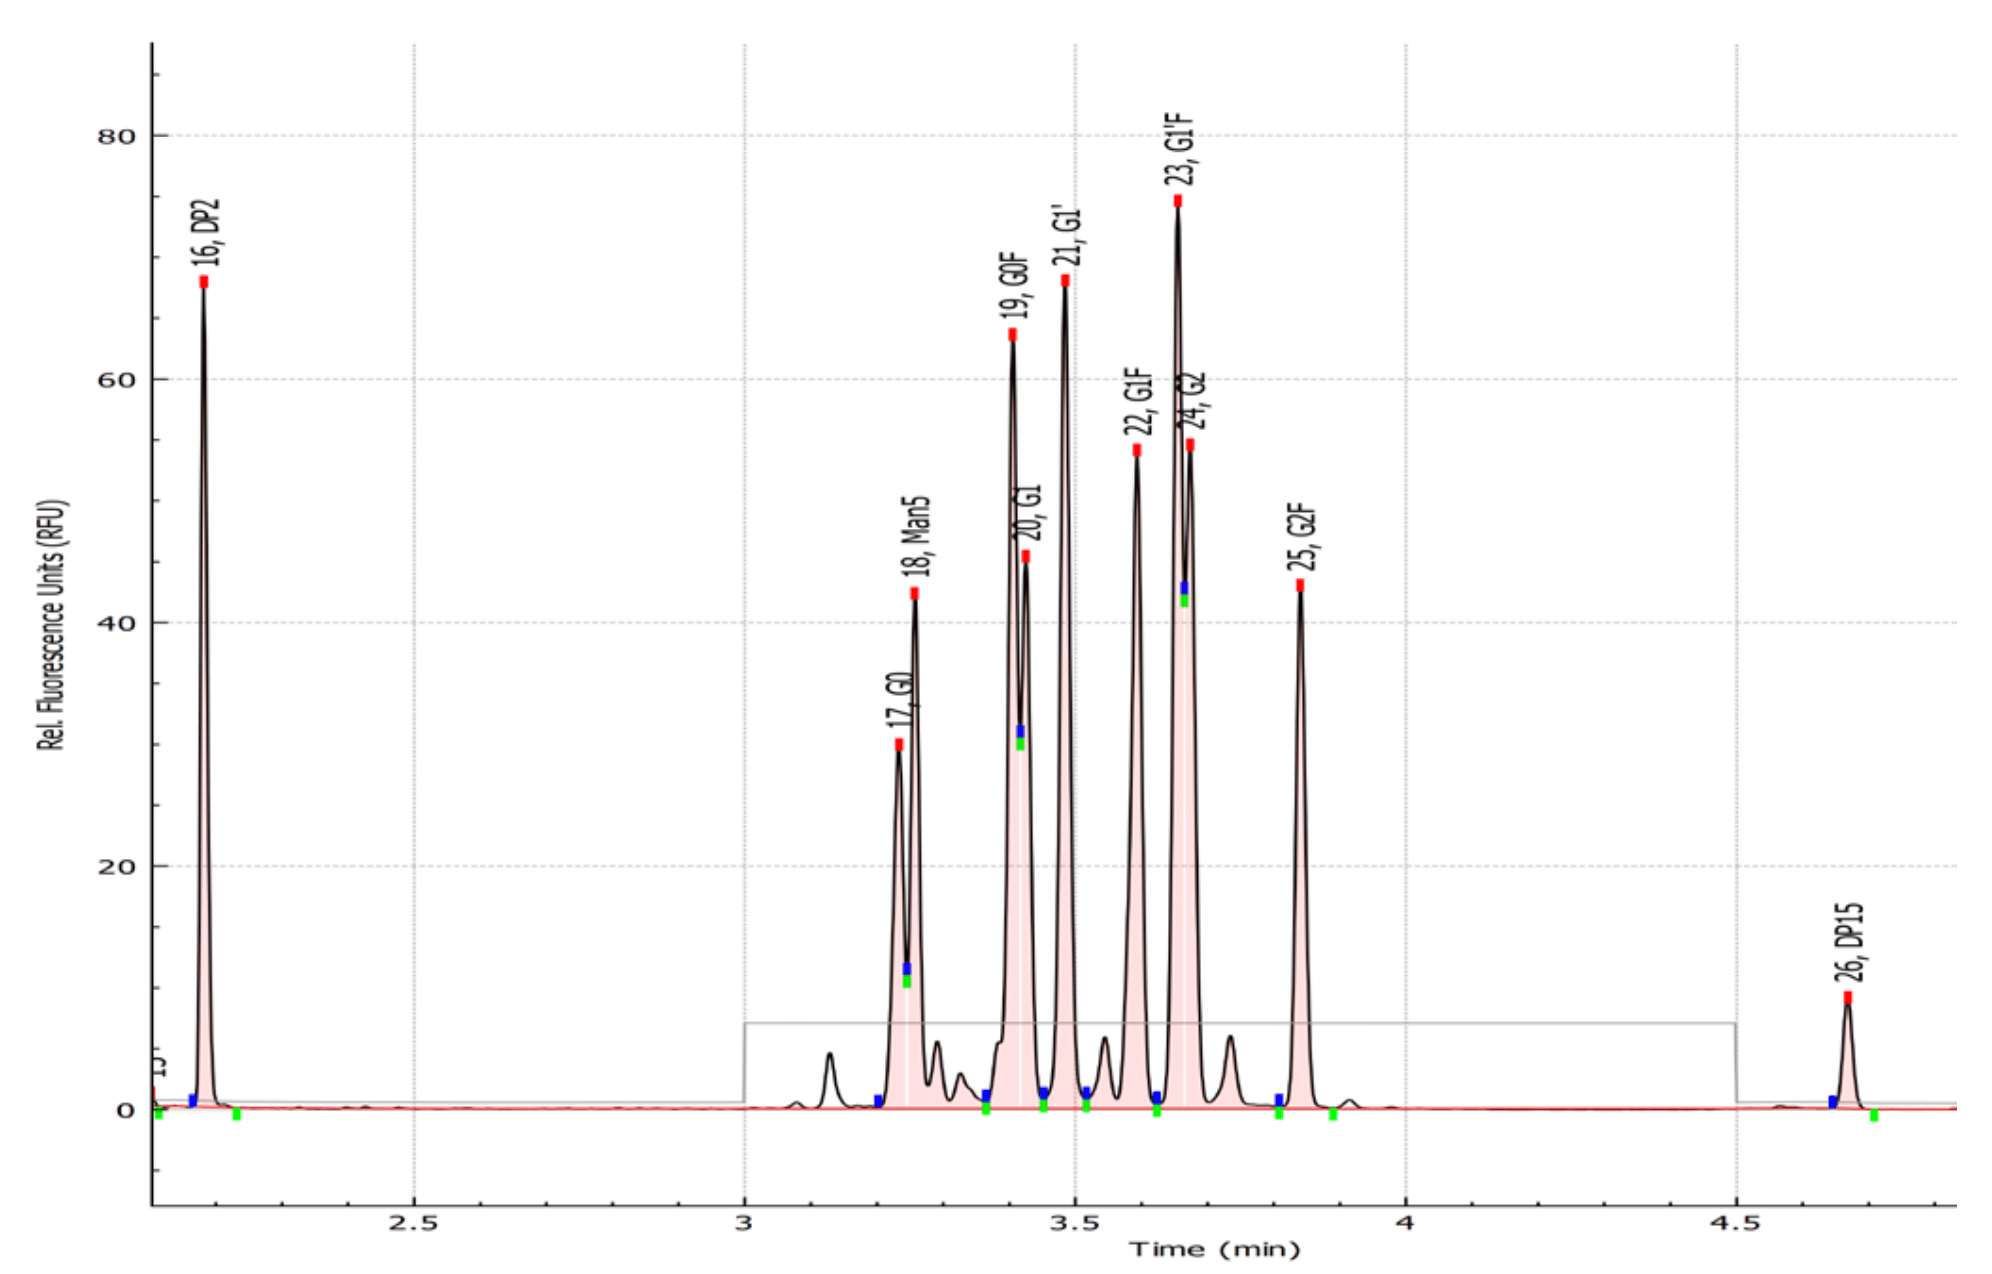
Figure 1. Standard glycan panels containing 9 glycan standards identified with a customized glycan library using the Fast Glycan Analysis module in the BioPhase 8800 software.
Methods
Materials: The BioPhase Fast Glycan Labeling and Analysis kit (P/N: C30098) was from SCIEX (Framingham, MA). A test mix containing 9 glycan standards was provided as a gift from the SCIEX research and development group. The test mix includes APTS-labeled G0, G0F, G1, G1F, G2, G2F, Man5, Man6 and Man7 at concentrations similar to a typical monoclonal antibodyreleased glycan mixture (Figure 1).
Instruments: The BioPhase 8800 system (P/N: 5083590F), BioPhase BFS capillary cartridge - 8 x 30 cm (P/N: 5080121), and BioPhase sample and reagent plates (4,4,8) (P/N: 5080311) were from SCIEX. The BioPhase 8800 system was equipped with a laser-induced fluorescence (LIF) detector. The excitation and emission wavelengths of the LIF detector were 488 and 520 nm, respectively.
Software: The BioPhase 8800 software, version 1.2 was used to create the instrument method and sequence and for data acquisition and processing.
Glycan standard preparation: To make a 9-glycan standard sample for testing, 10 µL of the glycan standard mixture stock was mixed with 50 µL of CE-grade water. The sample mixture was briefly spun down to remove bubbles and collect all liquid at the bottom of the tube. A 55 µL aliquot of the solution was transferred into a sample well.
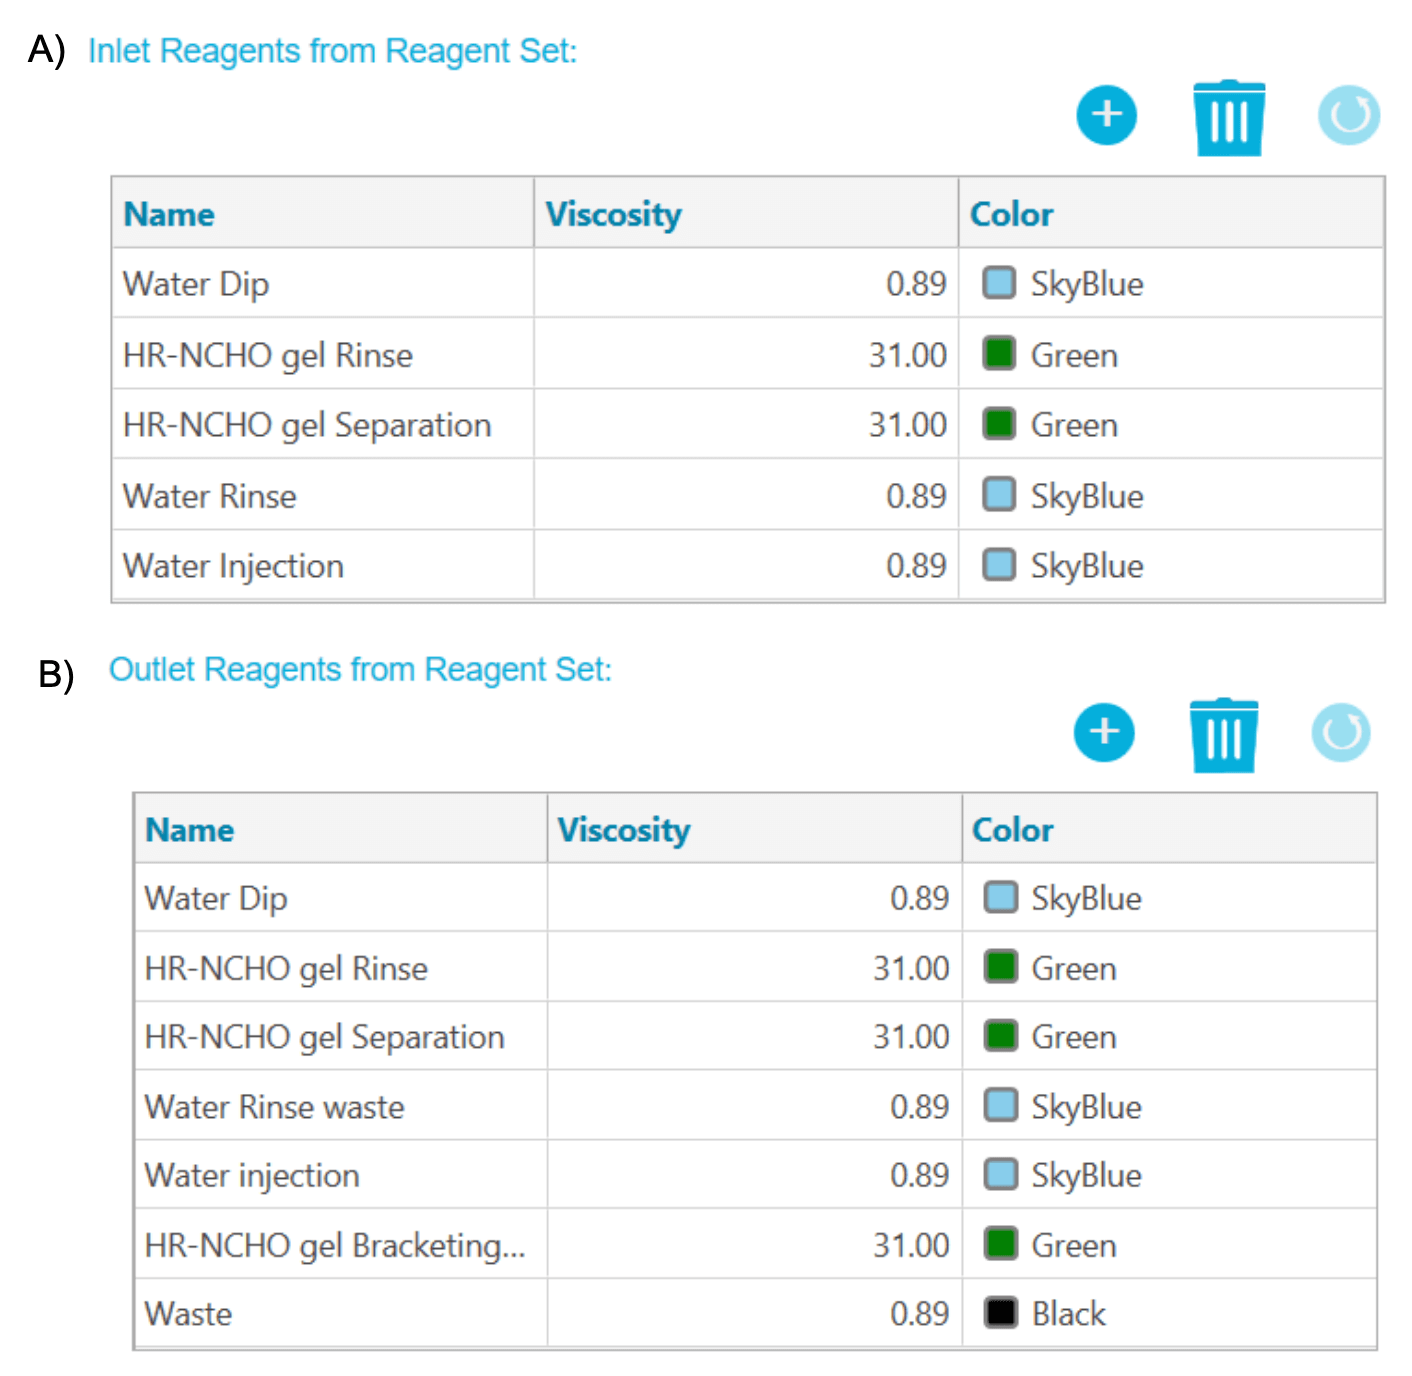
Figure 2. The reagent profile. A) Inlet reagent profile and B) outlet reagent profile.
Bracket standards (BST) preparation: The BST was prepared following the fast glycan application guide.1 Specifically, 200 μL of CE-grade water was added to the BST vial in the kit and mixed using a vortex mixer. The resulting solution was dispensed into vials in 80 or 40 µL aliquots. To prepare enough samples for all 8 capillaries, 760 µL of CE-grade water was added to an 80 µL aliquot of the reconstituted BST and then mixed using a vortex mixer. A 100 µL sample of the diluted BST solution was transferred to row #1 of each testing column. BST was injected into the capillary for each analysis before the sample injection.
Figure 3. Instrument method settings. A) Conditioning method, B) separation method and C) shutdown method.
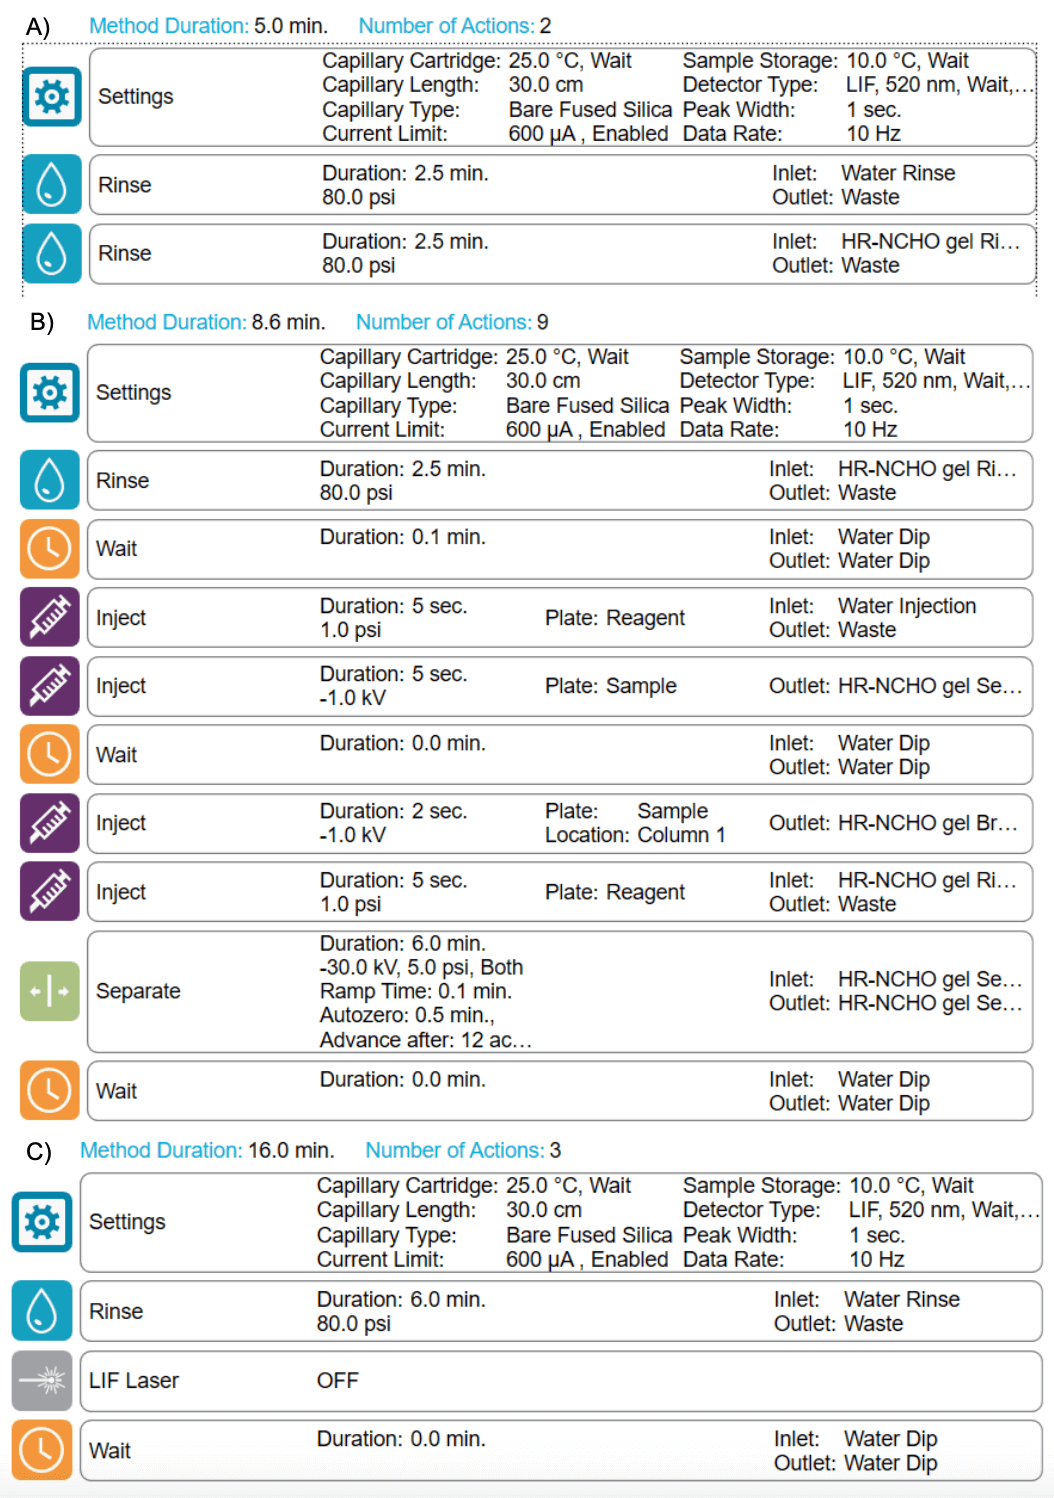
Methods and sequence: Figure 2 shows the inlet reagent (Figure 2A) and outlet reagent profiles (Figure 2B). Figure 3 shows the conditioning (Figure 3A), separation (Figure 3B) and shutdown (Figure 3C) methods. A typical sequence starts with the conditioning method, then the separation method is used to analyze standards and unknown samples. Finally, the sequence ends with the shutdown method. The reagent files, method files and a sample sequence can be downloaded from the SCIEX website.1
Instrument setup: Reagents and samples were loaded following the reagent plate map for the corresponding sequence. Multiple sequences were performed with 2 different cartridges, 3 different reagent lots and triplicate injections of each condition. Data were collected and processed following the steps described below.
Data processing: Data processing was achieved using the BioPhase 8800 software with the Fast Glycan Analysis module turned on. Detailed settings can be found in the results and discussion section.
Results and discussion
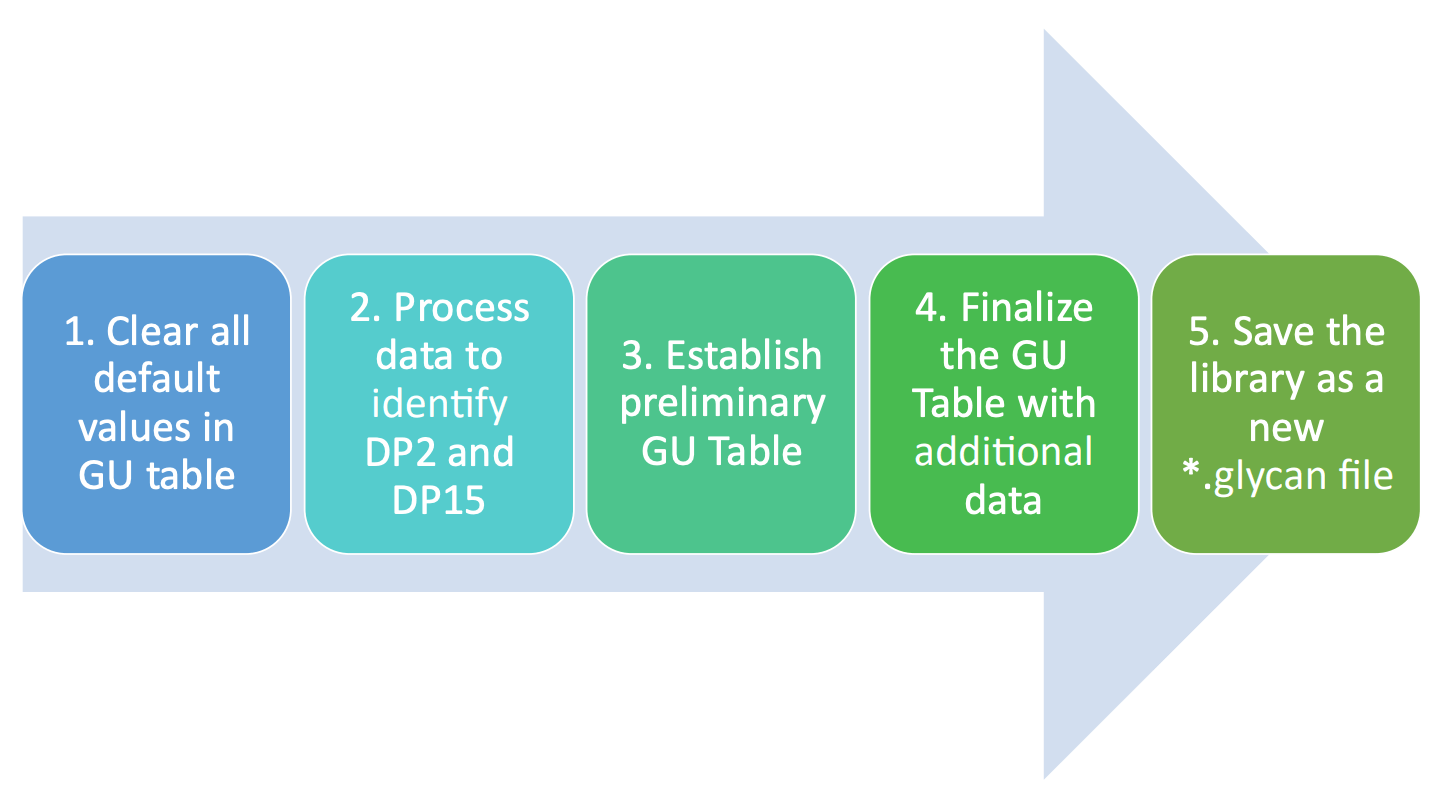
This technical note demonstrates a streamlined workflow to customize a molecule-specific glycan library with mixtures of glycan standards. In this workflow, glucose unit (GU value), a calibrated value based on the migration time of the APTSlabeled glycan peaks relative to the GU ladder, was used for peak identification. The APTS-labeled glycan standards were first analyzed using the instrument method shown in Figure 3B. Data from multiple sequences were collected and used to demonstrate the robustness of the identification method and the process of building or modifying glycan species in the GU table for future analysis. Figure 4 shows a high-level workflow for this procedure.
Figure 4. Summary of the workflow to build the fast glycan identification library using standards.
Step 1: Load the data into the processing module and enable the Fast Glycan Analysis module in the Post Analysis tab. In the Fast Glycan Analysis pop up window, check the Enable box and clear the GU table at the bottom, while keeping all contents in the Glucose Ladder section (Figure 5B). Choose an example data profile to be analyzed. Click Analyze to process the data. If the default parameters are not suitable for the results, proceed to step 2.
Step 2: Adjust the parameters in the Integration tab to allow APTS, DP2, DP15 and all major glycan standards to be integrated. Non-glycan peaks should not be integrated. Adjust the APTS and DP2 minimum height and DP2/APTS MT ratio to allow these 3 peaks to be identified (Figure 5). Specifically, if the height of DP2 in the electropherogram is smaller than the value shown in the APTS and DP2 minimum height box, lower the minimum height value. If another labeling artifact present between the APTS and DP2 peaks is mistakenly identified as DP2, increase the minimum height value and/or reduce the Tol value in theDP2 / APTS MT ratio (Figure 5, insert B). Use parameters such as the positive threshold, minimum cluster distance, straight baseline and suspend integration to optimize the peak integration (Figure 5, insert A).
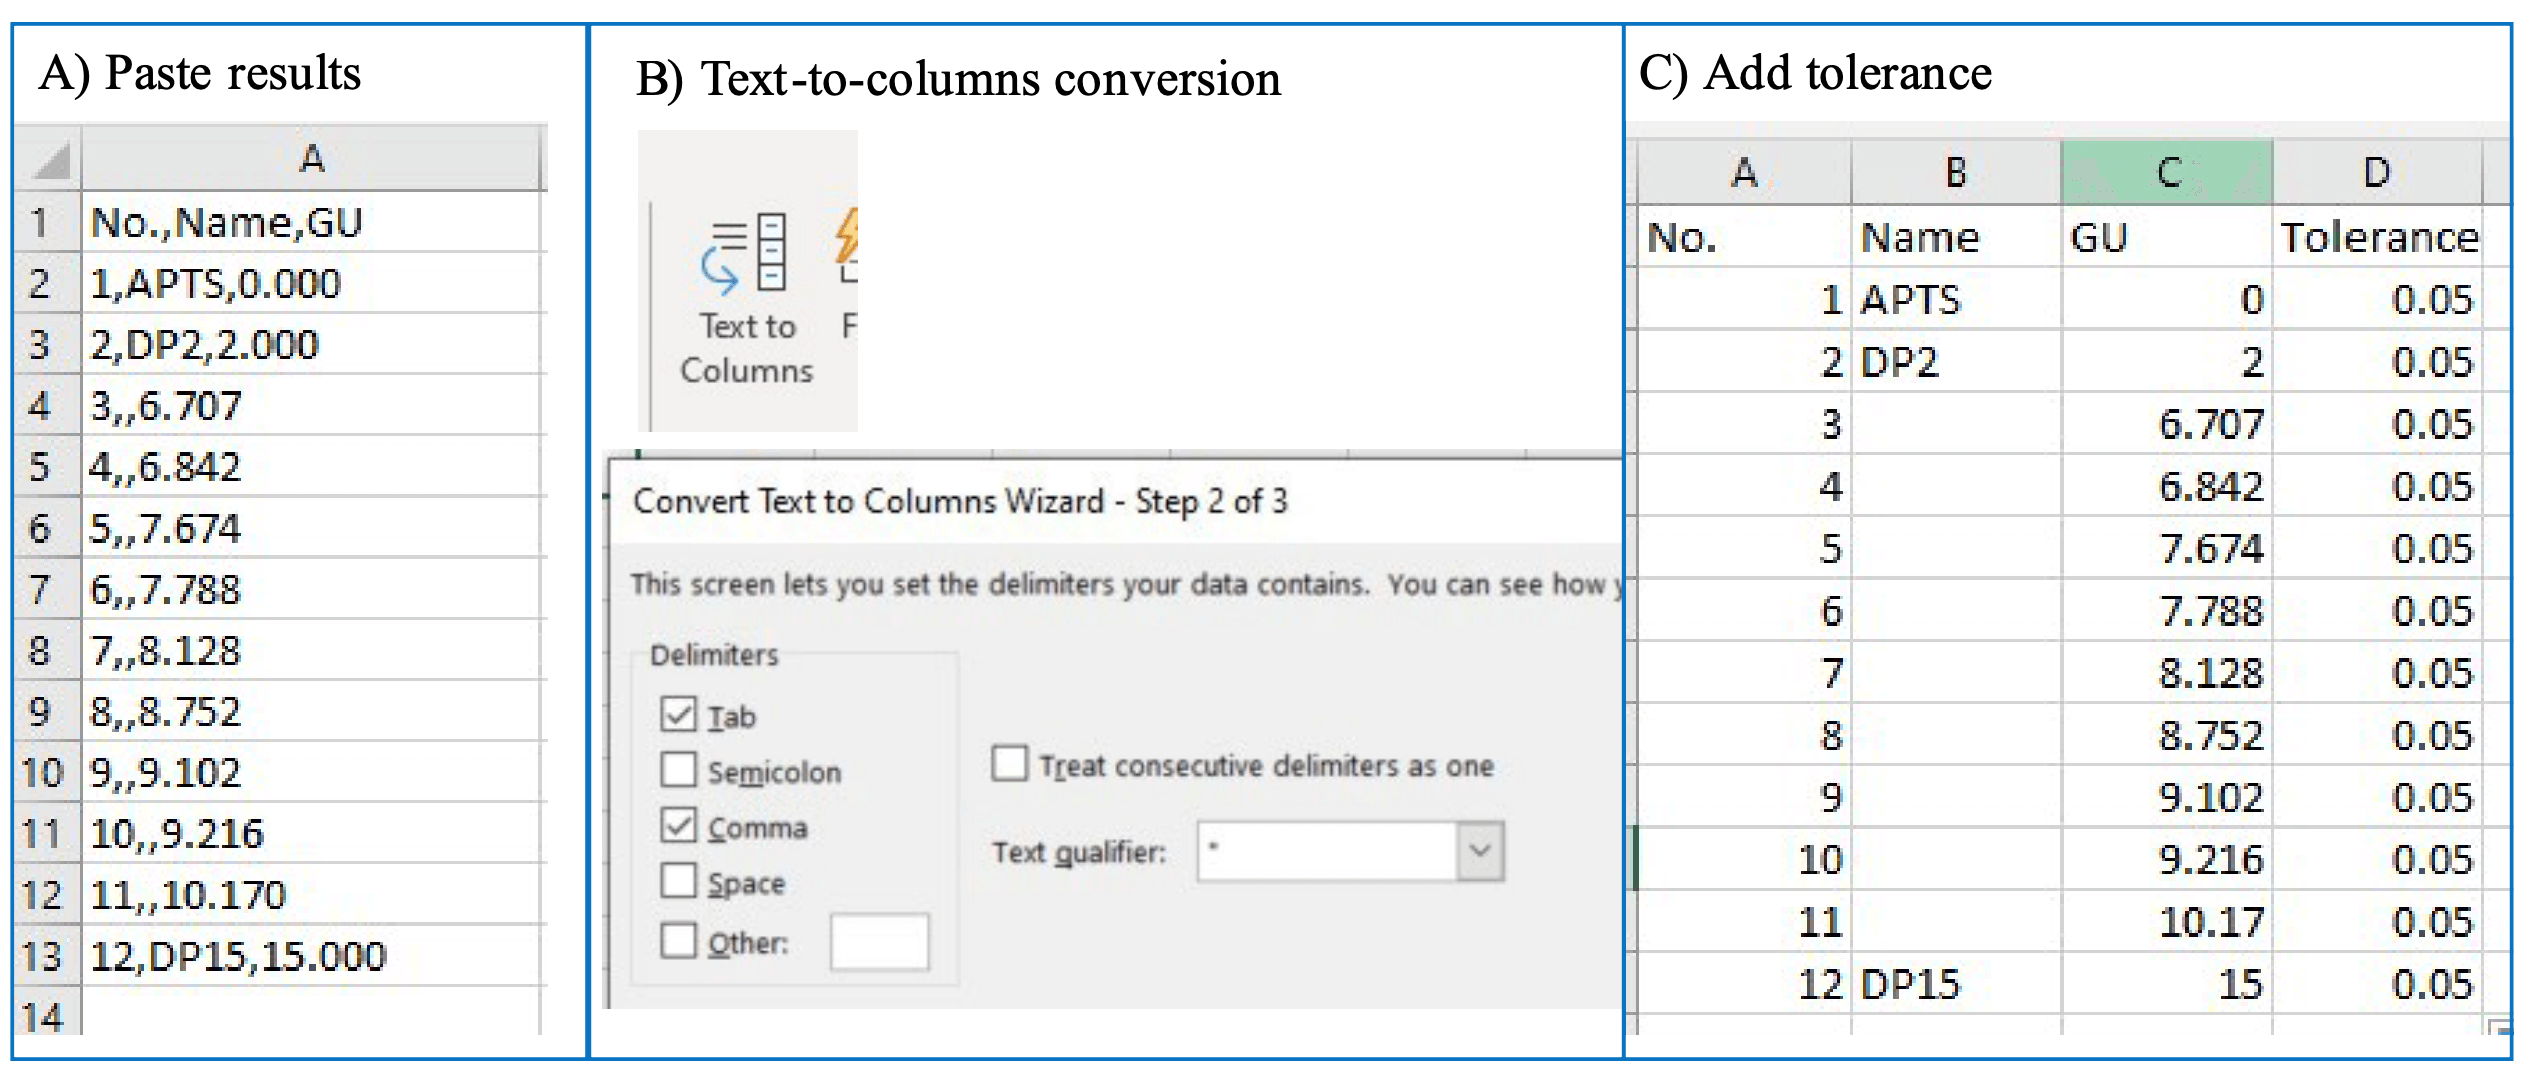
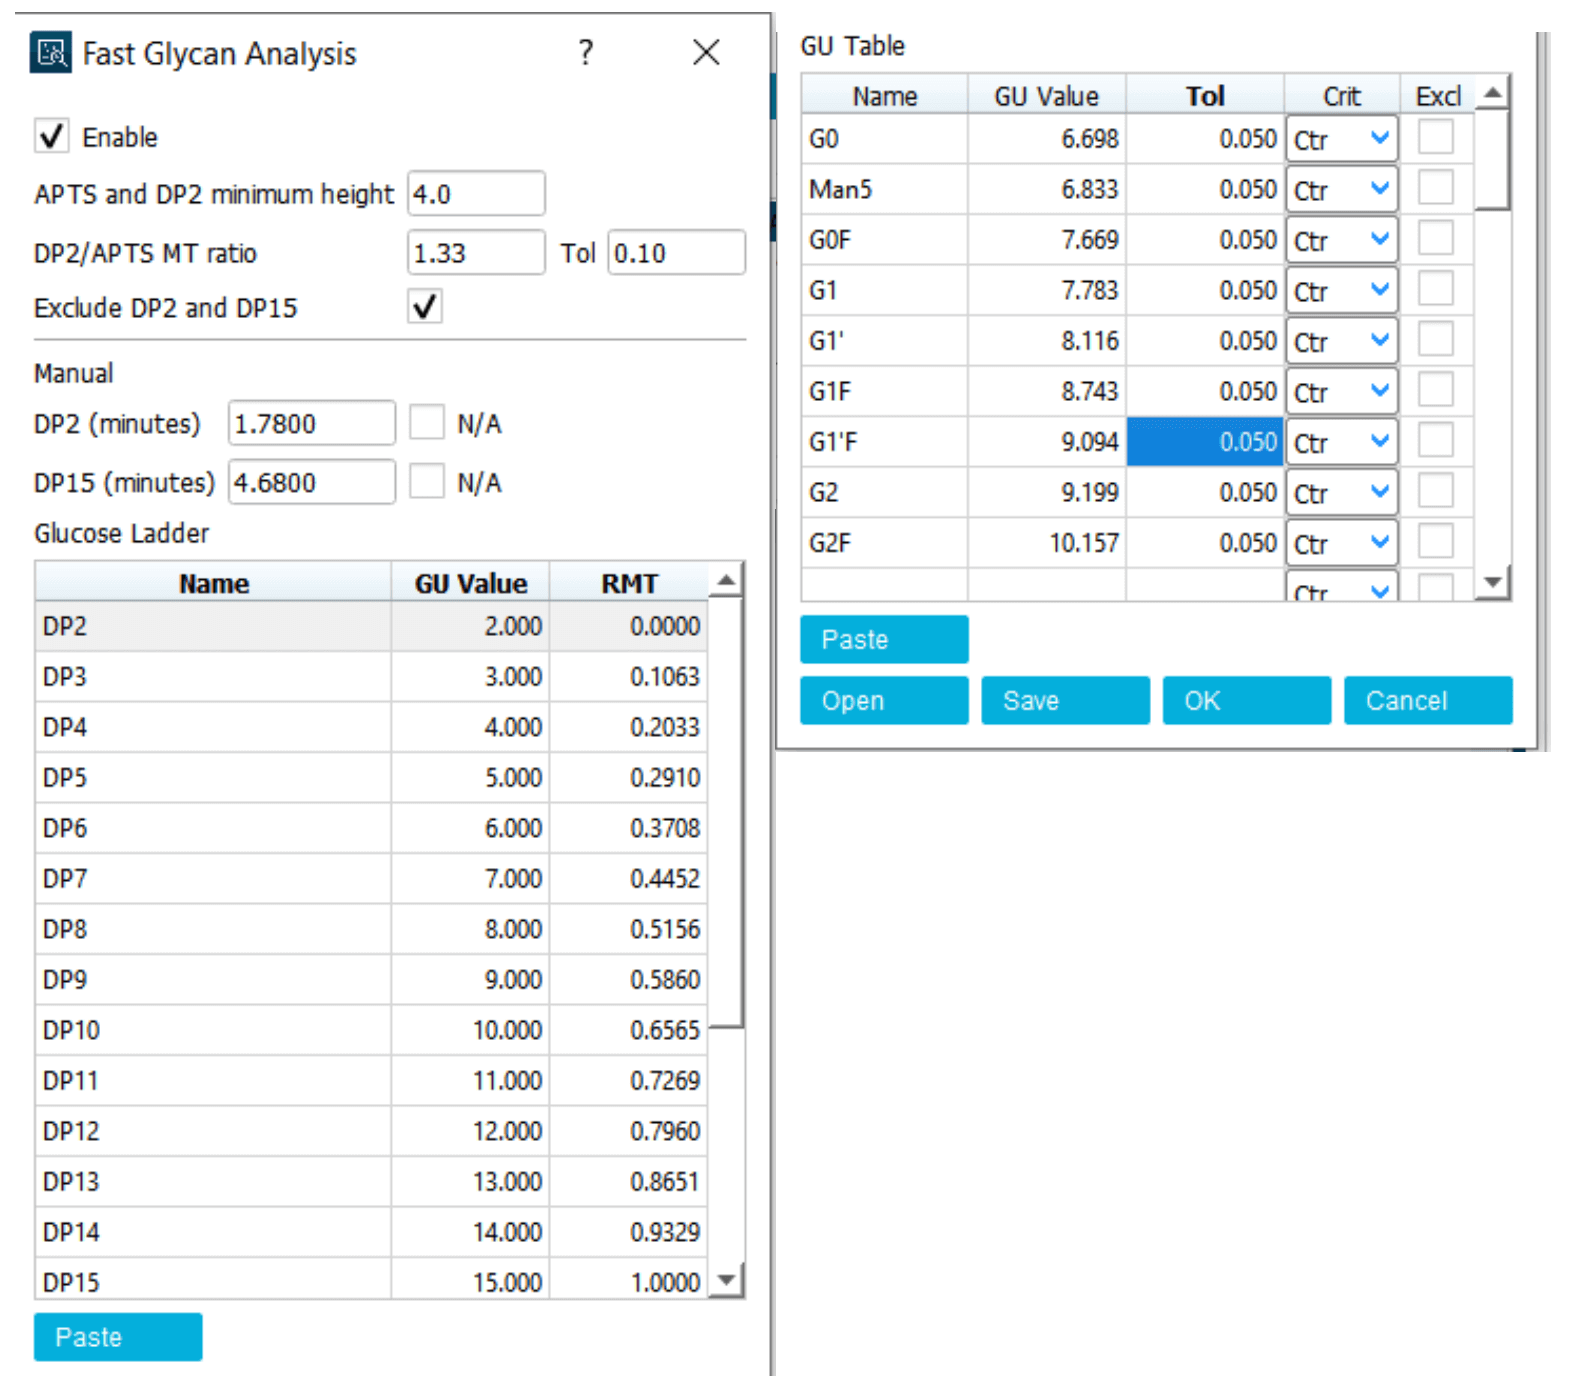
Step 3: In the results table under the electropherogram, keep the peak number, name and GU value columns active and uncheck the remaining columns (Figure 5, insert C). Copy the results into a Microsoft Excel spreadsheet and convert the pasted text to columns, as shown in Figures 6A and 6B. Add an additional column called Tolerance. Add a value of 0.05 for tolerance for each row (Figure 6C). Names of the glycan standards can be added based on sample information. Table 1 shows the preliminary GU table corresponding to the electropherogram shown in Figure 5. After the preliminary GU table is built, the values are manually pasted into the GU Table module of the Fast Glycan Analysis module (Figure 7). Click the Analyze button to process the data. Apply the processing method and analyze all the loaded data.
Step 4: Check all data and adjust the Integration parameters if necessary to ensure the standard runs are processed properly. DP2 and DP15 should be identified and more than 90% of the selected data files should have all standard peaks identified and labeled. Using the overlay option, export the GU values of all the data files. Calculate the tolerance of the GU table by multiplying the standard deviation (SD) in the summary table by 5 for each identified glycan species. Update the preliminary GU table with the new tolerance value and update the GU value with the mean of the processed data (Table 1). Process all data again and confirm the robustness of the final processing method.
Figure 5. Electropherogram of glycan standard mixture with key marker peaks identified. The electropherogram of the glycan standard mixture was analyzed with the Integration parameters shown in insert A and Fast Glycan Analysis parameters shown in insert B. This method allowed the integration and identification of the marker peaks for APTS, DP2 and DP15. Inset C shows the results table with No. Name and GU column selected.
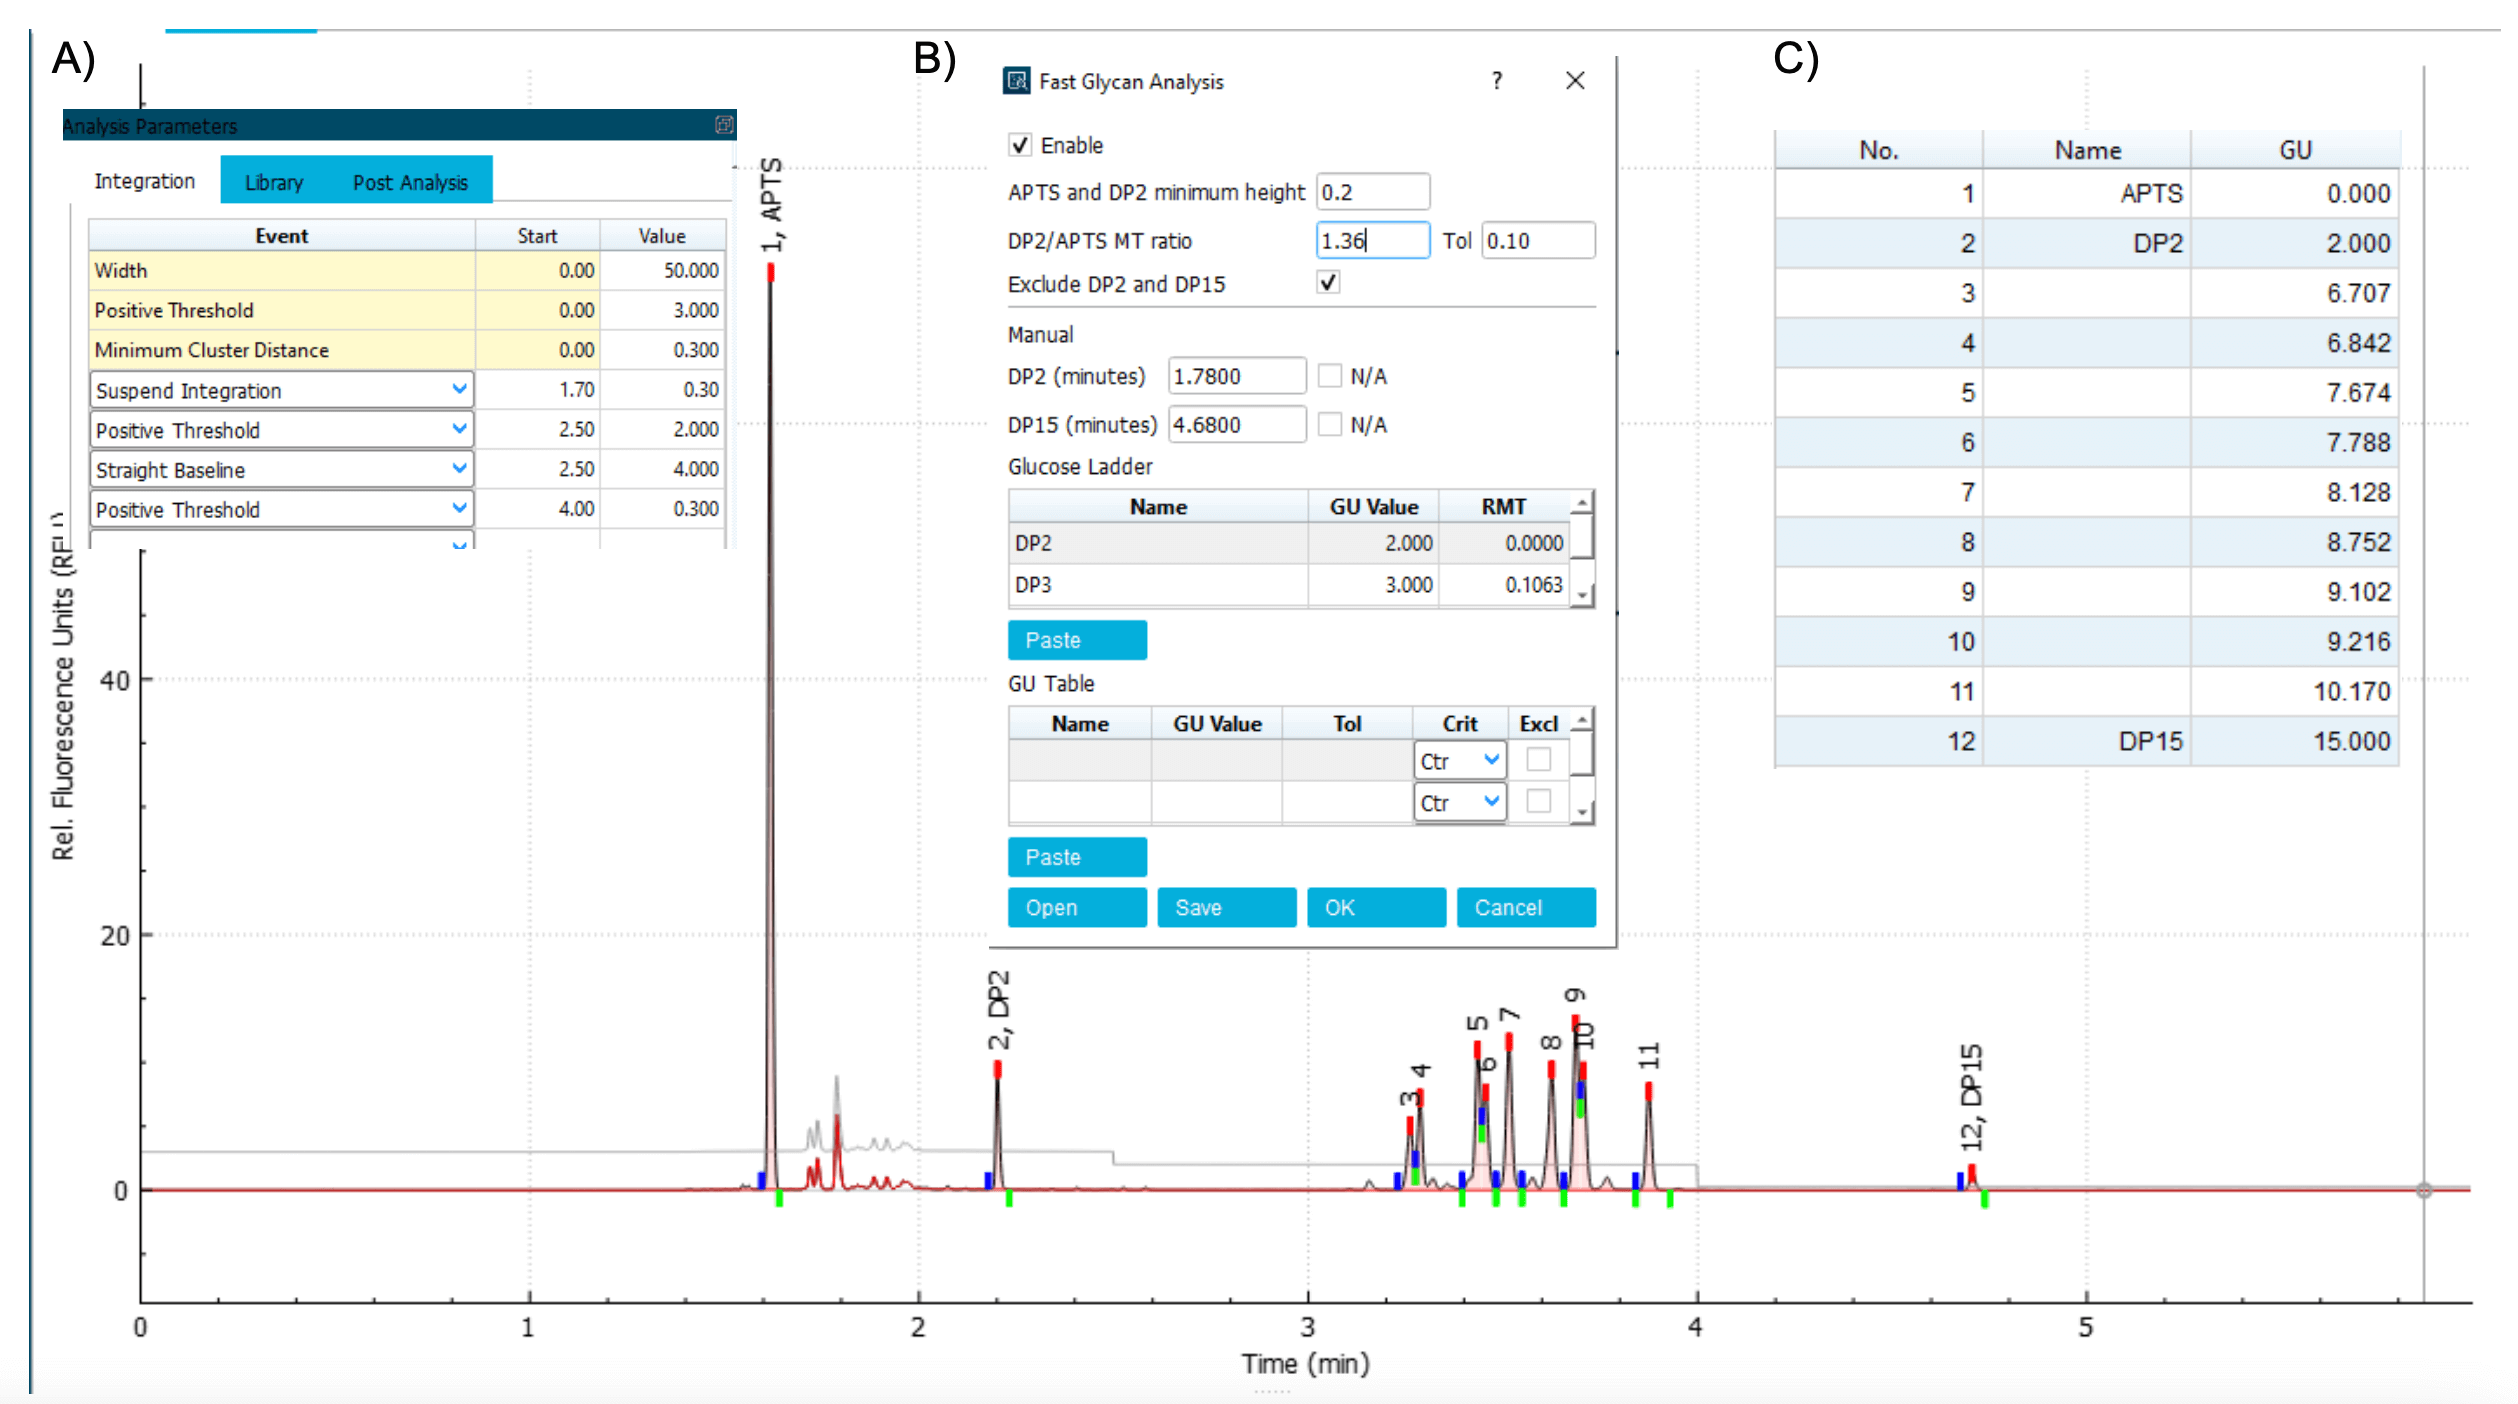
Figure 6. The process to convert the results table from an electropherogram into a preliminary GU table.
Step 5. Use the Save button on the bottom of the page to save the Fast Glycan Analysis method with the standards to the glycan library file for future use (Figure 7).
Step 5. Use the Save button on the bottom of the page to save the Fast Glycan Analysis method with the standards to the glycan library file for future use (Figure 7).
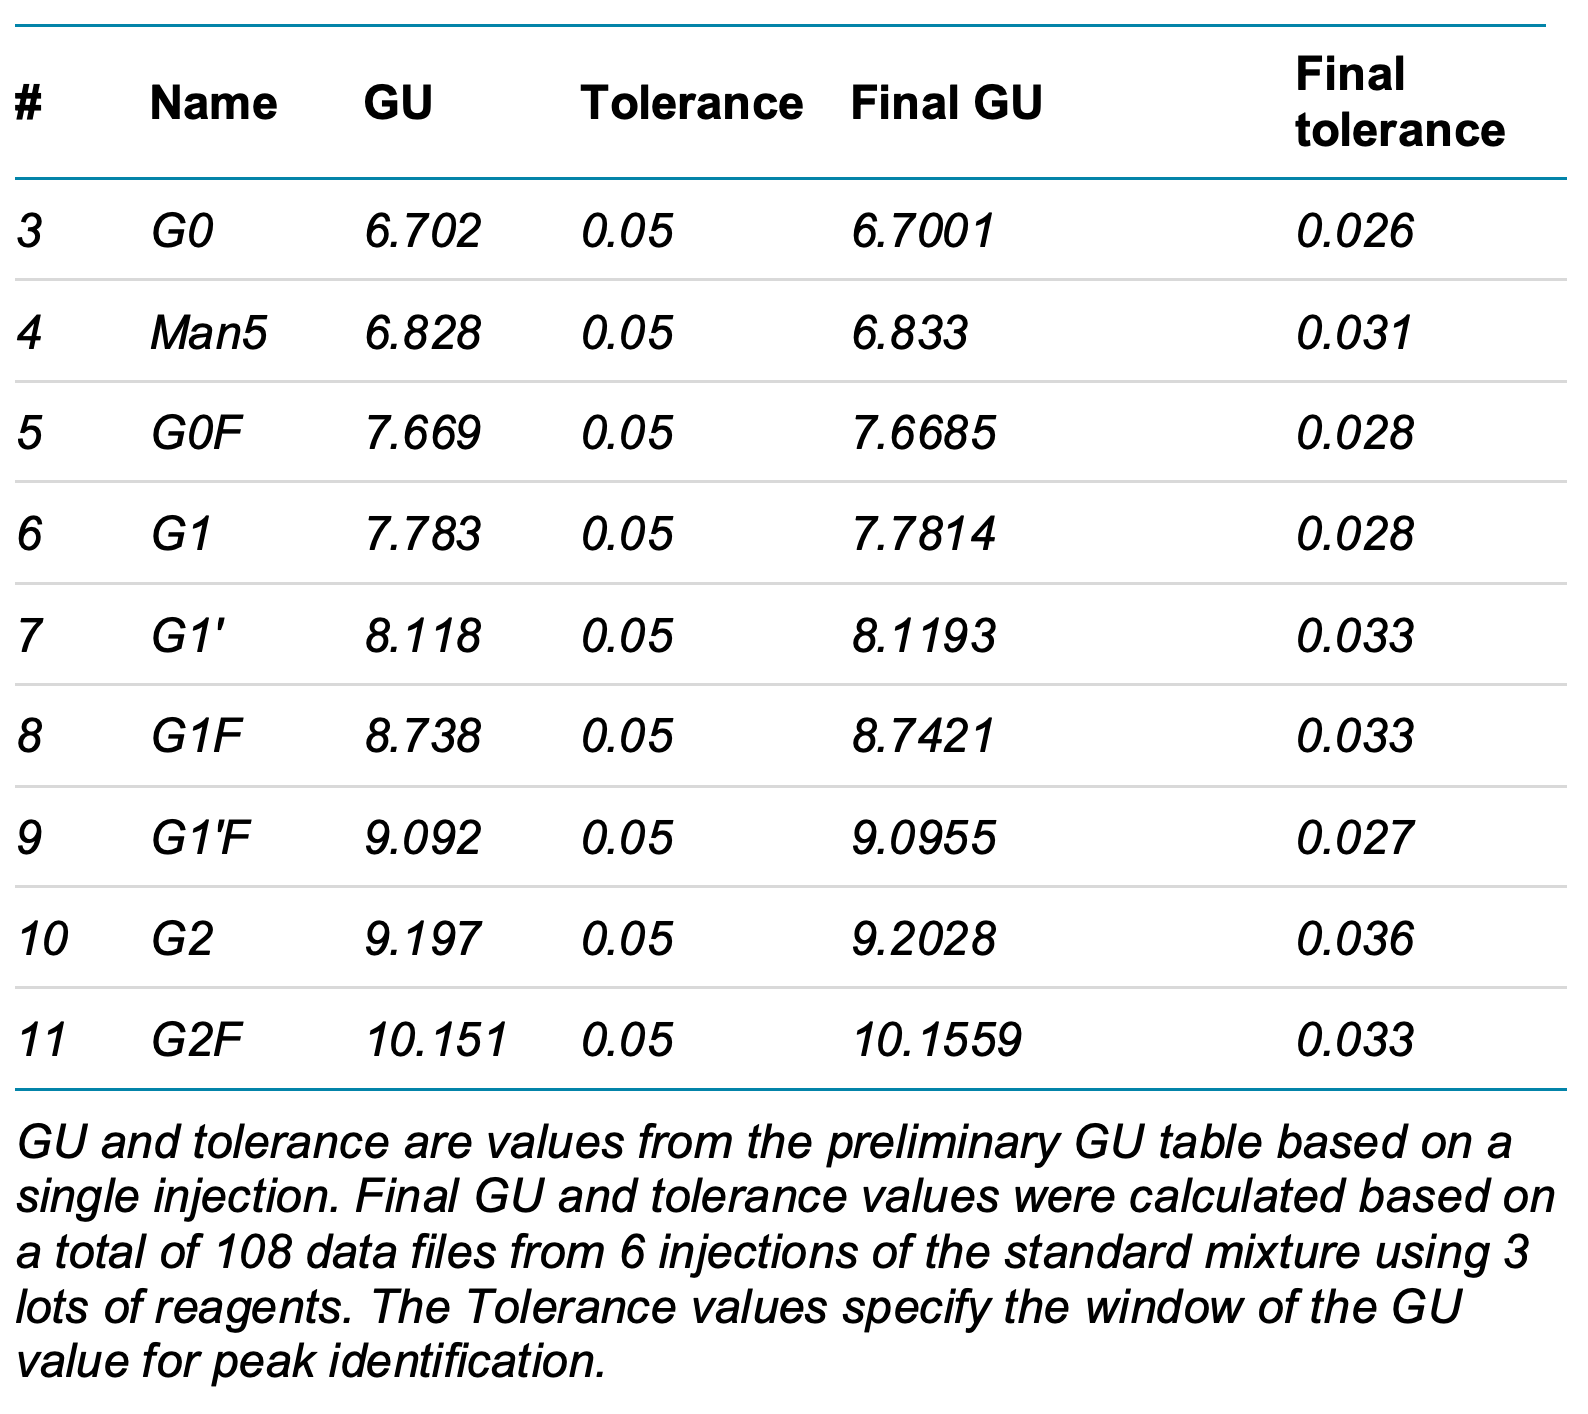
Figure 7. An example of the Fast Glycan Analysis module with an initial GU table and other settings.
Conclusion
- The BioPhase Fast Glycan Labeling and Analysis kit provides all-inclusive sample preparation and high-throughput glycan analysis workflow
- The analysis time is 1 minute per sample with a cycle time of 8 minutes per injection
- The BioPhase 8800 software provides flexibility to add, remove and edit the glycan library to include glycans of interest or recalibrate GU tables
- Improved data processing automation and batch process capability