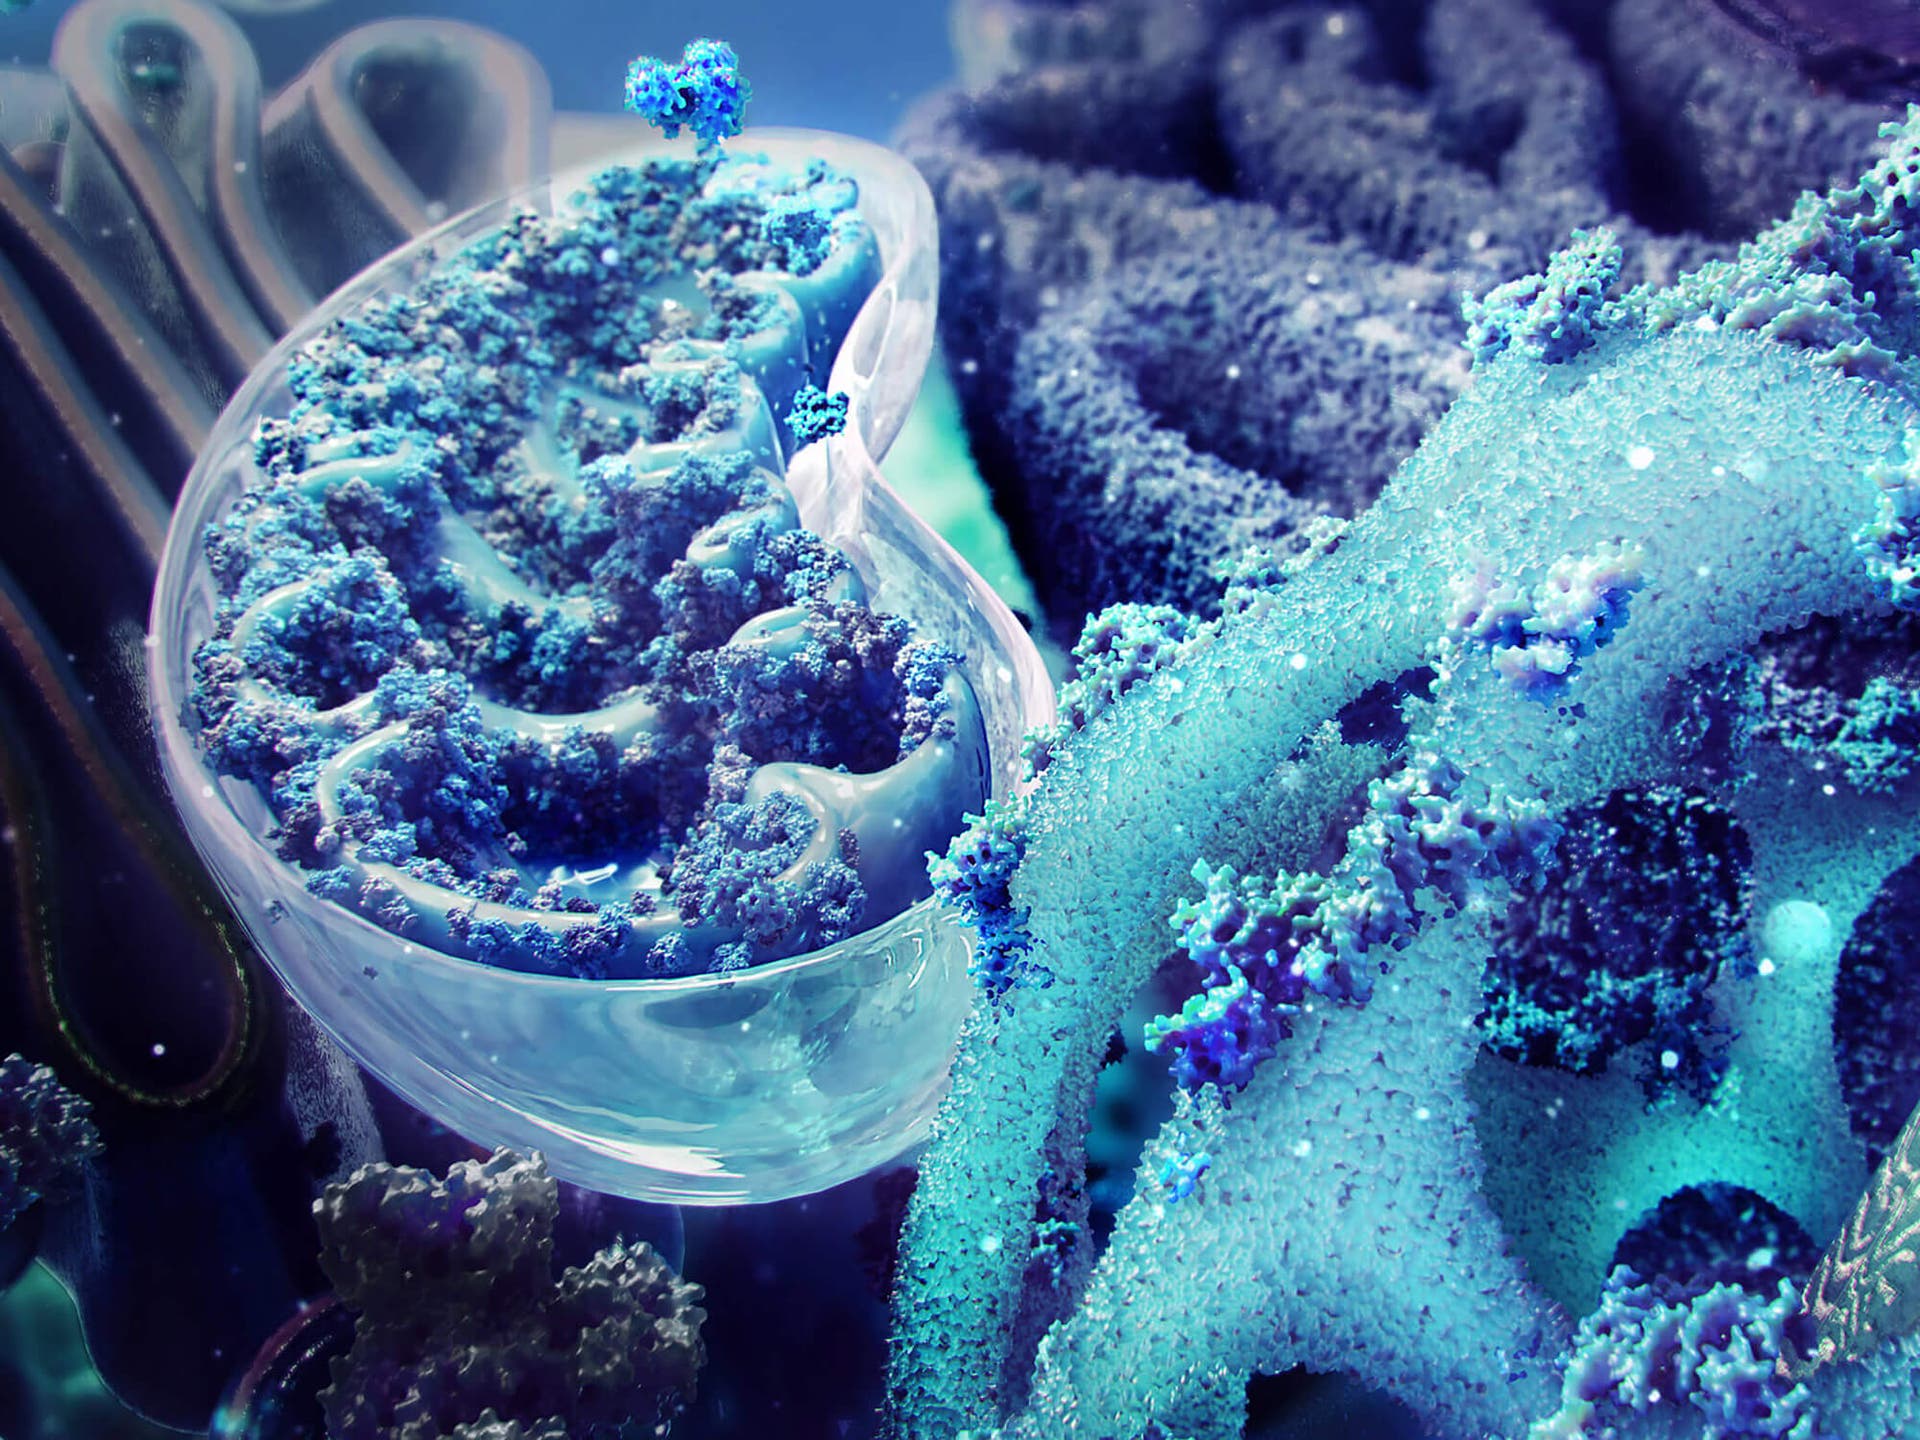
Use the power of cloud-based software at your fingertips to extract and visualize mass spectrometry-generated big data from proteomics, metabolomics and genomics projects on a single platform. Turn that data into biological insights quickly, and share your results widely and easily with collaborators.
“Drive big data to meaningful insights with cloud computing”
Contact SCIEX to request more information or a demo of this software.
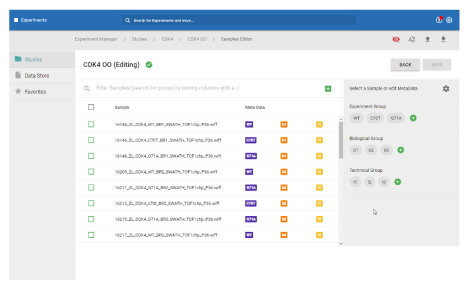
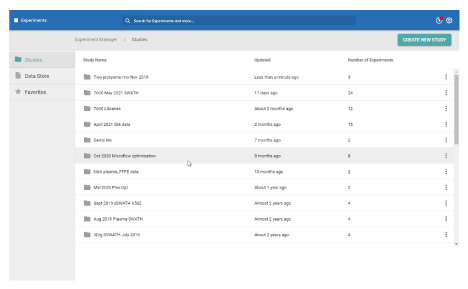
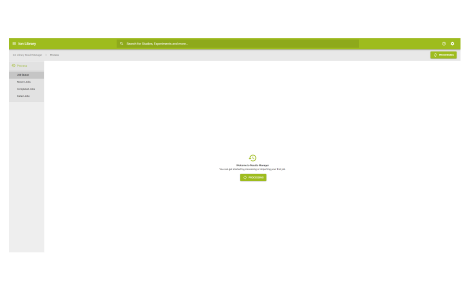
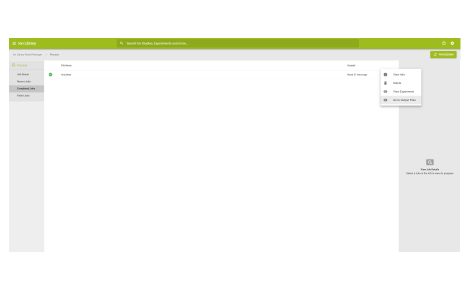
Data Store and Experiments
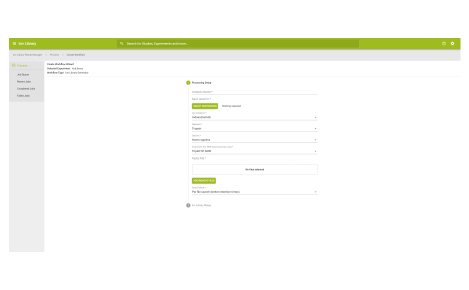
Organize and create
In these workspaces, you can assemble and define the metadata in your study.
- Build experiments from uploaded data
- Share projects, such as data and results
- Assign study-level metadata
- Build experiments and add them to studies
- Proteomics SWATH DIA data
- Metabolomics SWATH DIA data
- RNA expression data
- Protein identification data
- iTRAQ reagent protein expression data
- Templates available for metadata assignments
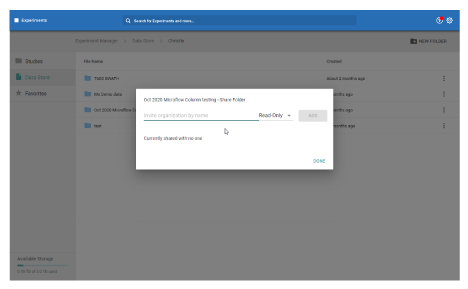
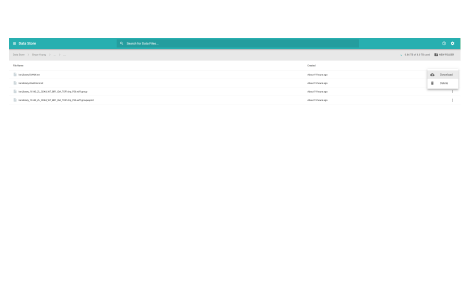
- Access and manage data uploaded to the cloud with SCIEX
- Store your processed results files
- Share files with collaborators
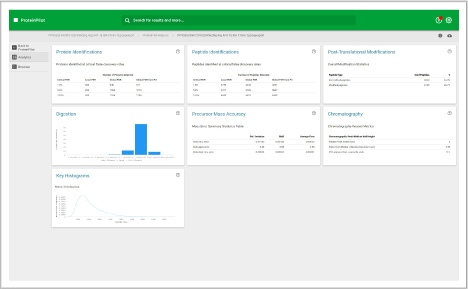
ProteinPilot
Identify and quantify proteins faster
Identify
This workspace enables you to process data dependent acquisition (DDA) data. Database searches can be performed using the Paragon and Pro Group algorithms. Perform protein identification and build out your ion library.
Identify proteins
- Process a "multi-file" search
- Process a "per-file" search
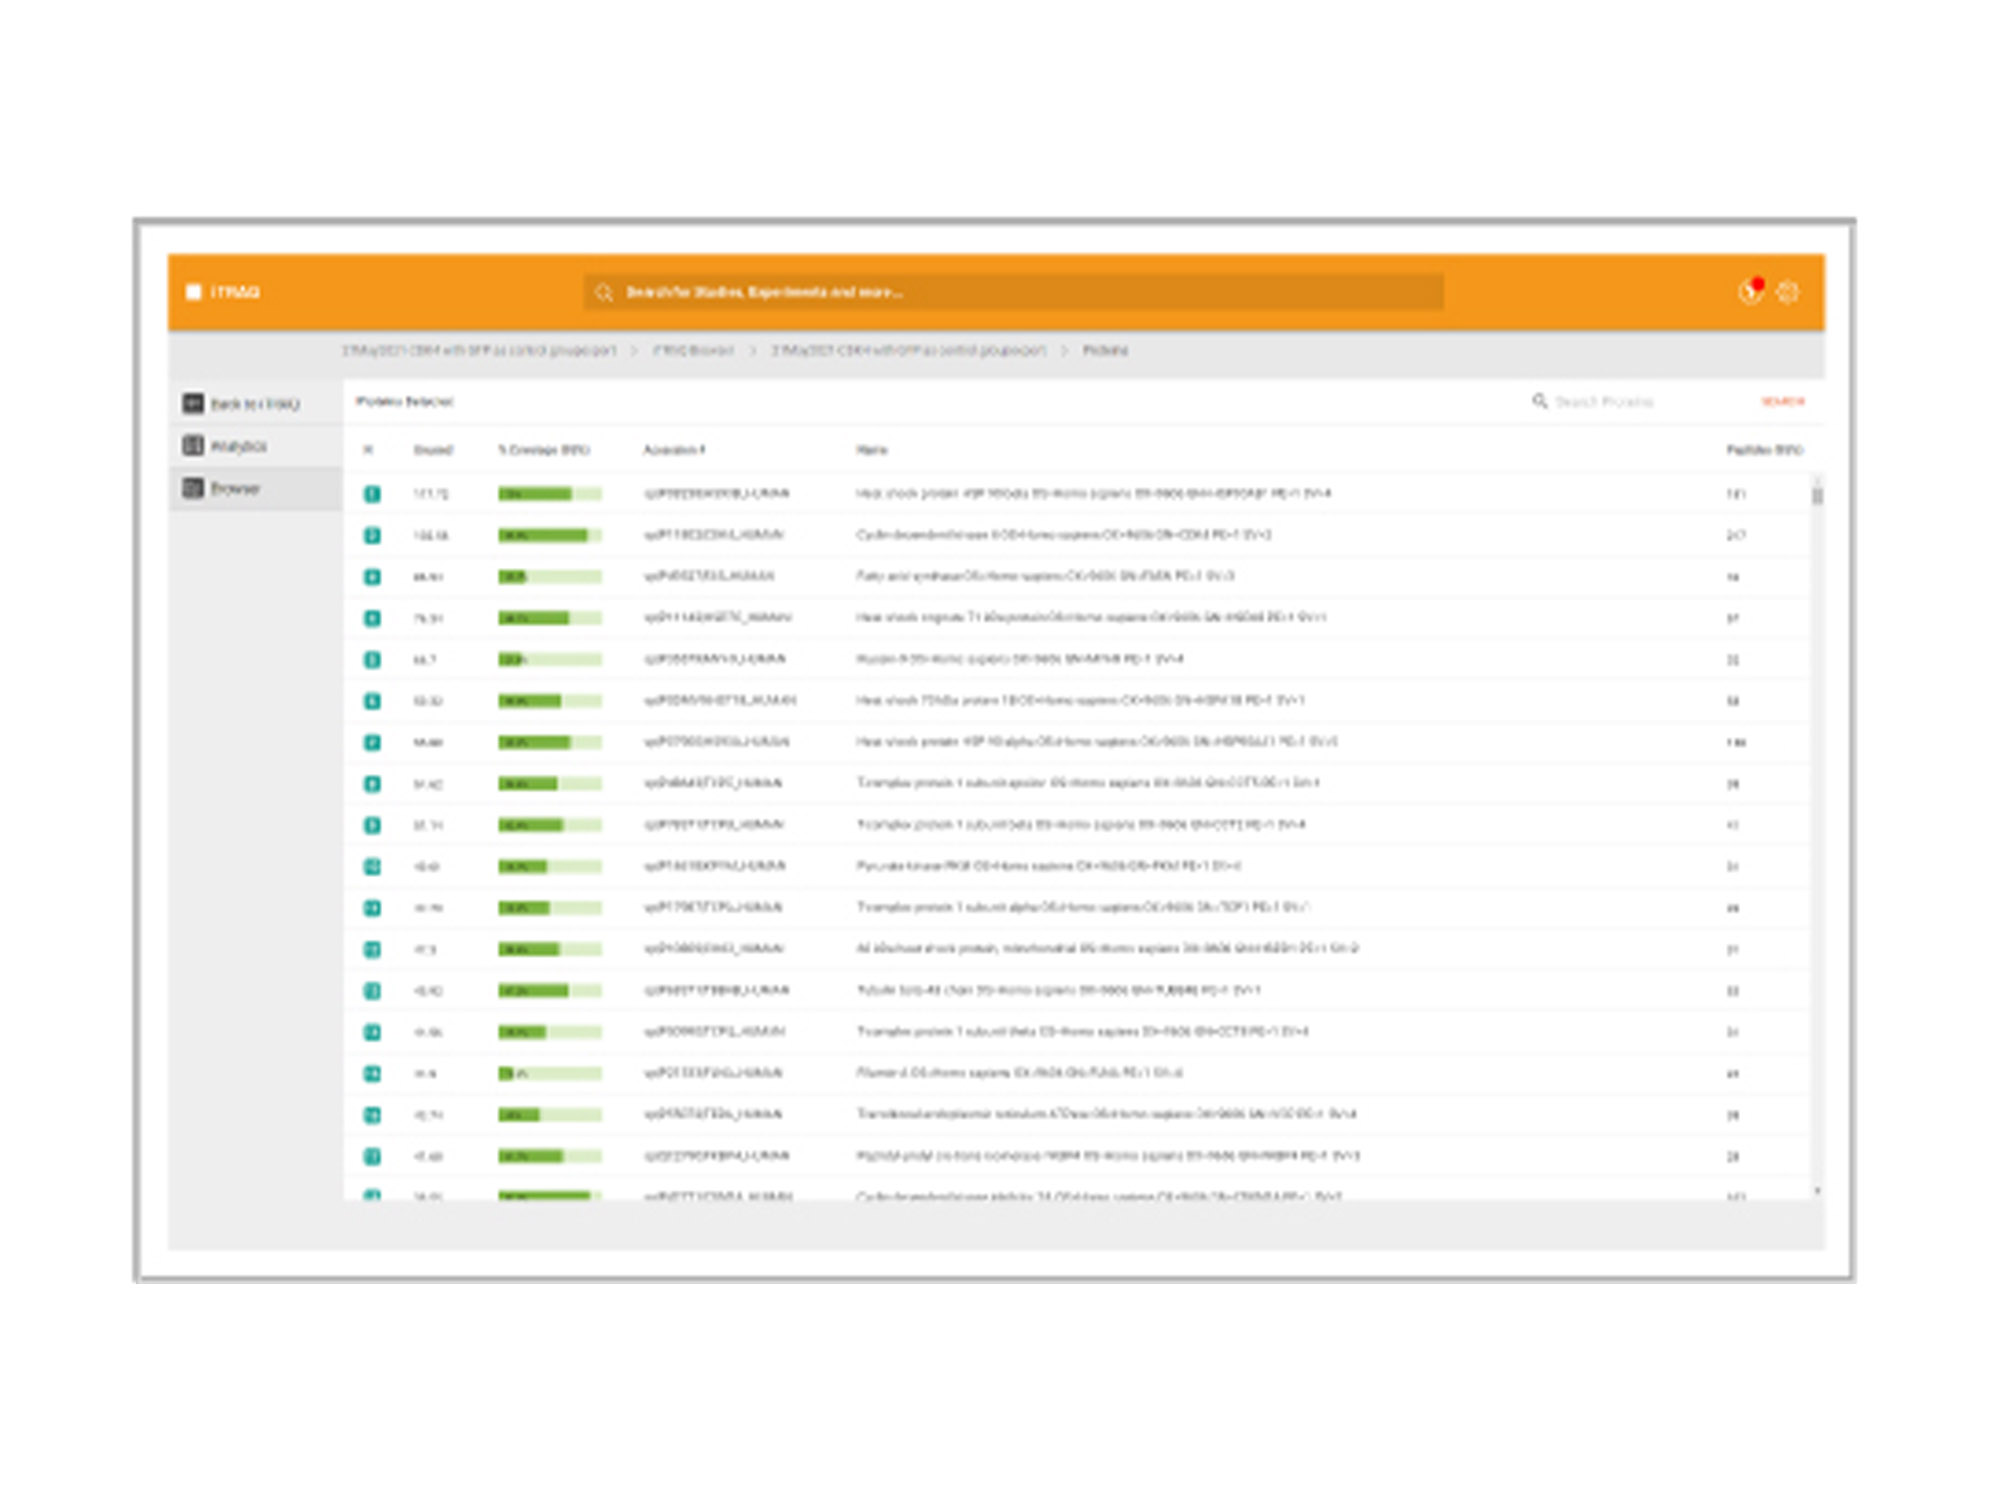
View your results
- View database search result metrics
- View protein identification results
- View MS/MS data with matching ions
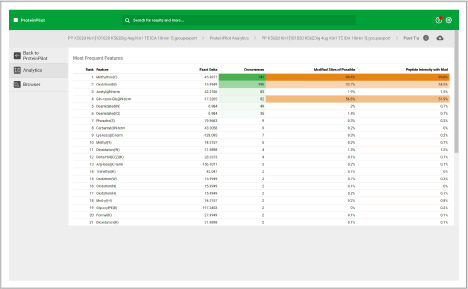
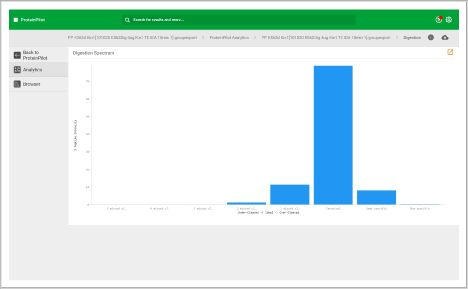
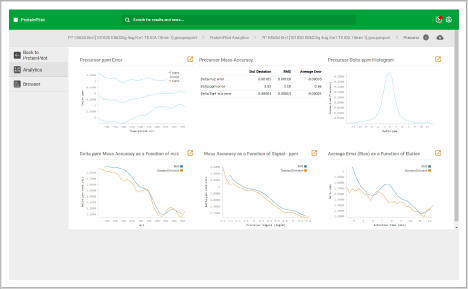
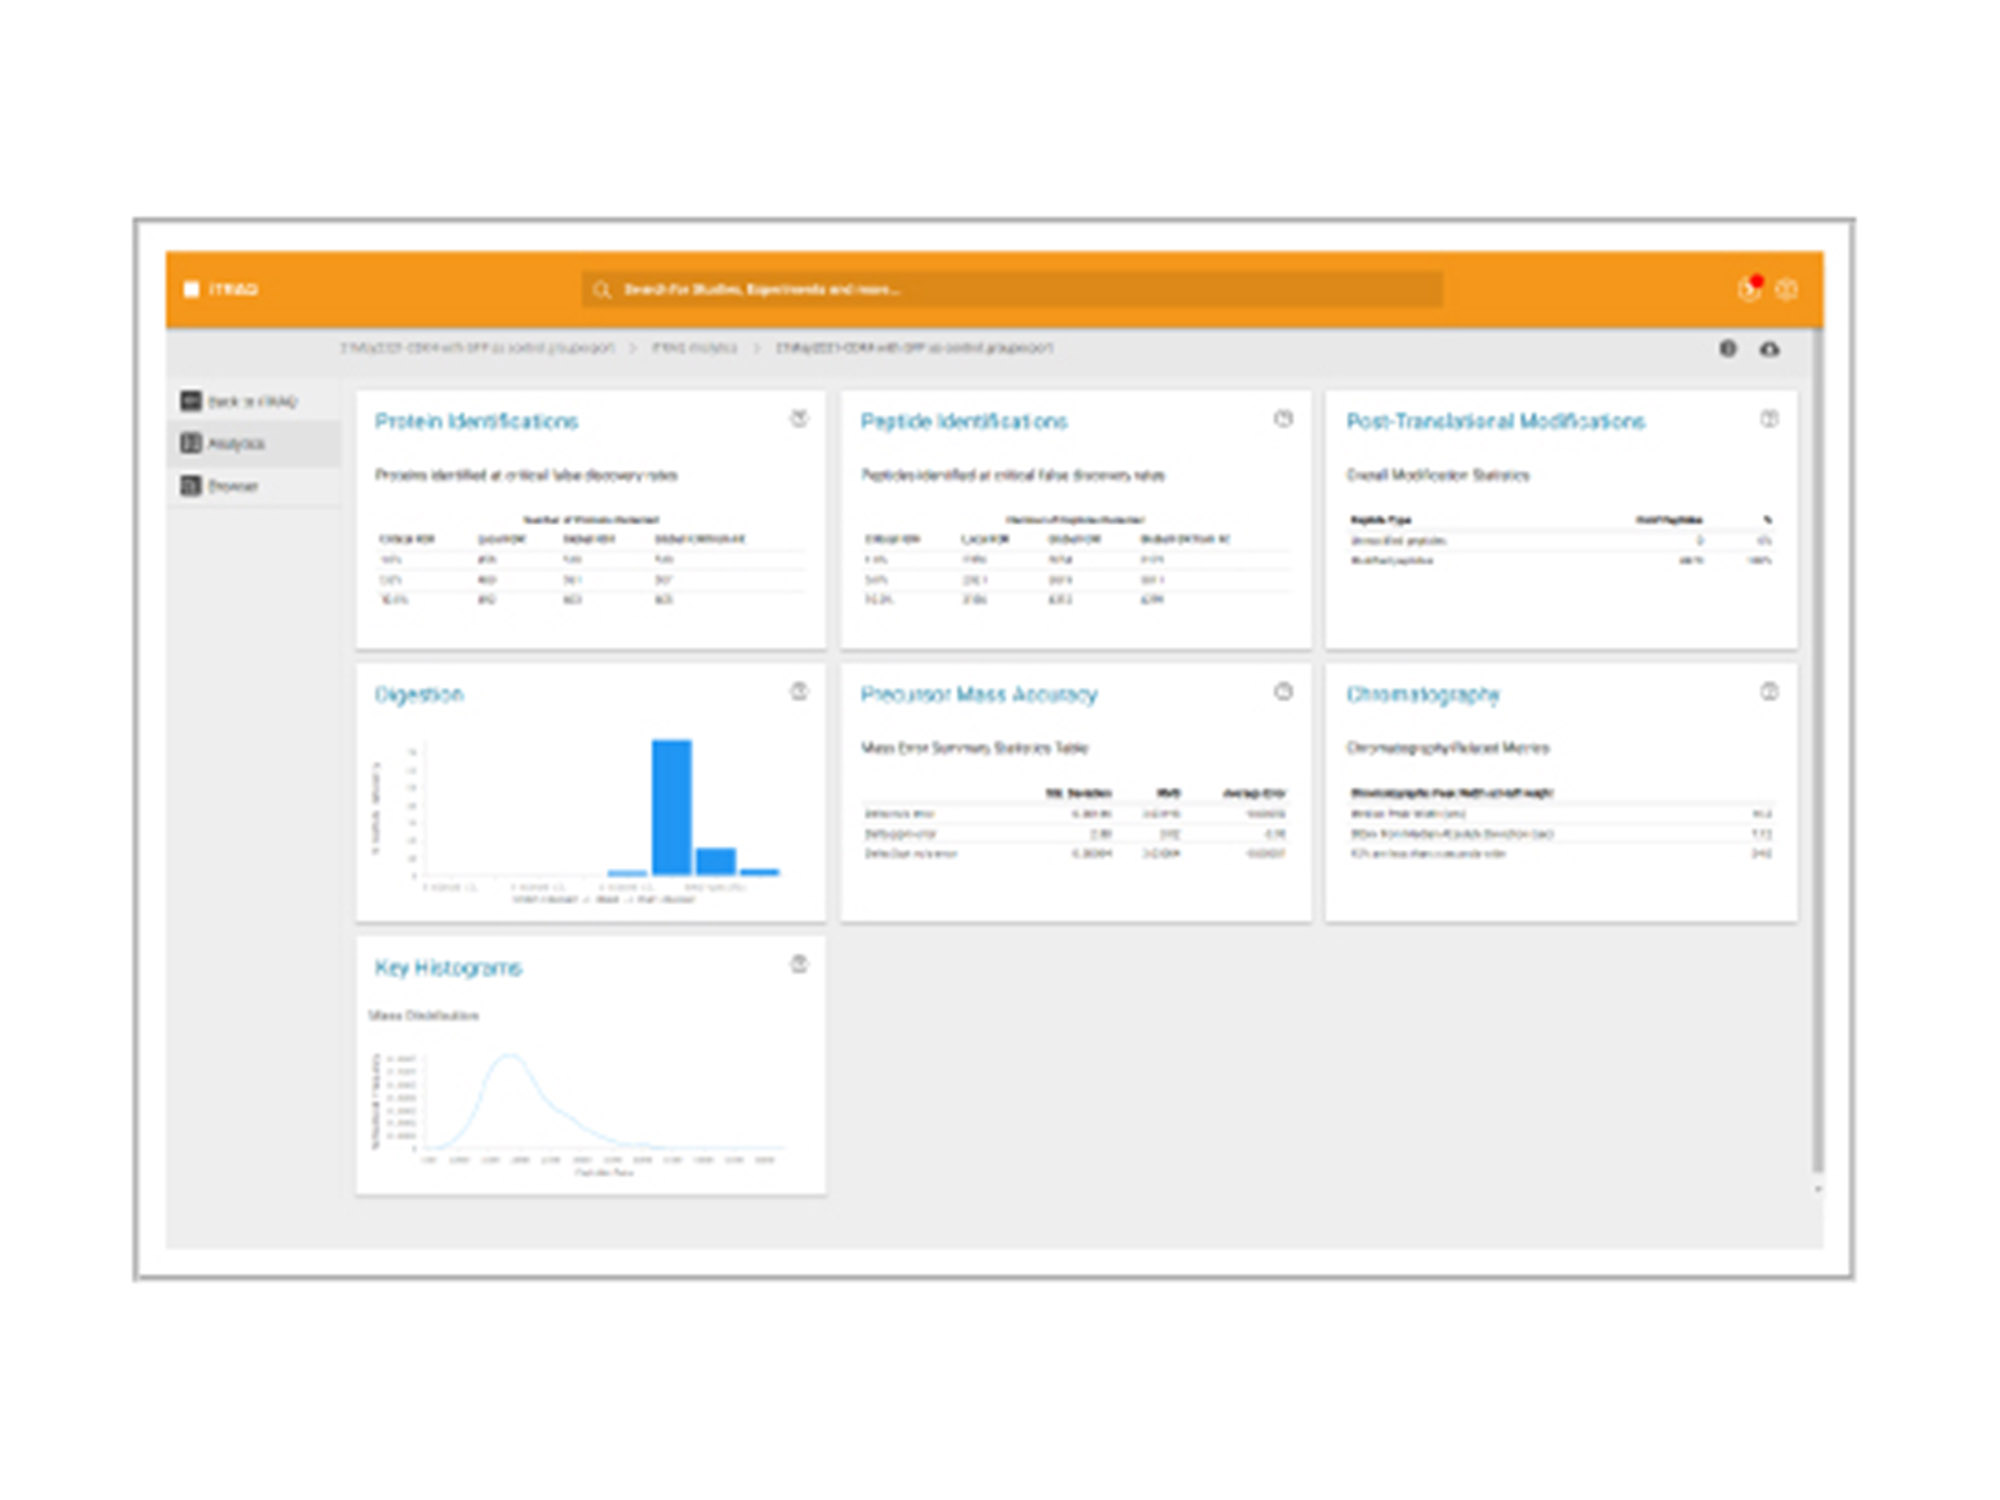
Assess underlying data quality with analytics
- View the number of proteins and peptides identified at critical false discovery rate (FDR) values
- Assess the quality of your chromatography and digestions
- Dive into each panel to discover more detailed information
- View proteins identified and sorted according to their unused protein score
Ion Library
Create spectral ion libraries from DDA
Identify
This workspace enables you to process data dependent acquisition (DDA) data. The protein identifications are leveraged to help you build out your ion library.
- Identify proteins
- Process a "multi-file" search
- Process a "per-file" search
- Navigate to your ion libraries using shortcuts
- Ion libraries are made for use in the Proteomics workspace of OneOmics suite, and they can also be used as is for DIA-NN workflows
Proteomics
Quantified and visualized
This workspace contains several applications to help further your research and the processing of your SWATH acquisition data.
Extractor application functions include:
- Merges and retention time (RT) aligns selected ion libraries
- Performs RT calibration on each SWATH acquisition file
- Extracts and integrates the fragment ion extracted ion chromatogram (XIC) area using the final ion library
- Peptide peak group scoring for false discovery rate (FDR) analysis
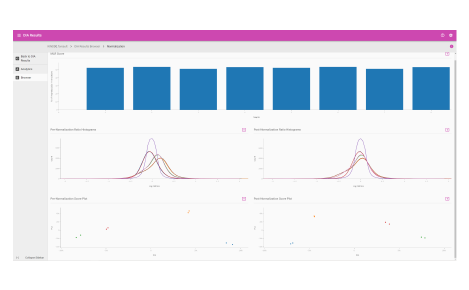
Assembler application functions include:
- Normalization which adjusts the peak area tables to be on the same scale for all experiments
- Fold change analysis to determine direction, extent and confidence of peptide and protein fold changes
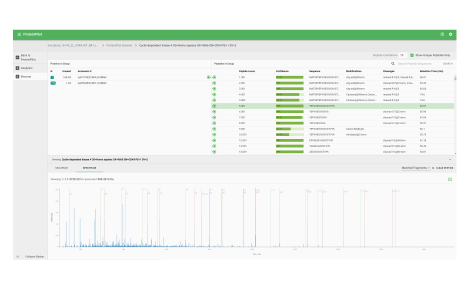
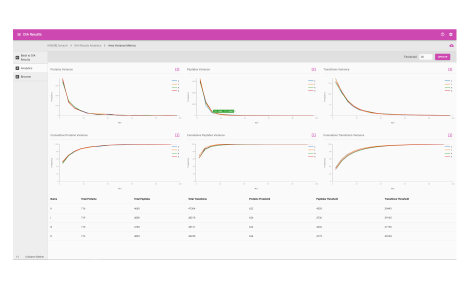
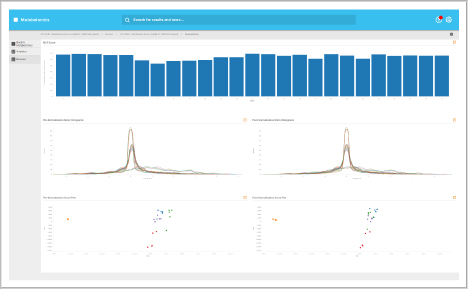
Analytics dashboard
Visualize your mass spectrometry proteomics data quality.
- Reproducibility
- FDR analysis
- Retention time calibration
- Dynamic range
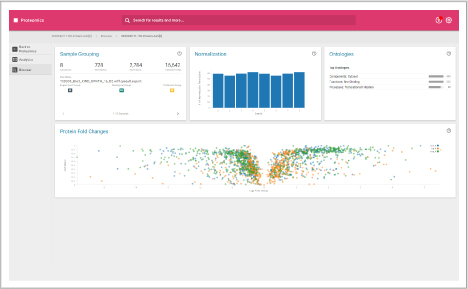
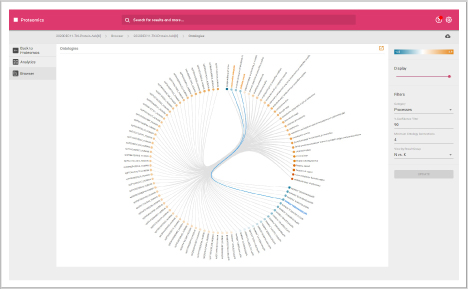
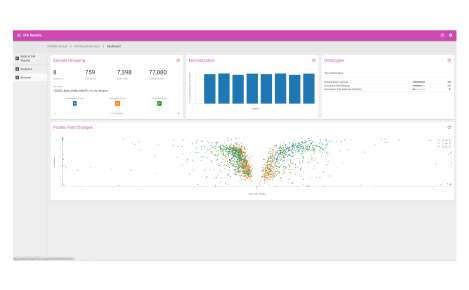
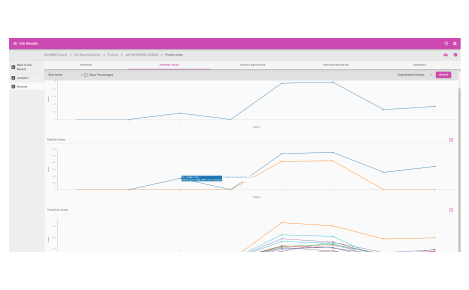
Browser dashboard
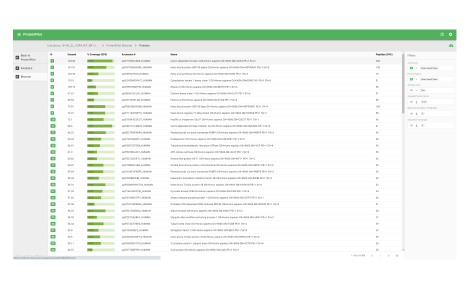
Visualize protein expression results in a clear and concise format.
- Sample grouping
- Normalization quality
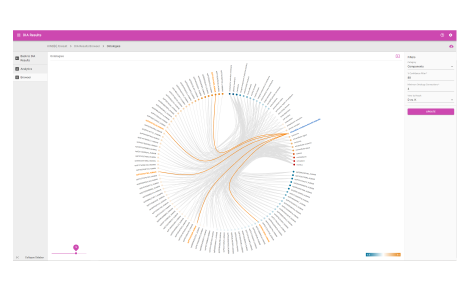
- Ontologies
- Protein fold changes
- Box and whisker plots
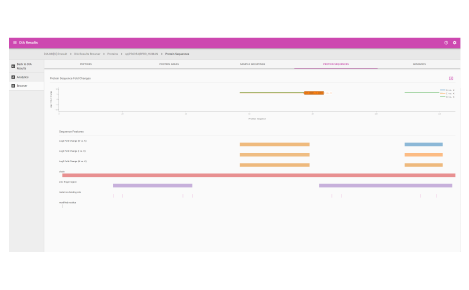
- Peptide fold change across protein sequences
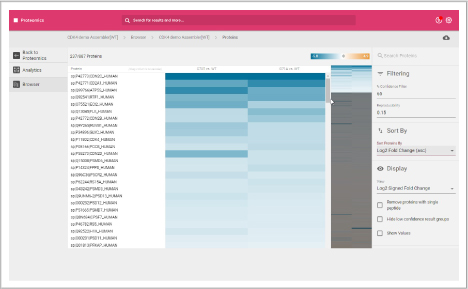
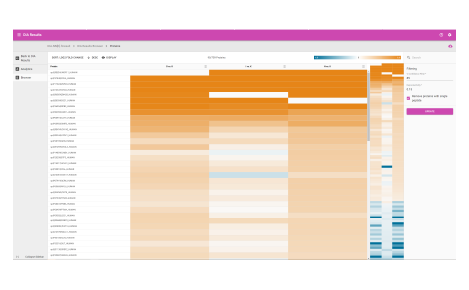
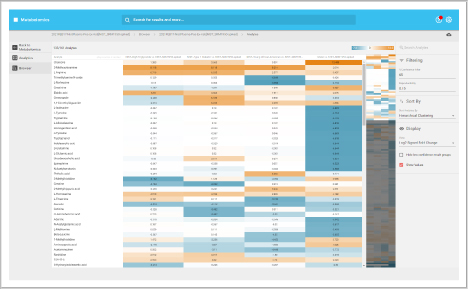
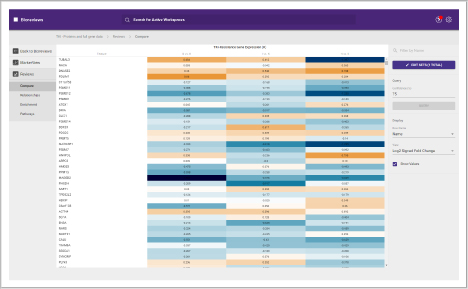
Protein heat map
The protein heat map functionality delivers an overview of the protein expression results. This user-friendly format allows the operator to adjust filters to refine the heat map. With the vast data capture you can drill into a single protein to see changes across samples throughout the sequence.
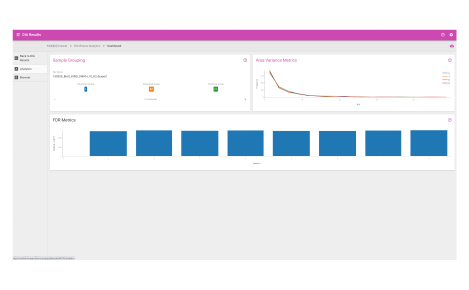
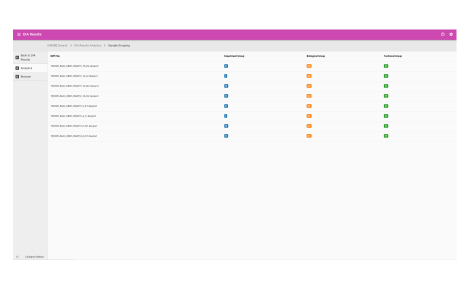
DIA Results
Quantified and visualized
Quantify
This workspace contains several applications to help further your research and the processing of your SWATH DIA data. The powerful visuals for SWATH offered in the Proteomics workspace are now available for DIA-NN results.
Transform application
- Translates a DIA-NN multi-sample main result to a sample-specific result that is compatible with OneOmics suite
Assembler application
- Normalization that adjusts the peak area tables to be on the same scale for all experiments
- Fold change analysis to determine the direction and extent of peptide and protein fold changes with confidence
Metabolomics
Quantified and visualized
In this workspace, you can extract key metabolite areas from your acquired data and then normalize and compute fold changes (FCs) and confidences. You can also assess the MS data quality and visualize changes across a study.
Within this workspace the Extractor extracts and integrates compound peaks using NIST20 and the Accurate Mass Metabolite Spectral Library (AMMSL).
Another feature is the Assembler functionality, which adjusts the peak area tables to be on the scale for all experiments.
Fold change (FC) analysis is also supported in this workspace to determine the direction, extent and confidence of metabolite FC.
Analytics dashboard
Visualize your mass spectrometry metabolomics data quality.
- Reproducibility
- FDR analysis
- Dynamic range
Browser dashboard
Visualize metabolite expression results in a clear and concise format.
- Sample grouping
- Normalization quality
- Ontologies
- Metabolite fold changes
- Box and whisker plot
- Metabolite and transition peak areas across samples
Metabolite changes heat map
The metabolite heat map delivers an overview of the metabolite changes within your study allowing you to adjust filters to refine the plot. The comprehensive data captured and processing allows you to drill into single analytes to see changes across samples throughout the sequence.
iTRAQ
Labeled quantification
This workspace enables you to interrogate quantitative data obtained from samples labeled with the multiplexed, amine-specific, stable isotope iTRAQ reagent kits:
- Identify proteins and process either a “per-file” or a “multi-file” search
- Quantify using iTRAQ reagents
- Bias correction
- Normalization
- Background correction
- Build a workspace
- View database search result metrics
- View protein identification results
- View MS/MS data with matching ions
- Download group files and view in the ProteinPilot workspace
BioReviews
Integrate multi-omics studies
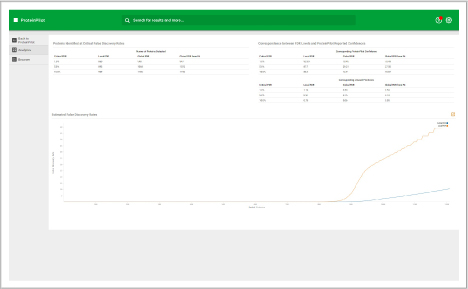
Compare and assess different omics studies. Within BioReviews you can compare quantitative data between genomics, proteomics and metabolomics experiments.
It includes functionality for aligning genomics and proteomics results, or comparing multiple proteomics or multiple metabolomics data sets.
- Combine studies to align your big data
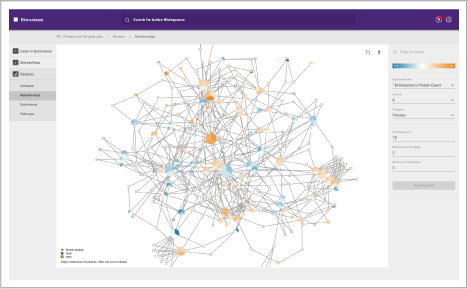
- Perform cluster analysis and trend analysis to find key similarities and differences in protein, metabolite or RNA quantitative data
- Determine the biological significance of your similarities and differences
- View enriched biological pathways
Another feature in this workspace is support for manual conflict resolution when a protein maps to multiple genes or a single gene maps to multiple proteins.
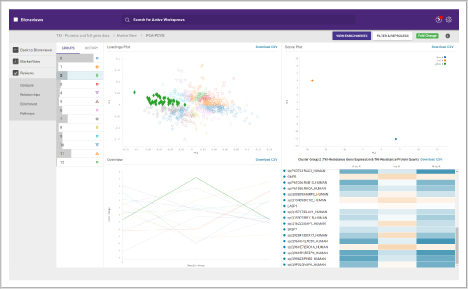
You can also perform multiple analyses on experiment sets, which are each shown as a tile, and view the settings used and links to the results:
- Intersection: shows overlap between every PCA-PCVG and K-means group
- K-means: shows the clusters found
- PCA-PCVG: shows the trends found
- PCA-DA PCA: considering known sample grouping
- T-test: displays a plot of log2 fold change versus the confidence or -log10(p-value), for every contrast
- Area and fold change analysis

Cloud-based mass spectrometry
Fast, secure and shareable
The advancements in cloud-based software are enabling researchers to interrogate big data faster than ever before. The cloud computing integrated into the OneOmics suite can distill multi-omics data from transcriptomics and mass spectrometry data all in one place
Analyze faster
Avoid queues and backlogs of samples waiting to be processed, and get secure, precise information at revolutionary speeds.
- Up to 10x faster than desktop processing
- Process many analyses all at once without losses in performance
- User-friendly app environment for large-scale data processing
- Integrated tools to create workflows within a single environment

Securely store and manage
Process your data with confidence and assured of the highest security protocols. Manage your studies with ease and organize your results to reflect your lab's configuration.
- Amazon Web Services (AWS) security standards, multi-site synchronous storage
- Securely send data from the instrument to the cloud environment
- Reduces the need for on-site storage and computing power
Share and collaborate
Partnerships can flourish synchronously through OneOmics suite, as its power and fidelity makes communicating and processing data on shared timelines easy. Any party involved can simply log in and get started.
- Easily share projects (data and results)
- No more FTP sites or shipping hard drives
- Access data and results, from anywhere and at anytime
One cloud. Countless opportunities.
Productivity gains
Process more samples and get more results! Our cloud-based mass spectrometry data processing can significantly expand your lab’s productivity by running high volumes of data analysis at the same time.
Powerful visuals
Visualize your data in different ways by exploring all omics approaches simultaneously, giving your research and your funding proposals an edge.
Scalability
With OneOmics suite, you can process data of any size, at any time and from any place, without the need to own the infrastructure. By working in the cloud, your projects won't be limited.
Speed
Cloud-based processing can run and distill data from multiple sources all at once. Avoid queues and backlogs of samples waiting to be processed, and get secure, precise information at revolutionary speeds.
Quick installation
Cloud-based software is installed with ease. Expect no additional time or financial requirements and no trouble with data processing and storage. Look forward to simple monthly payments followed by remote updates
OneOmics suite subscriptions
Choose a subscription that best suits your lab's analysis and research.
Proteomics
Base subscription for proteomics applications:
- IDA data processing using ProteinPilot app for protein identification and ion library creation
- SWATH acquisition data processing for relative quantification
- Results visualization: fold change heat maps, volcano plots, gene ontology plots, etc.
- Pathway analysis using the UniProt knowledge base and reactome.org pathway database
- Tools for transforming, assembling and visualizing your DIA-NN reports
Includes:
- Data store account with 4 TB space for data and results
- Approximately 1,000 samples at 4 GB each
- Tools for transforming, assembling and visualizing your DIA-NN reports
- Processing time allocation for approximately 1,000 samples
- Technical support via phone, email and website
Buy now
Metabolomics
Base subscription for metabolomics applications:
- NIST20 and Accurate Mass Metabolite Spectral Library (AMMSL) SWATH acquisition data processing for relative quantification
- SWATH acquisition data processing for relative quantification
- Results visualization: fold change heat maps, volcano plots, etc.
- Pathway analysis using the Human Metabolome Database (HMDB) and reactome.org pathway database
Includes:
- Data store account with 3 TB space for data and results
- Approximately 3,000 samples at 1 GB each
- Processing time allocation for approximately 3,000 samples
- Technical support via phone, email and website
Buy now
Multi-omics
Base subscription for multi-omics applications:
- IDA data processing using ProteinPilot app for protein identification and ion library creation
- NIST20 and Accurate Mass Metabolite Spectral Library (AMMSL) for metabolomics
- SWATH acquisition data processing for relative quantification
- Results visualization: fold change, volcano plots, and many more plots
- Pathway analysis using the UniProt knowledge base, HMDB and reactome.org pathway database
- Tools for transforming, assembling and visualizing your DIA-NN reports
Includes:
- Data store account with 6 TB space for data and results:
- Approximately 1,000 proteomics samples at 4 GB each plus
- Approximately 2,000 metabolomics samples at 1 GB each (or equivalent combination)
- Processing time allocation for approximately 1,000 proteomics samples and 2,000 metabolomics samples (or an equivalent combination)
- Technical support via phone, email and website
Buy now
Compatibility
The SCIEX portfolio of QTOF systems delivers unmatched speed, robustness and accuracy for the assays you need to run today and tomorrow.
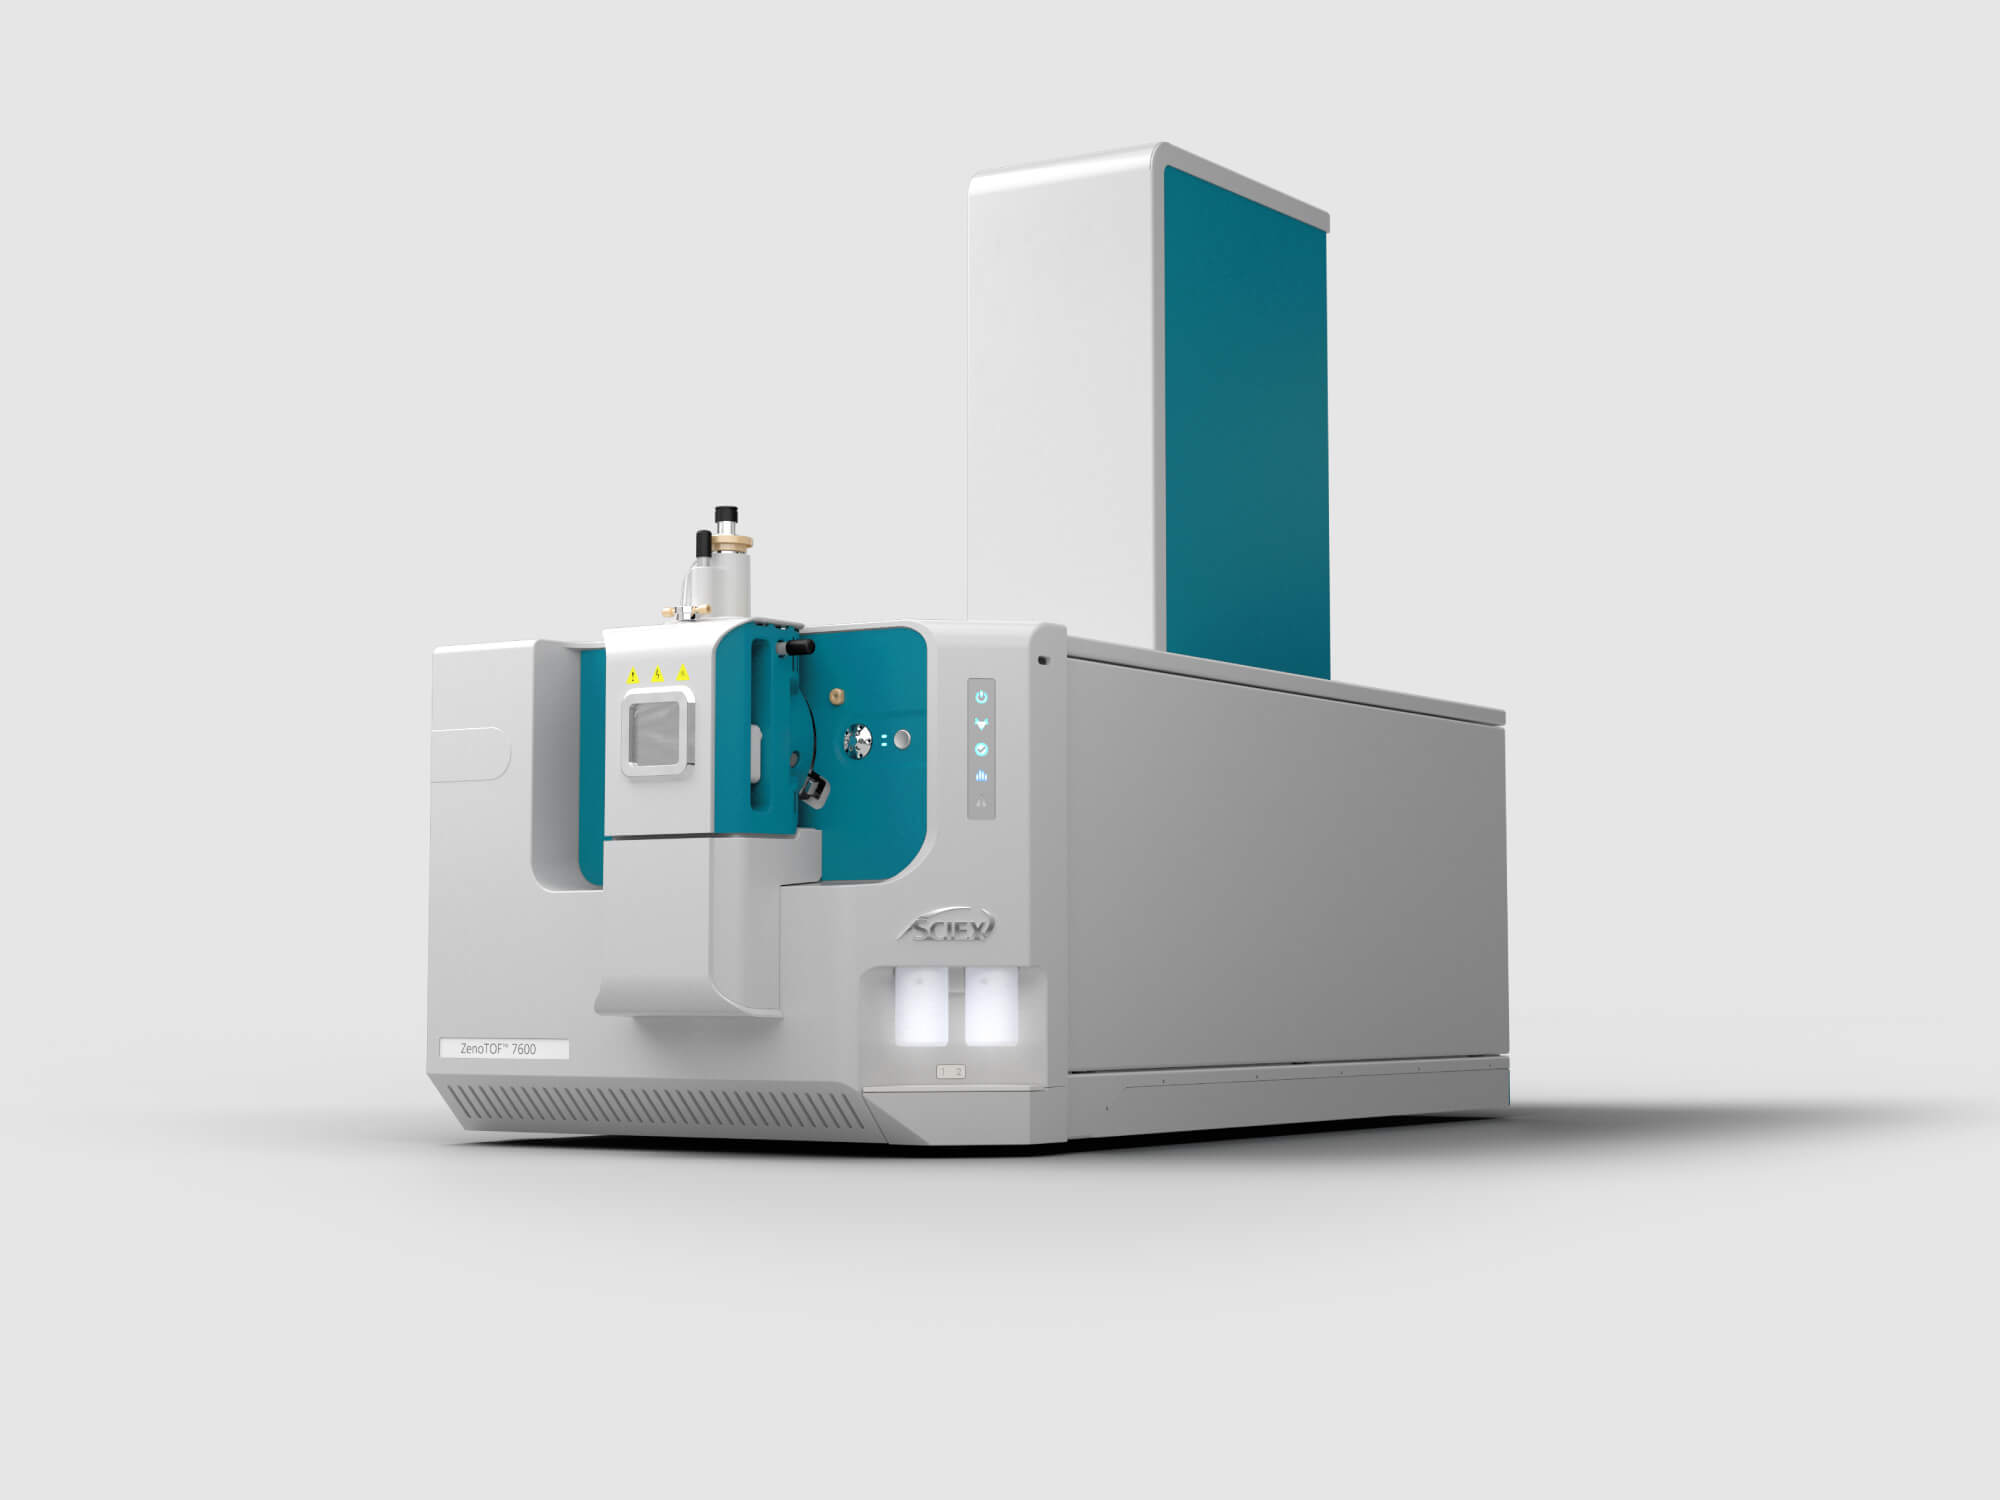
ZenoTOF 7600 system
This accurate mass spectrometer gives richer, more comprehensive data with powerful innovations for Omics research. EAD fragmentation and Zeno trap technology pave the way to obtain sensitive and informative MS/MS data.
Learn more
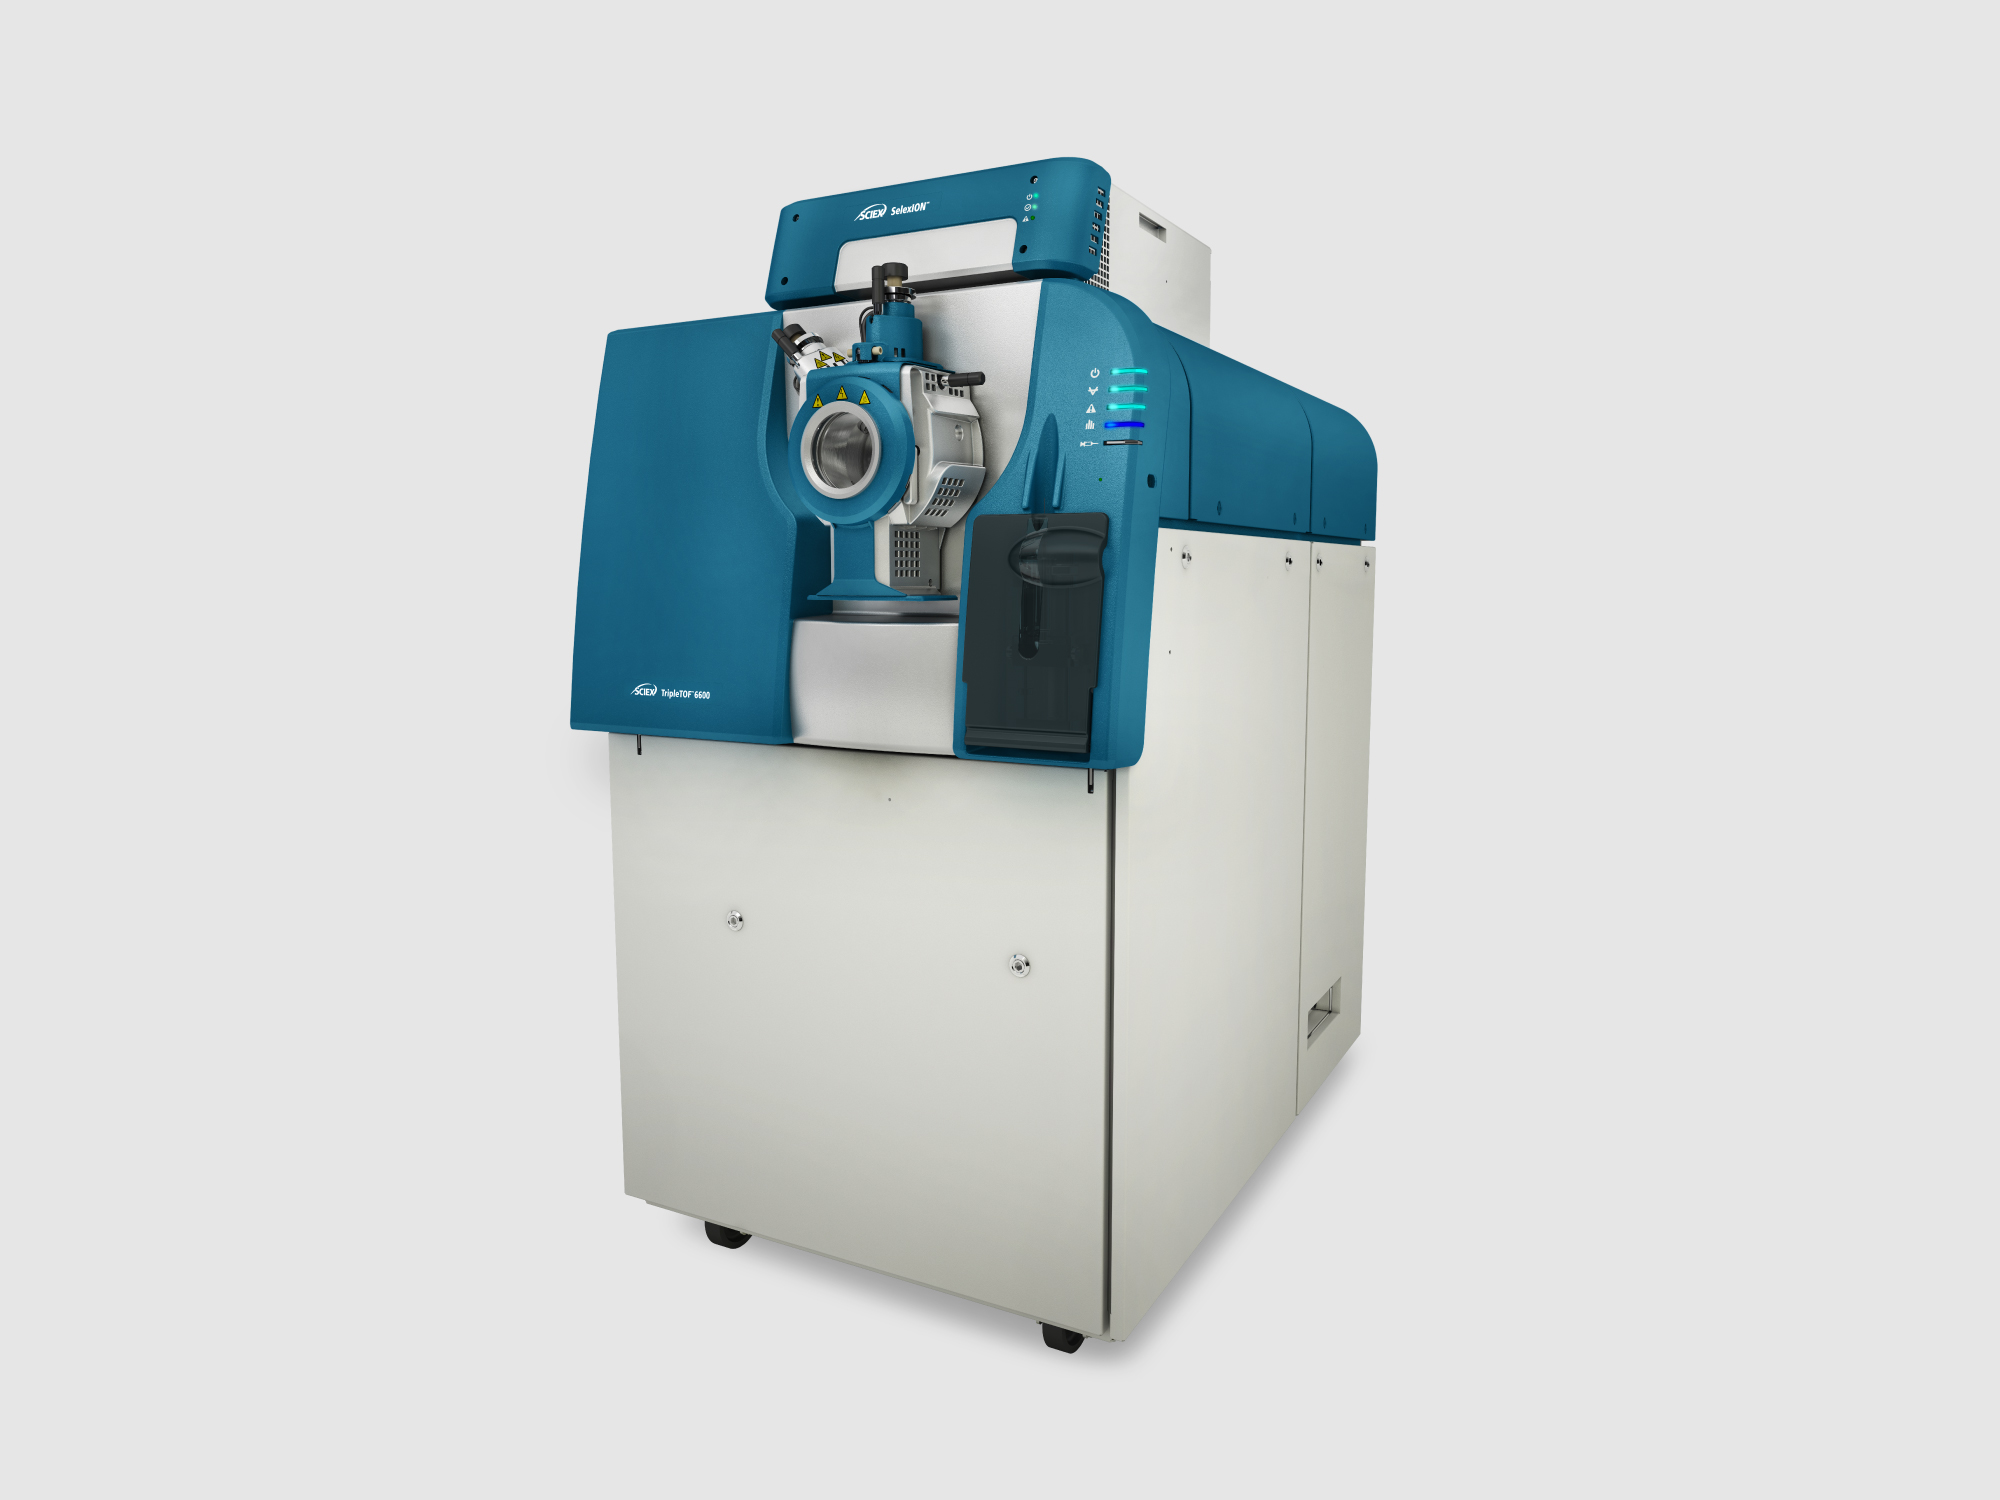
TripleTOF 6600+ system
This high-performance accurate mass spec solution offers a combination of qualitative and quantitative analysis and advanced workflow capabilities. Optimized for large-scale quantitative mass spectrometry, the TripleTOF 6600+ system offers sensitive and robust performance
Learn more
Application notes and useful information
-
Technical note
Integrating DIA-NN processing of Zeno SWATH DIA Data data into cloud processing pipeline
Using the Ion Library and DIA Results apps in the OneOmics suite
-
Technical note
Spectral library generation for SWATH acquisition in less than 20 hours
Using the OneOmics suite and the TripleTOF 6600+ system
-
Technical note
Rapidly advance quantitative proteomics with a high-throughput SWATH acquisition solution
Microflow LC with OptiFlow Turbo V source on the TripleTOF 6600+ system and cloud processing
-
Technical note
Multi-omics analysis of human embryonic stem cell neural differentiation
Processing SWATH acquisition data in the cloud with the OneOmics suite
-
Technical note
Rapid analysis and interpretation of metabolomics SWATH acquisition data using a cloud-based processing pipeline
Using the OneOmics suite with the SCIEX ZenoTOF 7600 system
-
Technical note
Over 40% more proteins identified using Zeno MS/MS
Using the ZenoTOF 7600 system, with the OptiFlow ion source and OneOmics suite in the cloud
SCIEX community
Join the discussion
Take the time to create a SCIEX account and join the various communities that are available. These communities are a platform for interacting with your peers around the globe to share and exchange ideas and expand your research. You can also stay up to date on new innovations in software, mass spectrometry, capillary electrophoresis and other SCIEX products
OneOmics community
Ask questions, get useful hints and tips, and view how-to-videos that will boost your research.
Join now
Proteomics community
Join in and add insight to the questions and topics around proteomics
Join now
Metabolomics community
Discover what the latest discussions happening in the world of metabolomics analysis
Join now