Unleashing the power of speed: Accelerating time to answer with CE-SDS and Laser-Induced Fluorescence detection in under 12 minutes
Abstract
This technical note demonstrates a strategy to accelerate capillary sodium dodecyl sulfate (CE-SDS) separation methods by using optimized instrument settings to reduce analysis time while maintaining the robustness and resolution of CE-SDS. The applicability of this approach extends to the analysis of monoclonal antibodies (mAb) and next-generation biotherapeutic molecules, making it ideal for high-throughput screening.
Upstream bioprocessing is a fast-paced environment where thousands of samples are screened yearly, and in bioprocessing, the demand for sample analysis throughput is high. To meet the throughput requirement and achieve a fast time to answer, well-established analytical technologies, such as conventional CE-SDS or SDS-PAGE, may face challenges due to their traditionally low throughput nature.1,2
Key features of the ultra fast CE-SDS workflow
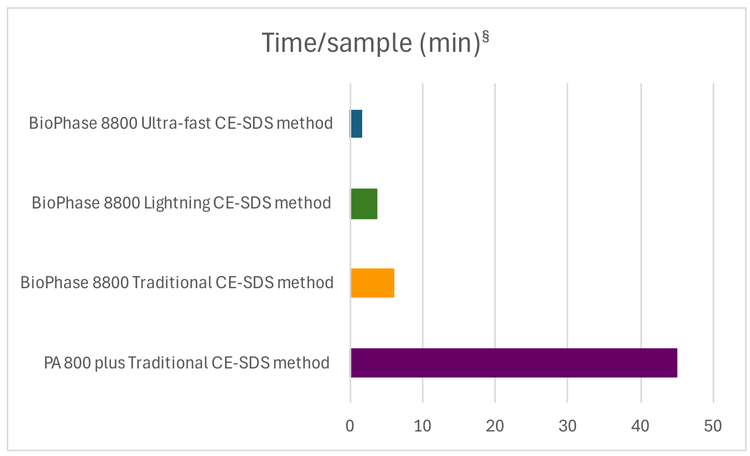
- High throughput and fast time to answer: By enabling 1.8 min/sample or 96 samples in 4.3 hrs (Figure 1)
- Reduced separation time: Achieve a well resolved separation in under 12 minutes by applying unique instrument settings
- Increased sensitivity with LIF detection: Chromeo P503 dye enables highly sensitive detection
- One CE platform for the product's entire lifecycle: The BioPhase 8800 system can bridge the gap between upstream bioprocessing and quality control (QC)
- Carryover: No carryover was observed in the region of interest of the electropherogram.
Introduction
In the biopharma industry, CE-SDS is the gold standard analytical technology for addressing characterization in areas such as protein purity, fragmentation, stability, glycan site occupancy, and aggregation.3 Although CE-SDS instruments are automated and a more reliable alternative to SDS-PAGE, they historically have a low throughput and can become a bottleneck during bioprocess development.
Traditionally, microchip technology is the technique of choice when high throughput is needed. However, microchips may suffer from premature failure due to chip clogging and a lack of robustness and reproducibility.4 Further, cell culture samples are generally a complex mixture of salts, buffers, amino acids, and enzymes, all working synergistically to provide an environment to help cell growth and protein expression.1,2,5 Clogging can be quite challenging when using chip-based technology to analyze cell culture samples directly. Therefore, although utilizing the same analytical platform, chemistry, and software to characterize and determine critical quality attributes from the bioprocessing environment to commercial quality control is highly desirable, as this approach can help eliminate the technology transfer barrier from the early development phase to QC but it is also highly challenging.
This work presents an enhanced CE-SDS workflow designed to empower bioprocessing development scientists to semi-quantify expressed antibodies and other biotherapeutic molecules from upstream bioprocessing samples and cell culture optimization.
This innovative strategy leverages the BioPhase 8800 system's multi-capillary environment, enabling the screening of 96 samples in half a working day. Utilizing the same reliable and robust CE platform, chemistry, and software (BioPhase 8800 software or Empower) throughout the biopharma continuum significantly reduces reagent usage and minimizes plate waste.
Methods
Sample: IgG control standard (P/N391734) was from SCIEX (Carlsbad-CA).
Reagents: BioPhase CE-SDS Protein Analysis Kit (PN C30085) was from SCIEX (Framingham, MA). The β-mercaptoethanol (β - ME) (P/N M3148-25ML), Dimethylsulfoxide (DMSO) (P/N D8418) were from Sigma-Aldrich (St. Louis – MO). The Chromeo P503 dye (P/N 15106) was from Active Motif (Carlsbad-CA).
Capillary cartridges: CE-SDS analysis was performed using a BFS capillary cartridge – 8 x 30 cm (P/N: 5080121) from SCIEX (Framingham, MA).
Capillary electrophoresis instrument and consumables: The BioPhase 8800 system (P/N: 5083590F) and a starter kit of 4 sample plates, 4 reagent plates and 8 outlet plates (P/N: 5080311) were from SCIEX. CE-SDS analysis was performed using LIF detection with an excitation wavelength of 488 nm solid-state laser and emission wavelength of 600 nm/80 nm bandpass filter FWHM 12.5 mm (P/N 65736) from Edmund Optics (Barrington, NJ).
Software: BioPhase 8800 software, version 1.2 e-license, was used to create methods and sequences for data acquisition.
Preparation of Chromeo P503 dye stock solution: 200 μL of DMSO was mixed with the lyophilized Chromeo P503 dye until complete dissolution, followed by the addition of 200 μL of double-distilled and de-ionized water (DDI water), making a 2.5 mg/mL solution. This solution should be in the dark at 2-8o C for up to 2 weeks.
Preparation of Chromeo P503 dye working solution: dilute the 2.5 mg/mL stock solution to 0.5 mg/mL with DDI water.
Sample preparation for CE-SDS-LIF analysis under reducing conditions: All samples were diluted in SDS sample buffer pH 9 to a final concentration of 10 μg/mL in a 100 μL volume. Then, it was heat-denatured and reduced by adding 5 μL of β -ME and heated at 70o C for 10 minutes.
Labeling procedure: After the samples were reduced and heat denatured, add 5 μL of (0.5 mg/mL) P503 dye working solution, mix well and incubate at 70°C for 10 min. The colors will transition from a deep blue to a purple-reddish color. The samples were transferred to the sample plate and placed into the BioPhase 8800 system for analysis.
Results and discussion
This study evaluated various system parameters, including separation temperature and voltage, capillary conditioning, and pre-injection conditioning methods, to enhance throughput without compromising reproducibility and resolution or introducing carryover. The investigation's outcome enables analysis of the mAb samples using CE-SDS in 1.5 min per reduced sample, equivalent to 96 samples within 3 hours, significantly advancing high-throughput capability. The high-throughput can be further enhanced by automating sample preparation with a liquid handler such as the Biomek i5.6
Screening separation voltage and temperature conditions
In capillary electrophoresis (CE), 3 factors can directly and effectively impact the separation time: capillary length, electric field (voltage), and separation temperature.7
Common strategies to decrease separation time often involve reducing the capillary length, increasing the separation temperature, or elevating the electric field individually or in combination. However, these parameters may negatively impact peak resolution. Therefore, considering and optimizing these parameters is critical to balancing reduced separation time and peak resolution.
It is desirable to increase the throughput of CE-SDS to support bioprocess development samples while retaining optimal analytical performance, such as the resolution between the light chain and possible clipped or fragmented pieces of antibody, as well as the non-glycosylated (ng-HC) and glycosylated heavy chain (HC). Figure 2 shows the impact of the temperature and voltage on the separation time compared to the standard conditions (-15kV at 25o C). While the standard separation condition offers exceptional resolution between the ng-HC and HC peaks, the separation time is relatively long, 22 min.
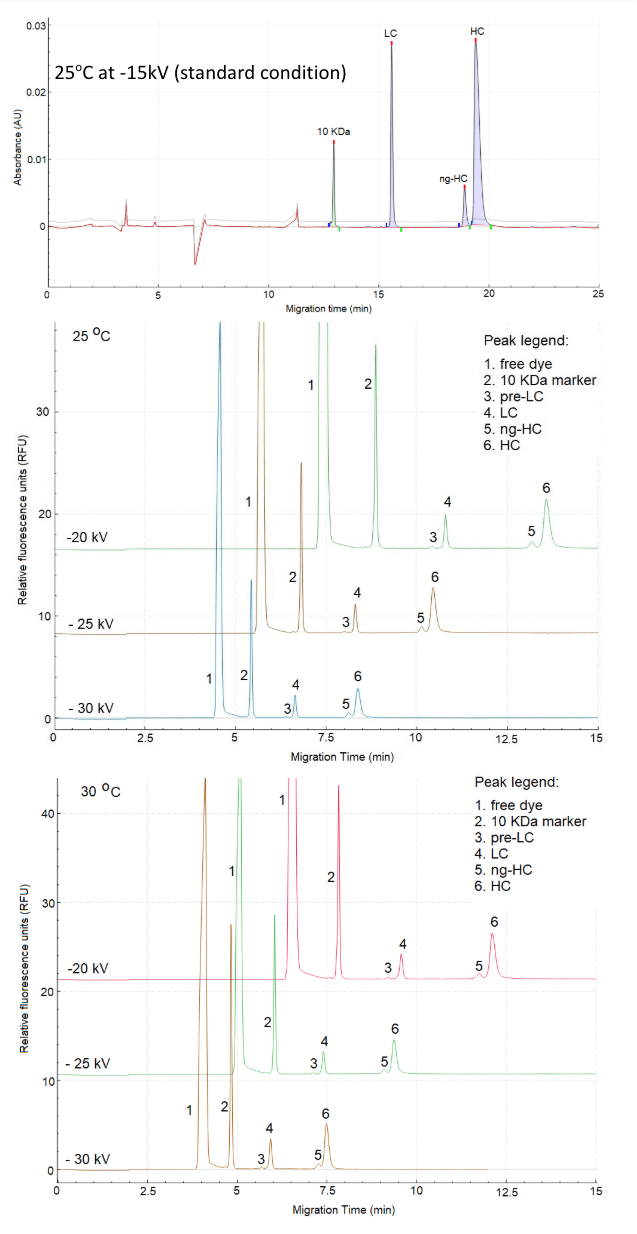

Based on the data collected, 25kV at 30o C or 25o C is optimal to maintain the separation time below 12 minutes for reduced samples while maintaining near baseline resolution between ng-HC and HC.
Adapting capillary conditioning parameters and methods
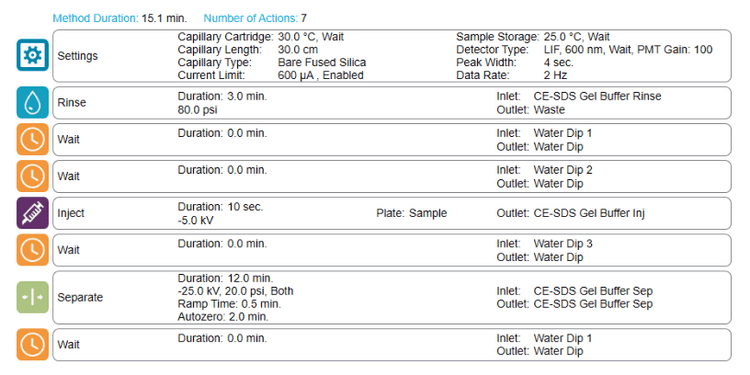
In typical CE-SDS separation method, a considerable amount of time comes from pre-injection capillary conditioning steps, which take at least 9 minutes. In this work, the strategy was implemented to remove the pre-injection capillary conditioning steps (5 minutes in total) except for gel rinse, which was reduced from 4 to 3 minutes.
However, reducing capillary conditioning steps could induce migration time inconsistencies and peak shape degradation due to capillary surface modification over time and carryover. Therefore, a new capillary treatment approach was tested by introducing the shorted capillary conditioning method every 6 injections or at the half-sample plate mark. Figure 3 demonstrates the new sequence setup used in this study.

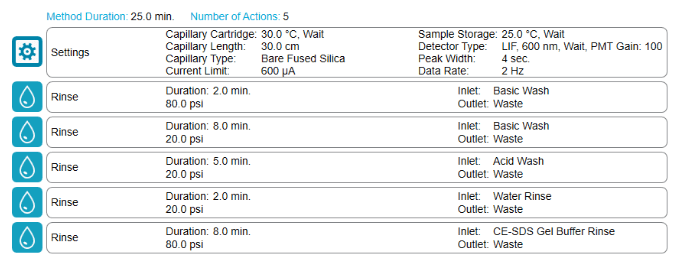
Capillary surface cleaning is critical for robust separation. Therefore, a mid-plate complete capillary conditioning treatment (Figure. 5) was introduced to minimize surface contamination and ensure separation consistency.
With this setup, the user can separate 192 samples in 8.5 hrs, equivalent to 1.8 min/sample.
Evaluation of the performance of the ultra fast CESDS assay
The first important aspect to consider in assay performance is always the inter and intra-capillary reproducibility. The second consideration is carryover.
Inter and intra-capillary reproducibility
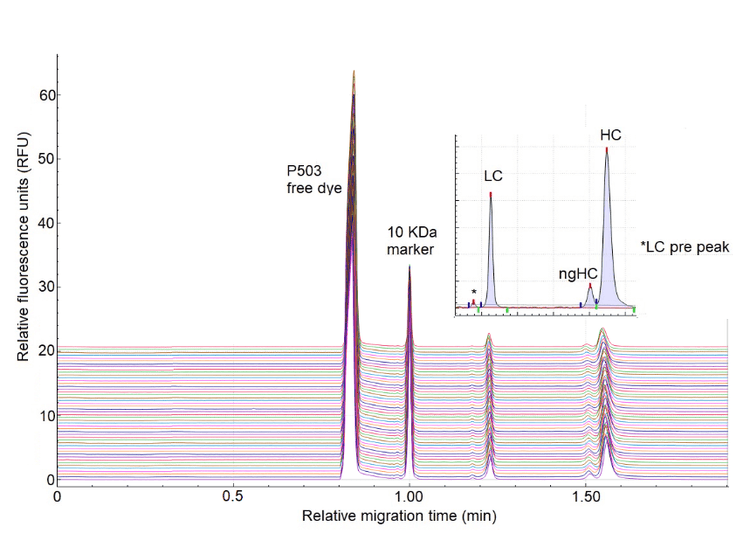
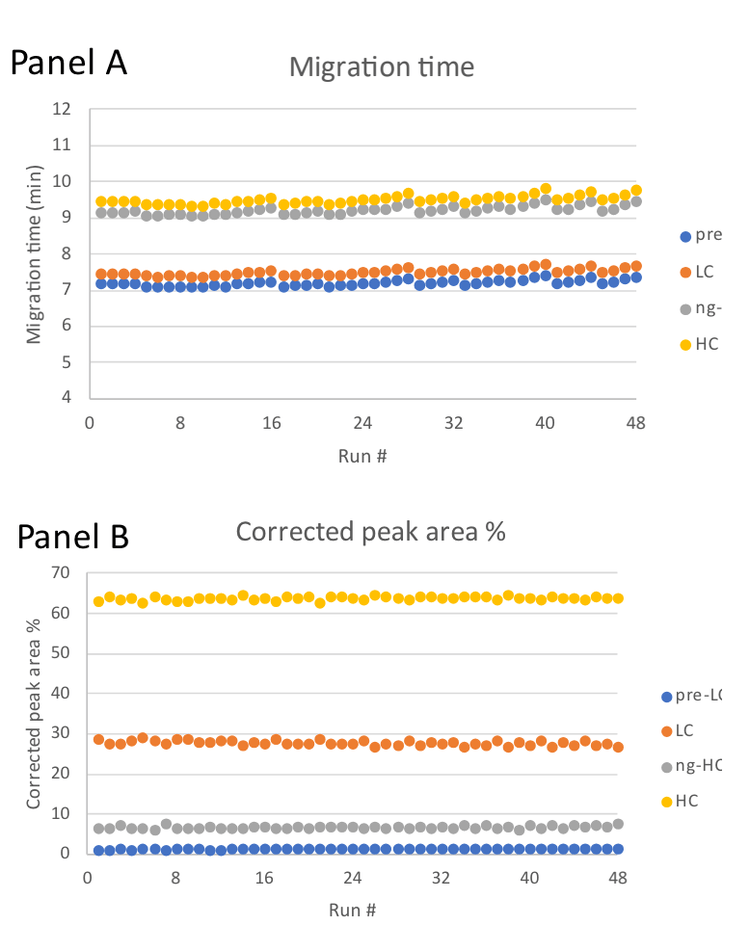
Figure 6 shows the overlay of electropherograms from a reduced IgG control standard sample of 48 separations from capillaries A, C, E and G. The reproducibility of each separation is notable. To substantiate the observation in Figure 6, Table 2 shows the calculated inter-capillary average migration time and %corrected peak area for the 4 peaks observed for the IgG control standard under reducing conditions.

Carryover considerations
Laser-induced fluorescence detection is an advantageous and sensitive technique in CE to analyze materials in low concentrations, such as proteins expressed in cell cultures.7
However, the high sensitivity of this detection method also poses the risk of interference from carryover. Separations towards the end of the sequence are more susceptible to carryover due to the accumulation of free dye.
Sample buffer was injected as blank injections in the same capillary after sample injections to investigate the presence of carryover. Figure 8 shows the sample plate setup for this evaluation.

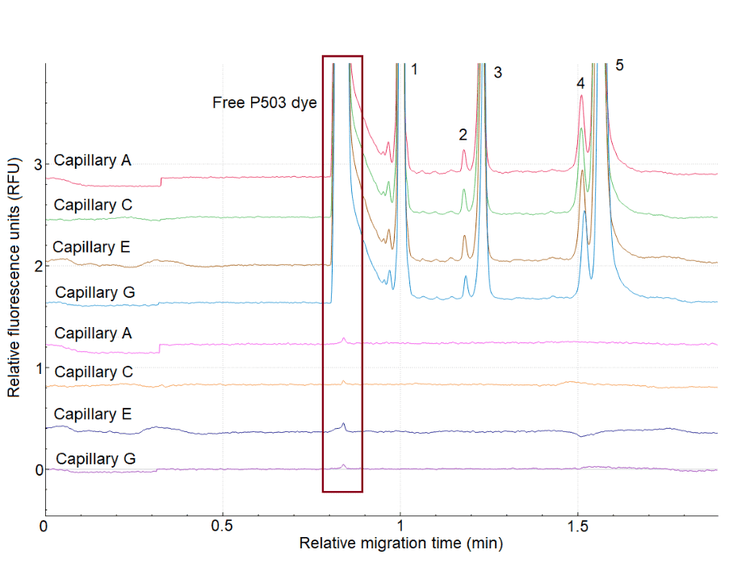
Figure 9 presents the 12th (last) injection of IgG control standard separation on capillaries A, C, E and G, followed by a blank (sample buffer) injection on the same capillaries. The figure indicates a minor carryover present, where the free dye of P503 is migrating. The minor carryover occurred in the region before the 10 kDa marker on the electropherogram. Therefore, it did not interfere with the migration of the protein of interest, as the separation window of interest is after the 10KDa marker, which exhibits a clean baseline without any visible carryover.
With this setup, the user can separate 192 samples in 8.5 hrs, equivalent to 1.8 min/sample, while maintaining migration time consistencies.
Conclusion
- Analysis time was reduced to 1.8 min per sample from 6.25 min per sample, equivalent to 96 samples per half working day with the ultra-fast CE-SDS method
- Increased throughput of the CE-SDS with LIF detection was successfully demonstrated for the semi-quantitative assessment of antibody samples
- The reproducibility of the corrected peak area percentage is below 6.5% for the pre-LC peak ̶ the smallest species in the electropherogram
- The baseline resolution between ng-HC and HC was comparable to the longer traditional method
- Minor carryover of free P503 peak is restricted to a non-relevant region of the electropherogram, enabling confident semi-quantitation of the sample peaks
References
- M. Kornecki, F. Mestmäcker, S. Zobel-Roos, L. H. de Figueiredo,H. Schlüter and J. Strube; Host Cell Proteins in Biologics Manufacturing:The Good, the Bad, and the Ugly; Antibodies 2017, 6, 13.
- F. Li, N. Vijayasankaran, A. (Yijuan) Shen, R. Kiss and A. Amanullah; Cell culture processes for monoclonal antibody production; mAbs 2:5, 466-477(2010).
- A Series of Collaborations Between Various Pharmaceutical Companies and Regulatory Authorities Concerning the Analysis of Biomolecules Using Capillary Electrophoresis; B. Nunnally et al.; Chromatographia 2006, 64, 359 - 368.
- S. D. Noblitt, C. S. Henry; Overcoming Challenges in Using Microchip Electrophoresis for Extended Monitoring Applications; Capillary Electrophoresis and Microchip Capillary Electrophoresis: Principles, Applications, and Limitations, 2013.
- Petra Gronemeyer, Reinhard Ditz and Jochen Strube; Trends in Upstream and Downstream Process Development for Antibody Manufacturing; Bioengineering 2014, 1, 188-212.
- High throughput CE-SDS protein analysis using fully automated sample and reagent preparation workflow; Technical note, 2022.
- J. P. Landers, 1997, Handbook of Capillary Electrophoresis, second edition.
- CE-SDS protein analysis kit for the BioPhase 8800 system.