Abstract
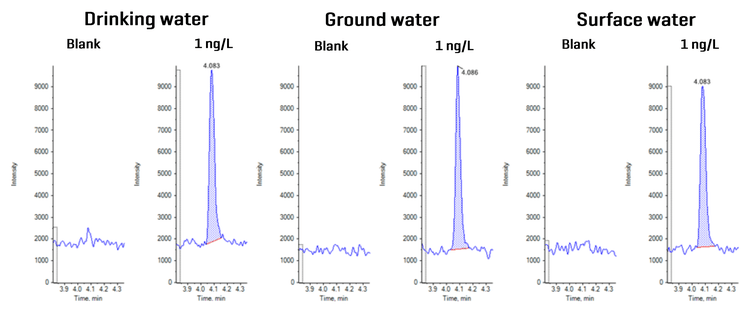
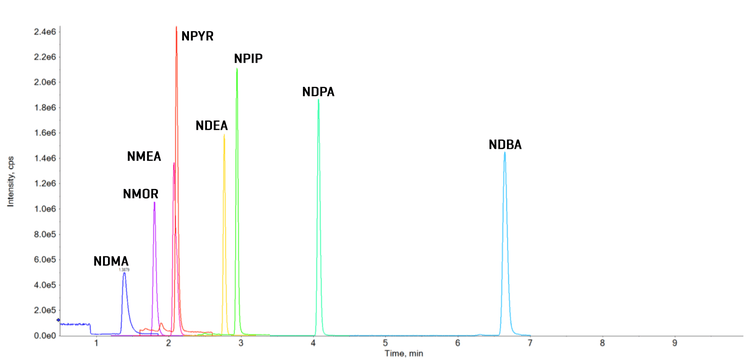
This technical note demonstrates a validated method for the analysis of 8 nitrosamines in 3 different water matrices, achieving reporting limits of 1-3 ng/L. Using the SCIEX 7500 system, along with a simple sample preparation of sodium thiosulfate addition and filtering before direct injection, nitrosamines were detected in all 3 water sources at sub-parts-per-trillion levels and quantified down to 1 ng/L (Figure 1). The extremely low limits of detection were achieved through the ultra-high sensitivity of the SCIEX 7500 system and extensive contamination reduction steps. The inter-day reproducibility (%CV) was ≤12%, and accuracy was 94-105% for all 3 water sources.
This method was established to provide drinking water companies with a sensitive technique for monitoring nitrosamines and fulfilling the requirements set by legislation.4
Key features of nitrosamine quantitation in water using the SCIEX 7500 system
- High levels of sensitivity: Reporting limits of 1-3 ng/L were achieved for all nitrosamines in 3 water sources on the SCIEX 7500 system
- Low-level detection of a nitrosamines in multiple water sources: Detection limits of 0.1-1.3 ng/L were achieved for all nitrosamines in 3 water sources
- Excellent reproducibility and high level of accuracy: %CV values of 4.6-12% and accuracy of 94%-105% were achieved for low concentration spike (5 ng/L) in 3 water sources
- Reduction in background peaks: Pre-treatment of equipment used in sample preparation and analysis to significantly reduce background nitrosamine peaks
Introduction
Nitrosamines have been a cause for concern for years, with some known to be genotoxic (carcinogenic). They are byproducts of industrial processes and can form during water treatment processes that use ozone or chlorine for disinfection. Current regulations for these chemicals in water vary widely across regions, however. For example, with no explicit limit set for nitrosamines in the EU Drinking Water Directive, some countries do not regulate these chemicals or they provide guidance instead of enforcing strict limits. Even when limits are set, they can differ significantly. While the World Health Organization (WHO) specifies a guideline value of 100 ng/L for NDMA1, the limit is 10 ng/L in Germany2. In the US, the Environmental Protection Agency (EPA) sets health reference levels of 30 ng/L for NMBA, 0.4 ng/L for NDEA, 0.6 ng/L for NDMA, 7 ng/L for NDPA, 3 ng/L for NMEA and 2 ng/L for NPYR.3 In the Netherlands, the drinking water legislation sets a health-based limit of 12 ng/L for NDMA specifically, while other nitrosamines are covered by the more general signalling limit of 1 µg/L (1000 ng/L) for anthropogenic substances. The method described here enables ultra-high sensitivity analysis of nitrosamines in different water sources to help ensure compliance with a wide range of regulatory requirements.
Methods
Standard Preparation: Standards withISO 17034 certification were purchased from Supelco and used to prepare the calibration curve in ultra-pure water at concentrations of 1-250 ng/L.
Sample preparation: Water sample containers were cleaned with methylene chloride prior to sampling, and sodium thiosulfate was added for dichlorination for a final concentration of 100 mg/L.
Isotopically labeled nitrosamine internal standards were added to blanks, calibration standards and water samples for a final concentration of 50 ng/L. The resulting solutions were filtered with a 0.45 µm regenerated cellulose filter before transfer to glass autosampler vials for injection.
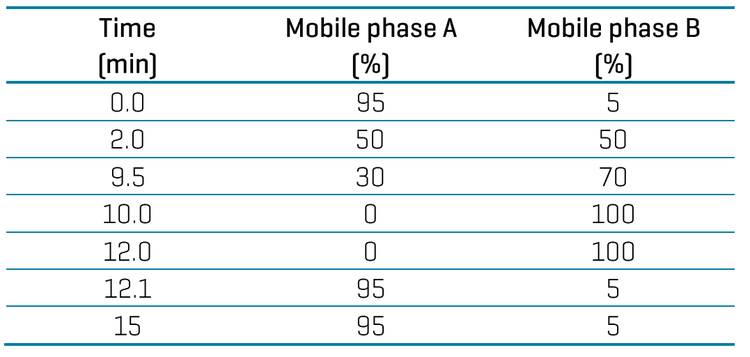
Chromatography: Chromatographic separation (Figure 2) was performed using a Shimadzu LC-40 system with a Waters ACQUITY Premier HSS T3 (2.1 x 100 mm, 1.8 µm) column. A 15-min gradient was run at a flow rate of 0.5 mL/min using 0.1% formic acid in ultra-pure water as mobile phase A and 0.1% formic acid in methanol as mobile phase B (Table 1) with all compounds having a k’ value of >1.4. The MS divert valve sent flow to waste from 0 min to 0.9 min and from 10 min to 15 min. The column temperature was maintained at 45°C and the injection volume was 100 μL.
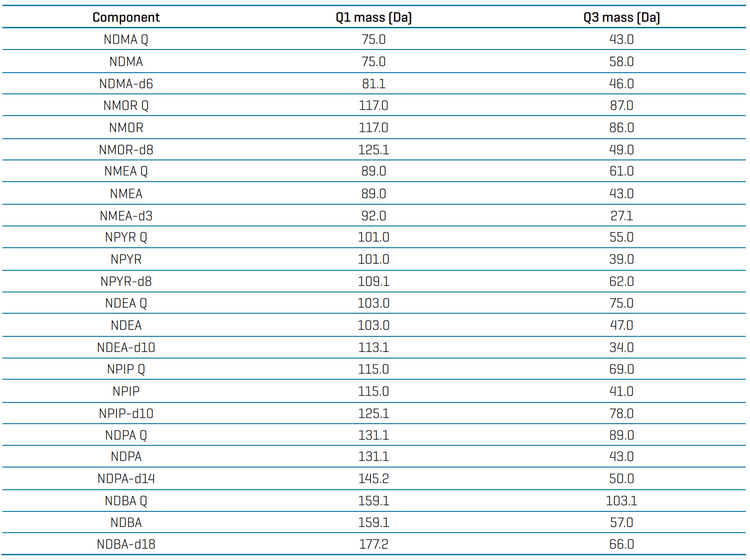
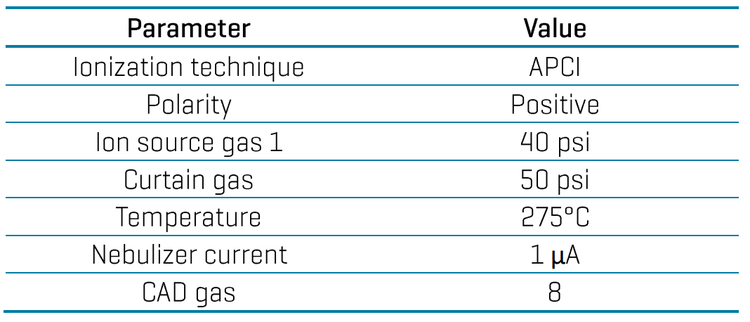
Mass spectrometry: Samples were analyzed using the SCIEX 7500 system operated in APCI positive ion mode (Table 2 and Appendix, Table 7). Q0D optimization was performed and the system was operated in simple mode for the analysis.
Data processing : Processing was performed using SCIEX OS 3.3.1.4 software.The peak-to-peak signal-to-noise (S/N) and MQ4 integration algorithms were used.
Quantitative performance
Netherlands legislation for the production and distribution of drinking water (Decree no. BWBR0030111) states that the reporting limit (RL) for a specific regulated compound in water must be ≤25% of the regulatory limit. For example, the regulatory limit for NDMA is 12 ng/L, so its RL must be ≤3 ng/L. Nitrosamines with regulatory limits of 1000 ng/L require a maximum RL of 250 ng/L.4 The RL, or limit of quantitation (LOQ), for this method is based on a Netherlands standard for food and environmental analysis (NEN 7777+C1:20125). It is defined as the lowest value within the linear range for the calibration curve prepared in ultra-pure water, with a S/N ratio of ≥3. This is checked against the calculated limit of detection (LOD) in matrix to ensure that LOQ > LOD.
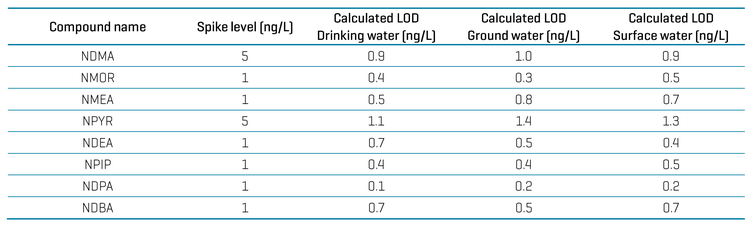
Table 3 highlights the LOQ for all nitrosamines tested. Figure 3 shows the LOQ and blank injections overlaid for 3 nitrosamines.
Linearity was determined using the calibration curve prepared in ultra-pure water and each nitrosamine compound tested showed linearity between their respective LOQ and 250 ng/L (r2 value of > 0.99, 1/x weighting). The linearity of NMEA is shown in Figure 4.

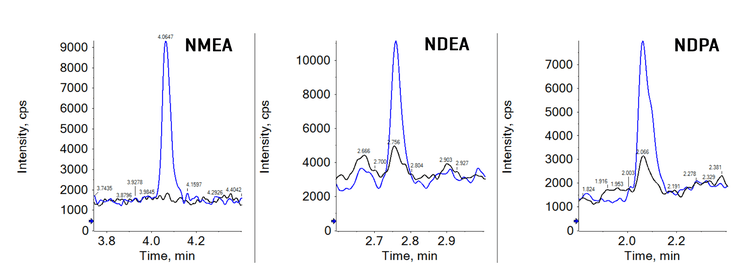
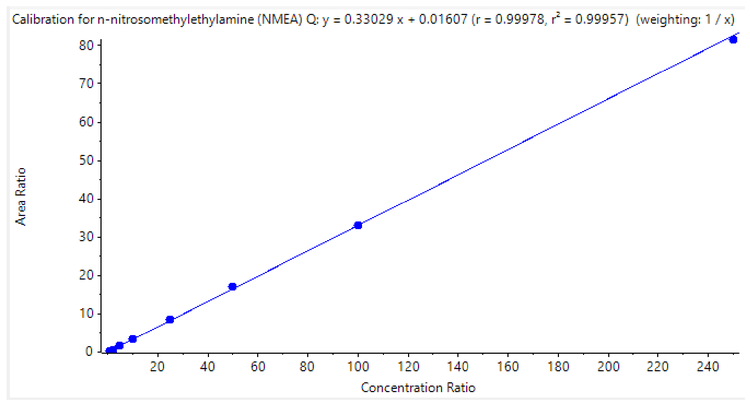
Table 4 summarizes the results of the spiked water matrix samples with their corresponding spike level and subsequent detection limit in each water matrix. Spike levels were determined based on the LOQ shown in Table 3. Compounds with an LOQ of 1 ng/L were determined at a 1 ng/L spike and all others were determined at a 5 ng/L spike.6 Figure 1 shows the 1 ng/L spike for NDPA in 3 water sources. This determination was performed on 8 separate days with the LOD defined as 3 times the standard deviation across all injections. The calculation for the determination of the detection limit was based on Het Waterlaboratorium’s internal SOP, which is based on the NEN 7777+C1:2012 standard.5 The calculated detection limits ranged from 0.1 to 1.4 ng/L, with only NDMA and NPYR having a calculated LOD at 1 ng/L or higher.
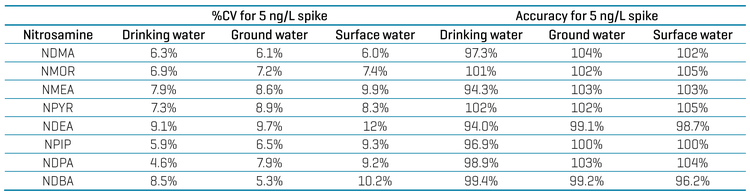
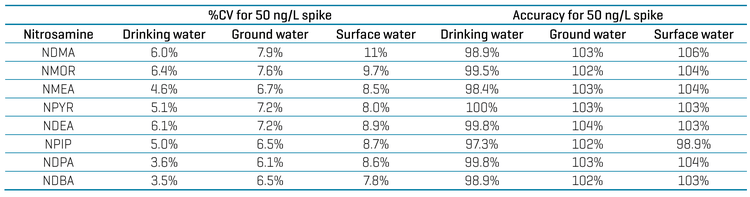
Accuracy and precision for the method was measured using 9 replicate injections performed over 8 days, of a 5 or 50 ng/L spiked samples in all three water matrices tested. The injections have been summarized for both precision and accuracy in Table 5 (5 ng/L spike) and Table 6 (50 ng/L spike) which highlights the very high levels achieved for both metrics, at both spike levels in all three water matrices.
Mitigation of contamination and interferences
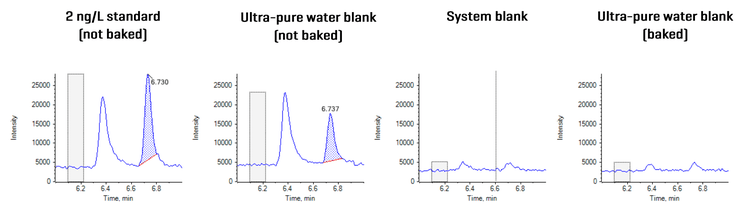
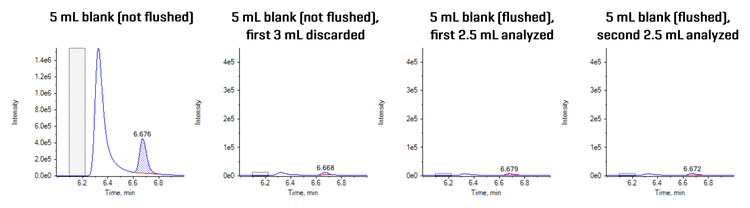
When trying to accurately quantify nitrosamine compounds using LC-MS/MS, contamination of equipment and interferences are major concerns since they can affect accuracy and linearity. Figure 5 and Figure 6 show how pre-treating glassware and flushing regenerated-cellulose filters removed contamination and interferences to enable successful low-level quantitation of nitrosamines in water.
Here, we detail our pre-treatment approach and additional steps taken to help ensure the sensitivity required for nitrosamine analysis.
- High grade solvents and formic acid were used for nitrosamine analysis, and multiple sources were checked to ensure there was no contamination
- Ultra-pure water was treated with a UV-module to break down trace amounts of nitrosamines
- Dedicated glassware was used for nitrosamine sample preparation and analysis, and autosampler vials were baked for several hours at 550°C (Figure 5), which removed blank interferences for NDBA and a significant ghost peak for NDPA that previously prevented low-level quantitation
- RC filters were flushed before use with 10 mL of ultra-pure water (Figure 6), which removed significant interferences for NDBA
- Vials were not reused for re-injections due to the potential for nitrosamines to leach from the septum
- Rubber was avoided during sample preparation as it is a common source of nitrosamine contamination
Conclusion
- High levels of sensitivity for nitrosamines in drinking, ground and surface water were achieved using the SCIEX 7500 system with LOQ levels of 1 ng/L and linearity across ≥3 orders of magnitude possible
- Calculated detection limits as low as 0.1 ng/L were achieved in the 3 water sources
- The method demonstrated accurate (94-105%) and highly reproducible (%CV ≤12%) quantitative performance for 5 ng/L and 50 ng/L spikes in 3 water sources
- Solvent selection and pre-treatment of equipment are vital to the successful low-level quantitation of nitrosamines in water
Acknowledgement
We would like to thank Said El Ouadi (SCIEX) for helping to make this collaboration possible.
References
- World Health Organization (WHO). Guidelines for drinking-water quality: fourth edition incorporating the first and second addenda. March 2022.
- German Federal Environment Agency (UBA). Hygiene-related assessment of "non-relevant" metabolites (as defined in chemicals law) of active substances of plant protection products in drinking water. April 2008.
- US Environmental Protection Agency (EPA). Six-Year Review 3 Technical Support Document for Nitrosamines. December 2016.
- Government of the Netherlands. Decree no. BWBR0030111 of 23 May 2011, containing provisions on the production and distribution of drinking water and the organisation of the public drinking water supply (Drinking Water Decree). May 2011.
- Royal Netherlands Standardization Institute (NEN). NEN 7777+C1:2012 standard: Environment and food - Performance characteristics of measurement methods. December 2012.
- Het Waterlaboratorium. Validation report for the determination of nitrosamines in water using direct injection and LC-MS/MS. September 2023.
Appendix