Maximizing throughput with a 10-minute multiresidue pesticide analysis method on the novus V55 system
Abstract
This technical note describes a high-throughput LC-MS/MS method for the quantitation of 447 pesticides in fruits and vegetables using the novus V55 system. The method combined fast polarity switching with accelerated MRM (aeMRM) acquisition, monitoring 894 MRM transitions in 10 minutes (Figure 1). The sensitivity of the novus V55 system enabled a simplified QuEChERS extraction without clean-up, followed by direct injection. The method achieved a limit of quantification (LOQ) of 10 μg/kg for >99% of the compounds across 10 representative fruit and vegetable matrices, while maintaining excellent precision, with >91% of quantifier and qualifier transitions exhibiting %CV ≤10% across 6 replicate injections.
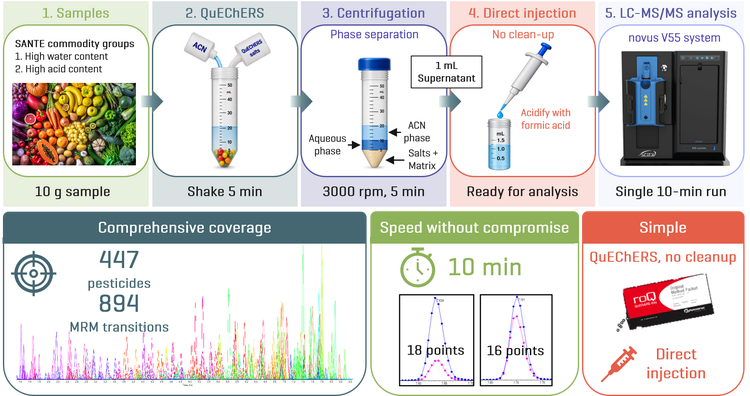
Key benefits of the novus V55 system for food testing
- High-throughput: 447 pesticides monitored using 894 positive and negative MRMs in a single 10-minute injection
- Simplified sample preparation: ACN QuEChERS extraction without clean-up followed by direct injection
- Excellent sensitivity: LOQ of 10 μg/kg achieved across 10 representative fruit and vegetable matrices from commodity groups 1 and 2 of SANTE 11312 v2026
- Outstanding precision: >91.2% of quantifier and qualifier transitions showed %CV ≤ 10% across all matrices (n = 6)
Introduction
Food testing laboratories continue to face increasing pressure to improve sample throughput, while maintaining compliance with regulatory requirements for pesticide residue analysis. High-water and high-water/high-acid content fruits and vegetables represent a major proportion of routine food testing samples and are often screened against extensive pesticide panels containing several hundred compounds. As pesticide scope increases, analytical methods must balance sensitivity, selectivity, data quality and laboratory productivity.
Traditional multiresidue pesticide workflows frequently rely on QuEChERS extraction, followed by dispersive solid-phase extraction clean-up. Typical LC-MS/MS acquisition methods require approximately 20 min per injection, limiting sample throughput and increasing overall analysis costs. In addition, the simultaneous monitoring of hundreds of compounds can challenge conventional methods due to cycle time limitations and insufficient data points across chromatographic peaks, often necessitating multiple injections. The novus V55 system combines the sensitivity and robustness of a fifth-generation SCIEX triple quadrupole platform with rapid polarity switching and accelerated MRM (aeMRM) acquisition,1 enabling the monitoring of large MRM panels while maintaining quantitative performance.
This technical note demonstrates the quantitation of 447 pesticides in fruits and vegetables using a single 10-min LC-MS/MS method. A simplified QuEChERS extraction without clean-up was coupled to direct injection onto the novus V55 system. High-water and high-acid/high-water commodity groups, as defined by the European Reference Laboratory (EURL) SANTE guidelines,² were selected because they represent the largest proportion of the samples routinely analysed by food-testing laboratories while being among the least complex food matrices. Method performance was evaluated across ten representative matrices based on sensitivity, repeatability, chromatographic data quality and matrix effects. The results demonstrate that the novus V55 system can significantly increase laboratory productivity by reducing sample preparation complexity, eliminating multiple injections and decreasing analysis time while maintaining the analytical performance required for routine multiresidue pesticide testing.
Methods
Standards and samples:Mixed pesticide standard solutions were used to prepare stock solutions and calibration standards in acetonitrile. Apple, zucchini, tomato, onion, leek, spinach, potato, orange, strawberry and kiwi were locally purchased.
Sample preparation: Food samples were extracted using the QuEChERS extraction protocol. Briefly, 10 g of homogenized sample was weighed in a 50 mL centrifuge tube, then extracted with 10 mL of acetonitrile. After addition of a QuEChERS packet (4 g MgSO4, 1 g NaCl, 1 g SCTD, and 0.5 g SCD; Phenomenex P/N KS0-8909), the sample was vortexed and shaken for 5 min. Following centrifuging at 3,000 rpm for 5 min, the supernatant was transferred into an autosampler vial and acidified with 0.1% (v/v) formic acid. Post-spiked matrix standards were prepared at 10 μg/L and 100 μg/L.
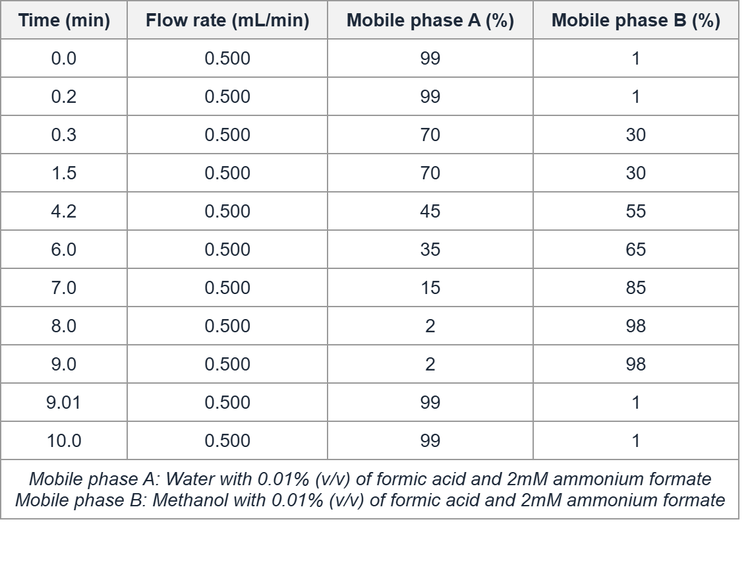
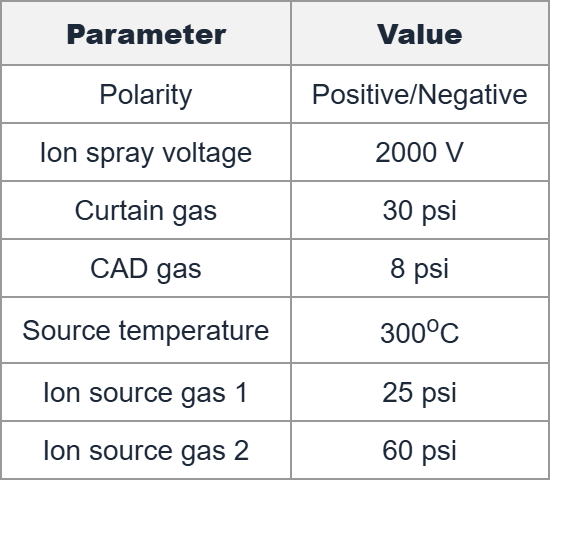
Chromatography: Chromatographic separation was performed on a Shimadzu LC-40 X3 system using a Luna Omega Polar column (50 x 2.1 mm, 1.6 μm Phenomenex P/N 00B-4748-AN). A flow rate of 0.5 mL/min, an injection volume of 2 μL and a column temperature of 50°C were used. The LC gradient is presented in Table 1.
Limits of quantitation and linearity in solvent
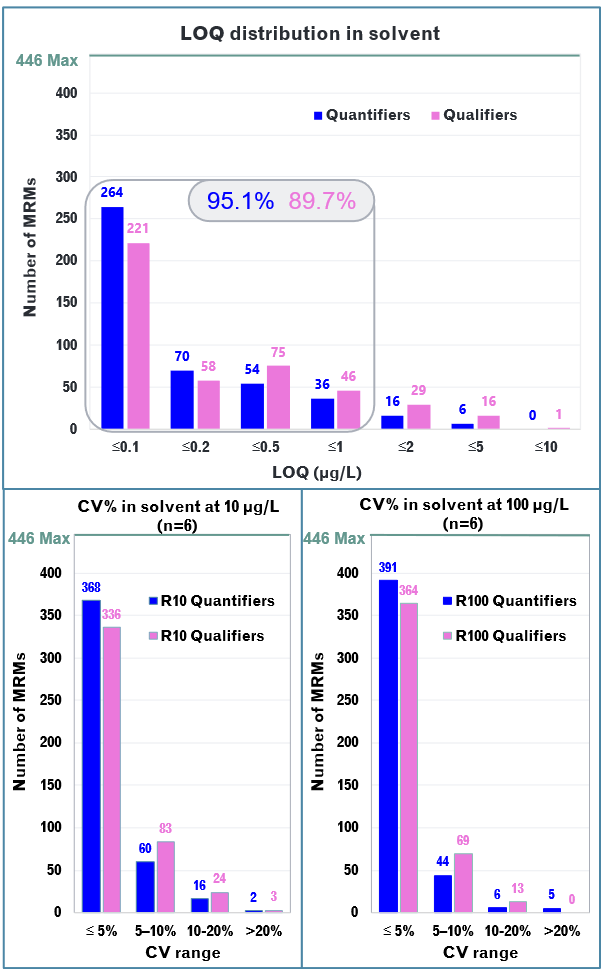
Twelve calibration levels (0.01–100 μg/L) were analyzed to evaluate linearity and LOQs in solvent. Standards at 10 μg/L and 100 μg/L were injected six times to assess repeatability. Calibration curves were fitted using quadratic regression with 1/x weighting and an accuracy tolerance of ±20%. For each MRM, the LOQ was selected based on the first calibration level meeting the criteria of S/N ≥ 10 and accuracy within ±20 % of the nominal value. As shown in Figure 2, all pesticides exhibited LOQs of ≤10 μg/L for both quantifier and qualifier MRMs. For quantifier and qualifier transitions, 95.1% and 89.7%, respectively, achieved LOQs ≤1 μg/L, while approximately 50% of all monitored transitions achieved LOQs ≤0.1 μg/L.
Repeatability was excellent at both 10 and 100 μg/L, with > 99% of monitored MRMs exhibiting CV values ≤20%. At 10 μg/L, 82.5% of quantifier MRMs and 75.8% of qualifier MRMs achieved CV values ≤5%, demonstrating highly reproducible quantitative performance. Method linearity was also outstanding, with more than 99% of MRMs showing coefficient of determination (r²) values ≥0.99, with the majority exceeding 0.995 (Figure 3). Representative calibration curves for azoxystrobin (ESI+) and 2,4-D (ESI−) are shown in Figure 3.
Sensitivity and repeatability in matrix extracts
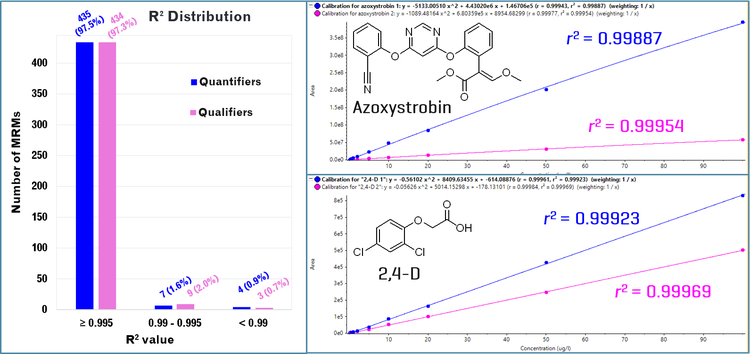
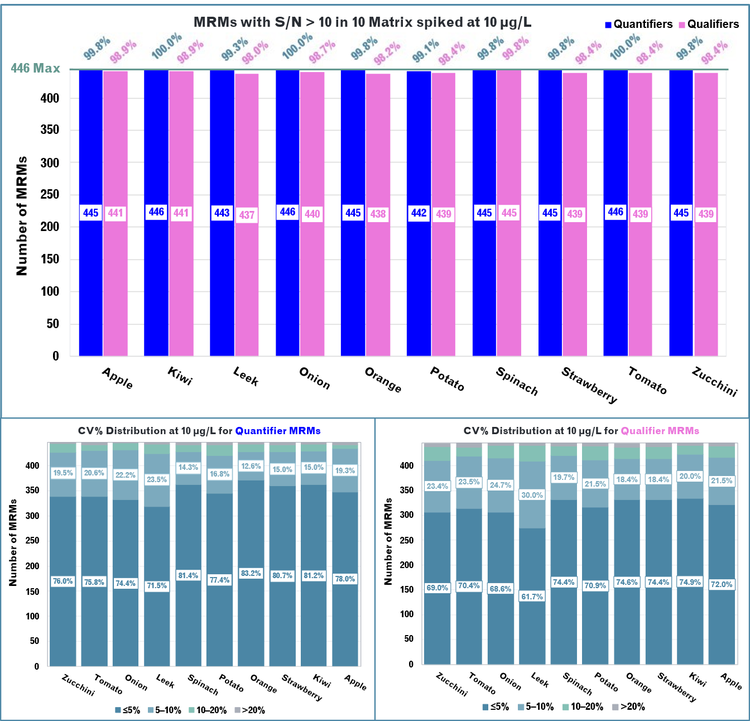
Figure 4 (top) summarizes the number of quantifier and qualifier MRMs achieving S/N >10 in each matrix post-spiked at 10 μg/L. Between 442 (potato) and 446 (kiwi, onion, tomato) quantifier MRMs were detected with S/N >10, corresponding to 99.1–100% of all quantifier MRMs. For qualifiers MRMs, values ranged from 437 (leek) to 445 (spinach), corresponding to 98.0–99.8% of monitored transitions. When a threshold of S/N >3 is considered, which is usually the mandatory threshold for confirmation, qualifier detection rates further increase (data not shown). These results demonstrate that the novus V55 system can both quantify and confirm >99% of the target pesticides at 10 μg/L using a single 10-min runtime.
Excellent quantitative repeatability was observed across all ten matrices (Figure 4, bottom left). Between 94.2% (potato) and 97.3% (apple) of quantifier MRMs, corresponding to 420 and 434 transitions, respectively, achieved %CVs ≤10%, with most transitions exhibiting %CVs ≤5%. Even in leek, the most challenging matrix, 71.5% of quantifier MRMs (319 transitions) showed %CVs ≤5%. Across all matrices, a maximum of only 1.1% of monitored MRMs, corresponding to 5 compounds, exhibited %CVs greater than the recommended SANTE threshold of >20%.2 Qualifier transitions showed comparable
repeatability, further demonstrating the robustness of the method (Figure 4, bottom right).
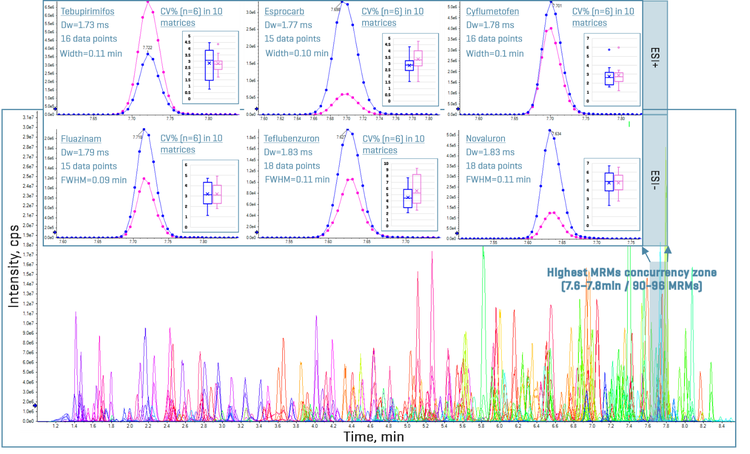
The robust quantitative performance of the novus V55 system is enabled by its high acquisition speed (up to 1000 MRMs/s)1, preserving chromatographic data quality even during periods of high MRM concurrency. Between 7.6 and 7.8 min, as many as 90 to 96 MRMs were monitored simultaneously, resulting in dwell times as short as 1.73 ms (Figure 5). Despite these challenging acquisition conditions, sufficient data density was maintained across the chromatographic peaks. As shown in the inset of Figure 5, the six compounds acquired with the shortest dwell times, namely, tebupirimifos, esprocarb and cyflumetofen in ESI+ mode, and fluazinam, teflubenzuron and novaluron in ESI− mode, generated at least 15 data points per peak and good S/N, including fluazinam, which exhibited a peak width of only 0.09 min. Therefore, the data demonstrated that operating with very short dwell times, below 2 ms, did not compromise quantitative performance. The box-and-whiskers plots of each compound show median CVs below 5%, with a maximum %CV of 9.2% observed for teflubenzuron in strawberry. This demonstrates the ability of the novus V55 system to maintain excellent precision even under highly demanding acquisition conditions.
Matrix Effects
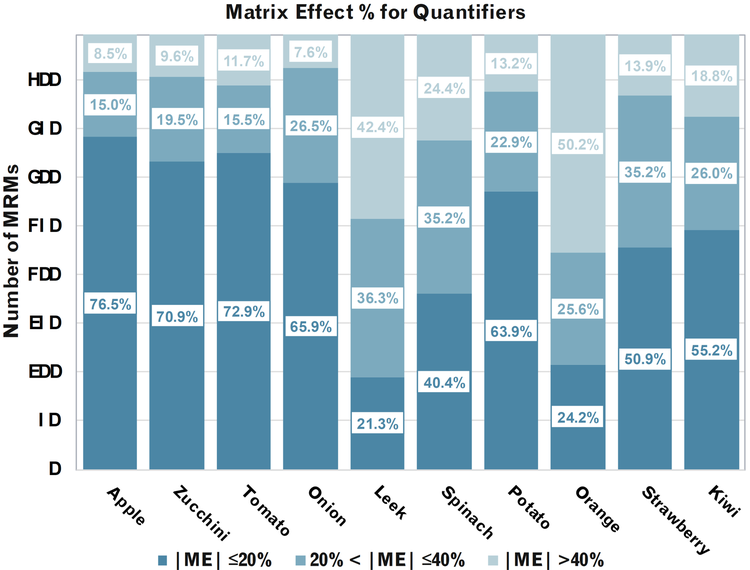
Matrix effects (MEs) are frequently observed in the LC-MS analysis of food matrices. A previous EURL study, combining QuEChERS extraction without cleanup and a 15 min LC gradient, reported MEs of 10–48% for 209 pesticides in tomato, orange and onion.3 Figure 6 summarizes the distribution of MEs across the 10 food matrices, which were calculated by comparing analyte responses in the matrix-matched standard to the corresponding solvent standard, using the following equation:

Absolute ME values of ≤20% were considered not significant. An additional threshold of ≤40% was used to identify compounds for which the matrix effect alone would remain within the 60%–140% range, commonly considered during method validation. Seven of the 10 matrices—apple, zucchini, tomato, onion, potato, strawberry, and kiwi— exhibited |ME| ≤20% for 60.9%–76.5% of the pesticides, with the lowest proportion observed in
kiwi and the highest in apple. Furthermore, 81.2%–92.4% of the pesticides exhibited |ME| ≤40%, suggesting that solvent-based calibration may be suitable for a large proportion of the panel, if extraction recovery and overall method accuracy also meet the applicable validation criteria.
Leek, orange and to a lesser extent, spinach, exhibited more MEs. The proportion of pesticides with |ME| ≤20% ranged from 21.3% in leek to 40.4% in spinach, while 49.8%–75.6% exhibited |ME| ≤40%. These MEs were considered reasonable trade-offs for a simpler QuEChERS extraction without clean-up and a faster 10-minute gradient, while a low injection volume of 2 μL helped mitigate the impact on overall method performance. As 95.1% of the quantifier MRMs achieved solvent LOQs ≤1 μg/L, a ten-fold dilution of the extracts could be considered to further reduce MEs without sacrificing sensitivity. The applicability of this approach depends on the analyte list and the required reporting limits. However, matrix matched calibration is recommended for more challenging analyte/matrix combinations.
Robust performance for challenging compounds
Conclusions
Here, the simplified QuEChERS extraction without clean-up combined with the novus V55 system provided a powerful solution for food laboratories seeking to increase sample throughput, simplify operations and maximize analytical scope.
- Accurate and reproducible quantitation was demonstrated for 447 pesticides (894 MRMs) in a 10-min LC-MS/MS run
- Excellent sensitivity and precision in both solvent and matrix-matched standards (99.1–100% of quantifier MRMs with S/N >10 at 10 μg/L and %CV ≤10%)
- The high acquisition speed of the novus V55 system maintained excellent data quality even during periods of high MRM concurrency (up to 96 MRMs and <2 ms dwell times)
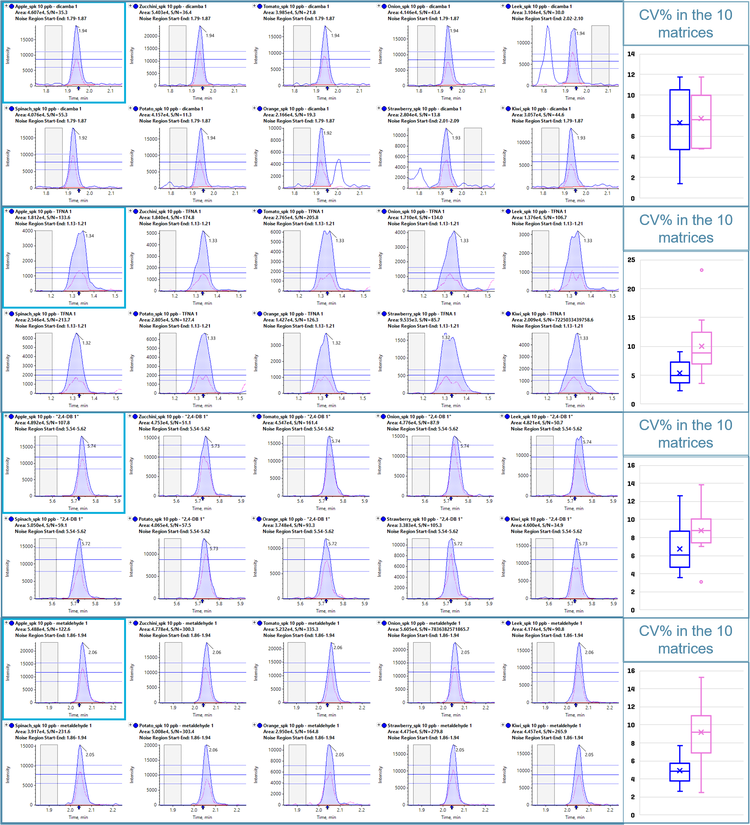
- Robust performance was achieved not only for routine pesticides, but also for challenging compounds, such as dicamba, TFNA, 2,4-DB and metaldehyde, demonstrating the capability of the workflow to address compounds that frequently limit multiresidue methods
Acknowledgements
SCIEX thanks Laboratoire Girpa (France) for providing both standards and samples and Guillaume Morin, Elena Latouche and Antoine Daguin for their support and access to the facilities.
References
- The SCIEX novus V55 system. SCIEX brochure. MKT-38393-A.
- EU Reference Laboratories for Residues of Pesticides. Analytical quality control and method validation procedures for pesticide residues analysis in food and feed. SANTE 11312/2021 v2026.
- EU Reference Laboratory for Pesticides Residues. Matrix effects impact using different chromatographic column sizes. EURL FV-2020-M38.