Abstract
Sensitivity, specificity and throughput are vital factors in bioanalytical laboratories. Most laboratories aim to achieve low levels of detection while using less sample and processing many samples per minute. These priorities can help increase efficiency and productivity in a therapeutic laboratory. Plate readers have commonly been used for drug screening but developing these methods can be time consuming. Furthermore, achieving high specificity with plate readers can be challenging, as can achieving high throughput with liquid chromatography methods. This technical note demonstrates a highly sensitive, highly specific, high-throughput quantitative solution for drug screening using the Zeno trap on the Echo® MS+ system with ZenoTOF 7600+ system.
Key features of the Zeno MRMHR scan with and without application of the Zeno trap
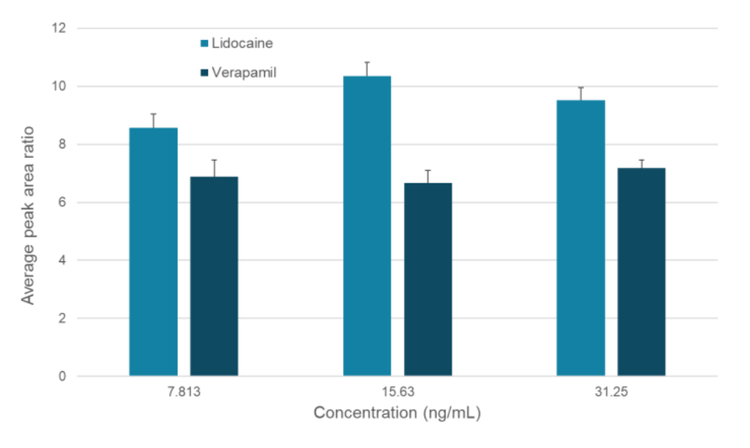
- Enhanced signal response: Achieve approximately 7x more signal for lidocaine and verapamil with the Zeno trap enabled compared to analysis without the Zeno trap
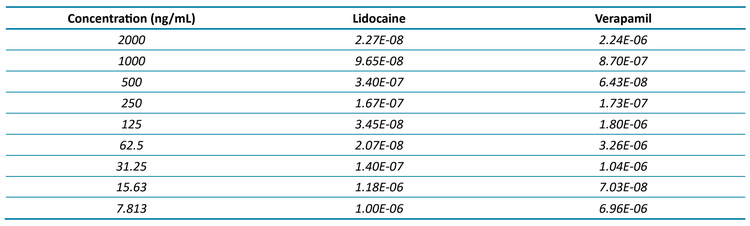
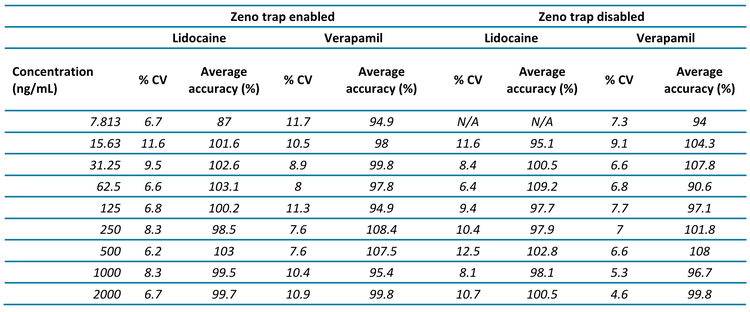
- Low detection limits: Detection of lidocaine and verapamil at 7.813 ng/mL was achieved with the Zeno trap
- Increased specificity: The Zeno MRMHR scan provided a full product ion scan from a targeted precursor analyte for a 1- second peak width and could be used for library searching to aid with compound confirmation1,2
- High throughput: Rapid batch analysis of 63 samples in 2.6 minutes is possible
- Zeno MRMHR method customization: Analyze a fixed fragment ion or scan a wide range of fragment ions
Introduction
High-throughput screening labs commonly seek instruments with high sensitivity, high specificity and high throughput.3 Plate readers are often employed for early phase drug screening but development for these types of assays can be time consuming.4 Additionally, the endpoint of a plate reader assay is based on a reaction that generates an absorption or emission signal that is not caused by the compound itself, which can reduce the specificity of the assay.4
The Echo® MS+ system with ZenoTOF 7600+ system provides high-resolution mass spectral data, enhanced sensitivity with the application of the Zeno trap, high specificity and rapid throughput with sample ejection rates up to 1 sample/second.5 With the Zeno MRMHR scan selected, the Echo® MS+ system with ZenoTOF 7600+ system can generate a single TOF MS spectrum and specific MS/MS product ion scans from targeted compounds with defined precursor masses. The user can opt to analyze a single product ion or opt to analyze a wide range of product ions at collision energies and collision energy spreads (a range of energies within a TOF MS/MS accumulation).
In this study, we demonstrated the ability of the Echo® MS+ system with ZenoTOF 7600+ system to produce full-range product ion scans in 1 second for 2 commonly used small molecule probes, lidocaine and verapamil. Nine different concentrations ranging from 7.813 ng/mL to 2000 ng/mL were analyzed using Zeno MRMHR.
Methods
Sample preparation: Concentration curves for lidocaine and verapamil were prepared in an Echo MS® qualified 384-well plate using the serial dilution function of the INTEGRA (Hudson, NH) 8- channel pipettes. The samples contained lidocaine and verapamil at 2000 ng/mL, 1000 ng/mL, 500 ng/mL, 250.0 ng/mL, 125.0 ng/mL, 62.50 ng/mL, 31.30 ng/mL, 15.60 ng/mL and 7.813 ng/mL concentrations.
Acoustic ejection: A total of 30 nL of the sample was ejected at an interval of 2 seconds per ejection using standard peak mode (400 Hz repetition rate). The carrier solvent consisted of a mix of 70:30 (v/v), water/acetonitrile and 0.1% (v/v) formic acid. A flow rate of 400 µL/min was used.
Mass spectrometry: A Zeno MRMHR method with a wide range of fragment ions was optimized and the “Zeno trapping” checkbox of the optimized method was then toggled “on” and “off” as the sample batches were run. The Zeno MRMHR method was optimized by directly infusing the 125 ng/mL standard of each compound via the Echo® MS+ system (Tables 1-4).


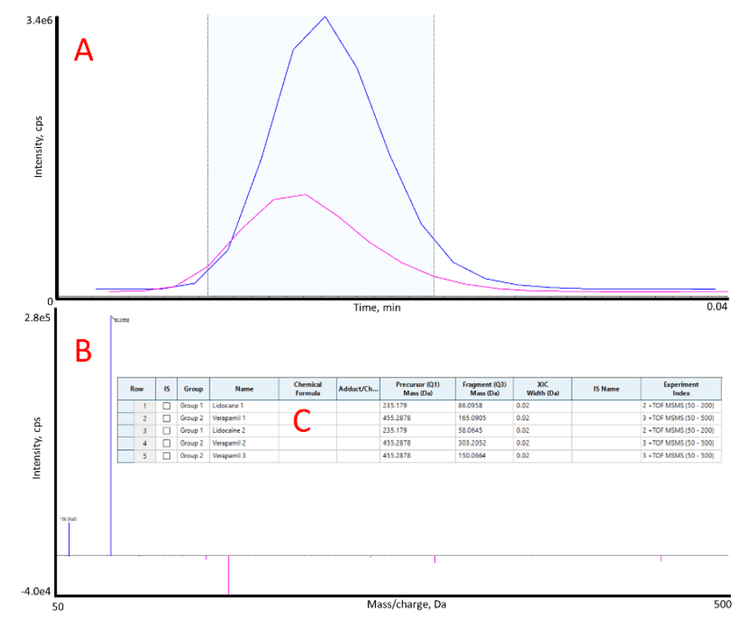
Increased peak areas observed at all tested concentrations with the Zeno trap enabled
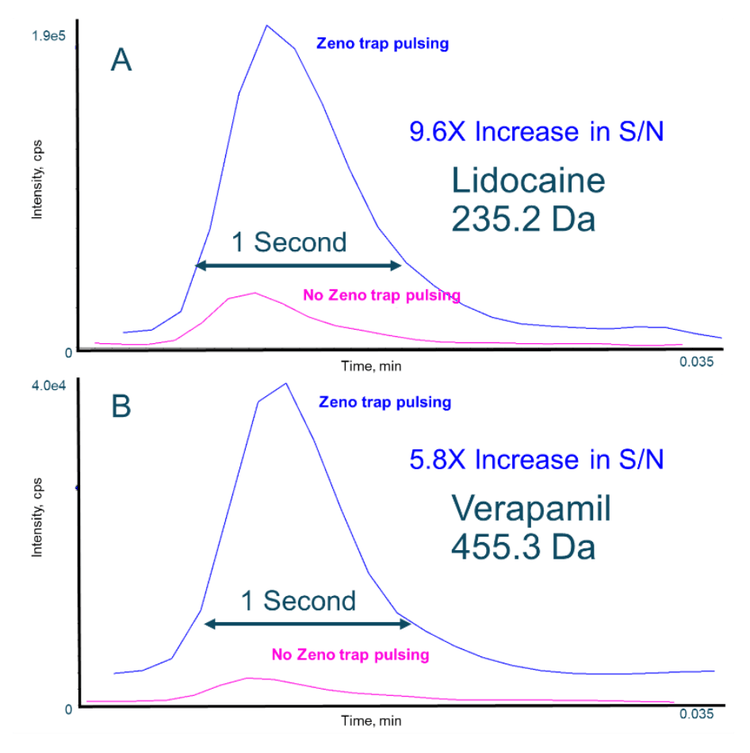
On average, with the Zeno trap enabled, 9.6-fold and 5.3-fold increases were observed for the signal-to-noise ratios for lidocaine and verapamil, respectively. These results were achieved when the Zeno MRMHR scan was performed with a wide range of fragment ions (Figure 1).
Discussion
When scanning a range of product ions, it is possible to quantify more than 1 product ion. By inputting 1 Zeno MRMHR channel in the "MS Method" of SCIEX OS software, the user can select multiple fragment ions to quantify in the Analytics module (Figure 4). This experiment can be performed efficiently at rates as fast as 1 sample/second and is compatible with batch processing.
Conclusion
- Use of the Zeno trap yielded approximate 6- and 9-fold increases in signal for verapamil and lidocaine, respectively
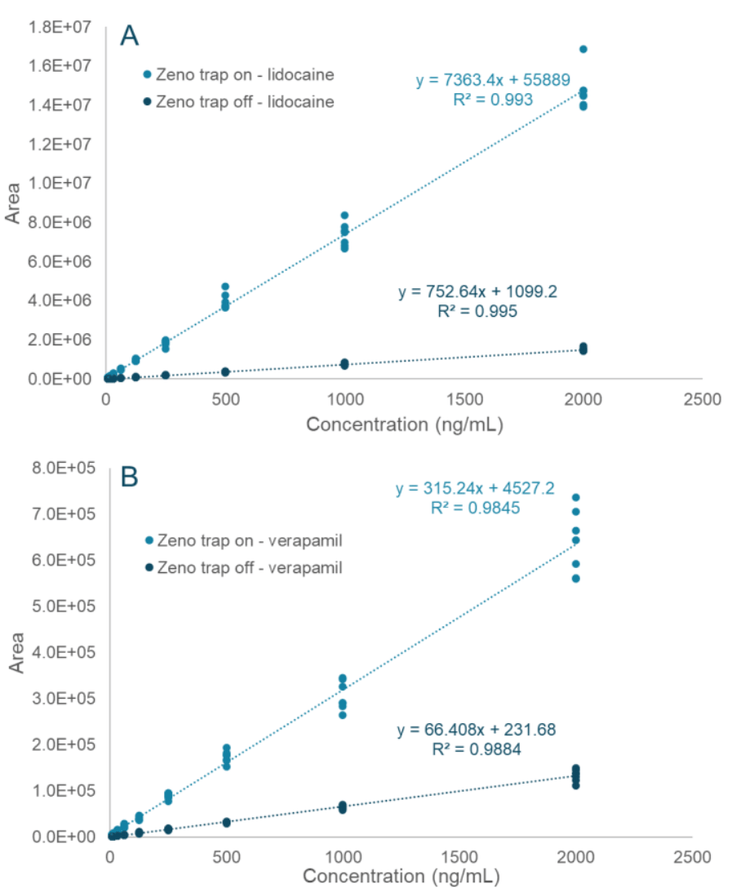
- Linearity was observed from 7.813 ng/mL to 2000 ng/mL when using the Zeno trap
- Analysis of 63 samples was completed in 2.6 minutes using the Zeno MRMHR scan
- A full TOF MS scan was performed and a wide range of product ions were analyzed for verapamil and lidocaine using the Zeno MRMHR scan
References
- Extending Metabolome Coverage. SCIEX technical note, RUOMKT-02-7169-A.
- Automated Targeted Screening of Hundreds of Metabolites. SCIEX technical note, RUO-MKT-02-2201-B.=
- Rolf Kern and Chang Liu. True high throughput bioanalysis using the Echo® MS System. SCIEX technical note, RUO-MKT02-11649-A.
- Rapid MS/MS analysis with Acoustic Ejection Mass Spectrometry (AEMS). SCIEX technical note, RUO-MKT-02- 11385-A.
- Highly sensitive quantification and selective identification of pesticides in food with Zeno MRMHR. SCIEX technical note, RUO-MKT-02-13902-C.