Abstract
X500R QTOF System equipped with the ExionLC system, SCIEX OS Software and MetabolitePilot Software 2.0 provides an integrated solution for routine, automated identification of drug impurities. High mass accuracy of the MS data enabled identification of impurities under basic and oxidative conditions through library matching.

Introduction
In order to increase the safety and efficacy of drug products, impurity profiling is routinely performed to identify and quantify any residual impurities. These impurities may result from the instability of drug substances or reaction with added excipients or packaging materials, or they may arise from starting and intermediate materials used in the manufacturing of active pharmaceutical ingredients (API). Since the amount of impurities will determine the safety and potency of the final product, a key challenge for drug development researchers is to identify, quantify, and control any impurities as early and efficiently as possible.
Because there can potentially be many impurities, some of which can be toxic and of low abundance, data processing can be onerous and time consuming if the software, and the quality and type of data itself, are not up to the task. Thus, an automated, high performance solution for detecting and identifying impurities is essential for relieving the burden and efficiently finding any stability or degradation issues.
In this study, the X500R QTOF System coupled to a ExionLC™ UPLC System with photodiode array detection (PDA), SCIEX OS Software Analytics, and MetabolitePilot™ Software 2.0 were used to measure stability and detect impurities in amiodarone samples. This integrated hardware and software solution compounds from MS and MS/MS data and reduces the need for manual review.
Key features of profiling workflow
- X500R QTOF System - high-resolution, accurate mass system
- Fast scan speeds and high sensitivity ensure even low-level impurities are identified.
- High resolution, accurate mass MS/MS data gives the highest confidence in compound identification
- SCIEX OS Software and MetabolitePilot Software
- Easy to learn and use, well integrated software simplifies the experience for new users
- Batch analysis ensures streamlined data processing
- Non-targeted peak detection starting from a defined structure narrows the field for compound identification
- Automated search for compound ID from various sources (e.g., Chemspider, NIST) provides flexibility
- ExionLC System with photodiode array (PDA)
- Optical data integrated into the MS data file in a single injection ensure key compounds aren’t missed
- UV with MS data are aligned to assign IDs to UV peaks
Methods
Sample preparation: Amiodarone and impurity standards were obtained from Sigma-Aldrich. Degradation studies were performed by incubating amiodarone (500 µg/mL) at room temperature under the following conditions:
- Oxidation – 1:1, acetonitrile : 30% H2O2
- Basic Hydrolysis – 1:1, acetonitrile : 1N NH4OH
- Acid Hydrolysis – 1:1, acetonitrile : 1N HCl
- Control – 1:1, acetonitrile : H2O
At 5-hour intervals, a 5 µL aliquot was injected for analysis.
Chromatography: A SCIEX ExionLC™ AD System equipped with a Phenomenex Luna Omega 1.6um C18 100A 100 x 2.1 mm column, held at 40 °C was used. Elution was performed using an isocratic gradient of 75%B at 0.20 mL/min. Buffer A – H2O, Buffer B – ACN 0.1% CH2O2
Mass spectrometry: A SCIEX X500R QTOF System controlled by SCIEX OS Software 1.3 was used. IDA Experimental conditions: threshold 100 cps, with DBS (Dynamic Background Subtraction) enabled; Top 5 ions. PDA conditions: 100 to 700 nm, 4.17 Hz
Data processing: Analytics module in SCIEX OS Software 1.3 was used for non-targeted identification and screening in addition to ChemSpider and NIST library search. MetabolitePilot Software 2.0 was used for confirmation of amiodarone oxidation product from MS/MS data.1

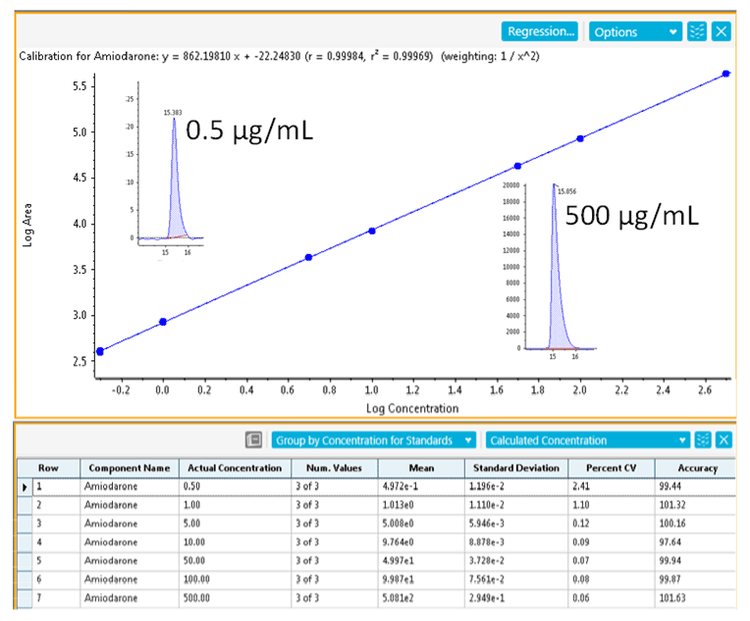
Identification and quantitation of amiodarone and impurity standards
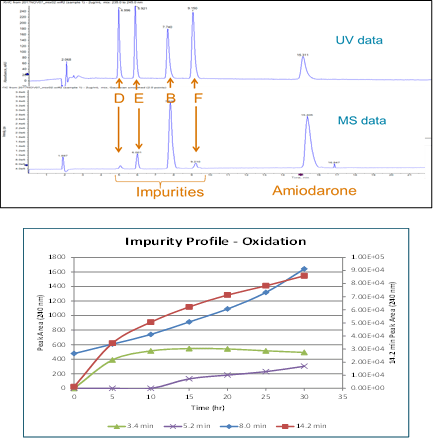
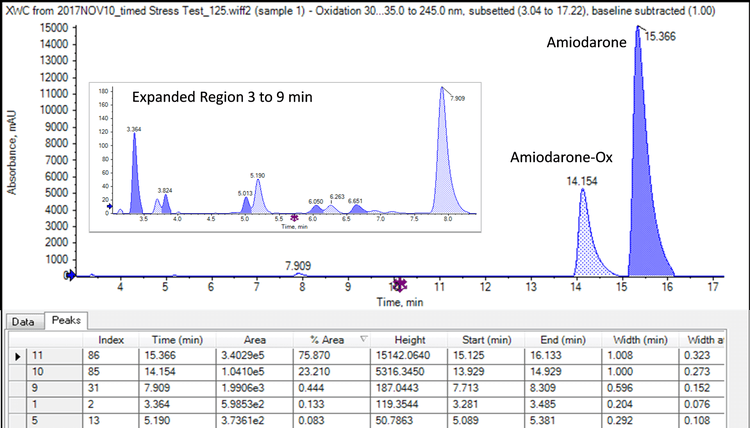
Amiodarone is an anti-arrhythmic medication used to treat and prevent a number of types of irregular heartbeats. Figure 1 (top) shows the UV (240 nm) and MS chromatograms of a mixture of amiodarone and the impurity standards B, D, E, and F (Figure 2). The MS and optical data are collected within a single injection and integrated into a single data file. This ensures that key compounds aren’t missed. Alignment of the UV with MS data enables assignment of ID’s to the UV peaks.
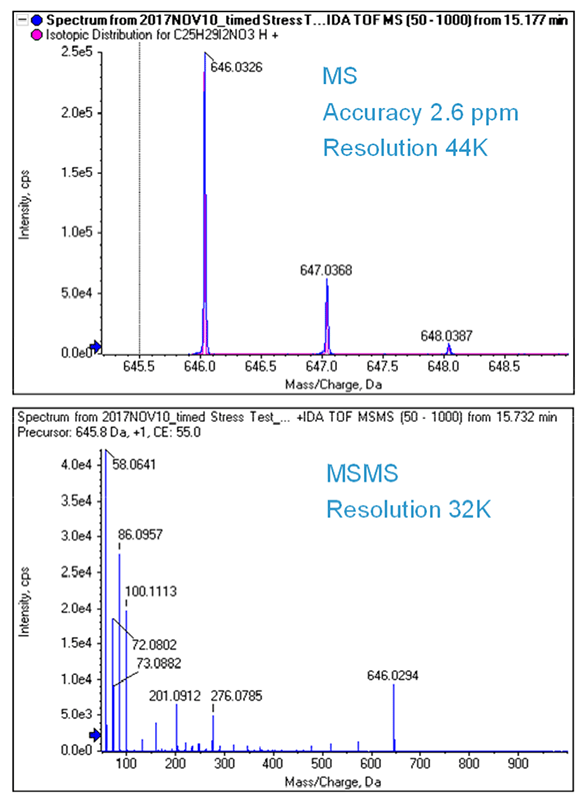
Figure 3 shows the TOF MS and MS/MS spectrum of amiodarone. Both were collected with >30K resolution and <3 ppm mass accuracy. The X500 QTOF system enables fast MS/MS data collection with high resolution especially at low m/z, and high mass accuracy, while still maintaining excellent sensitivity. The high resolution, accurate mass MS/MS data provide more confident compound ID while the fast scan speeds ensure nothing is missed. This high sensitivity, high quality data is obtained even for low abundant species. In this case, the peak purity of amiodarone was assessed using the TOF MS scans and found to contain only one mass matching the theoretical isotope pattern of amiodarone using SCIEX OS Analytics.
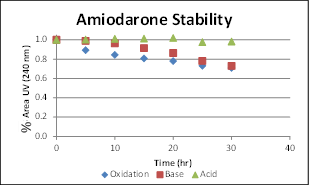
Stability profile of amiodarone under oxidative, basic, and acidic conditions
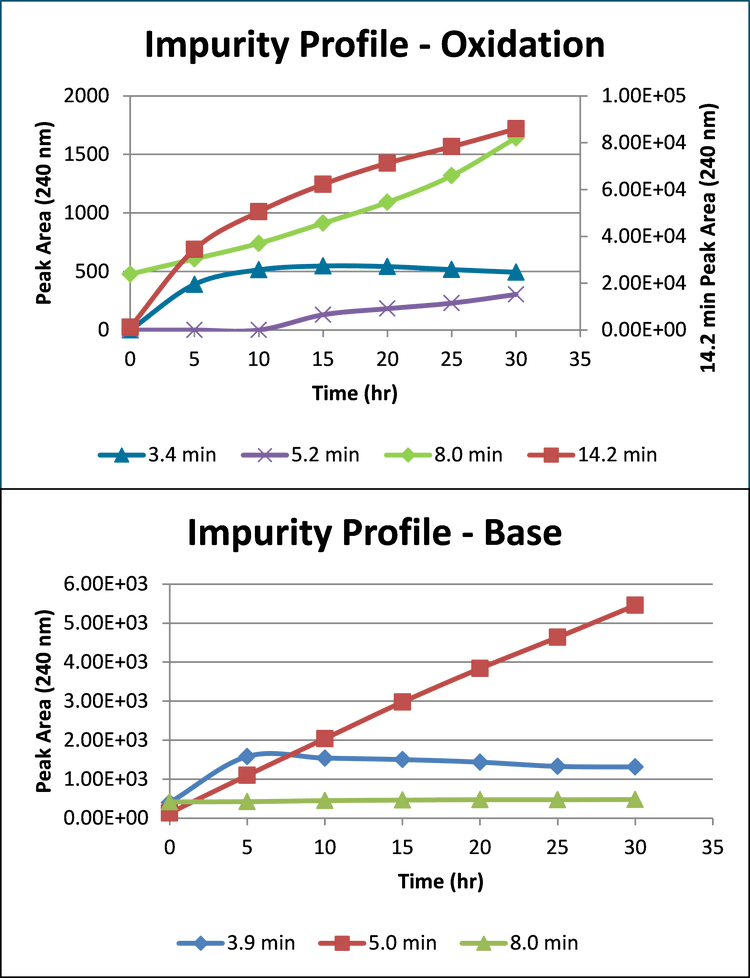
The stability of amiodarone under oxidative, basic, and acidic conditions was monitored by both UV and TOF MS over 30 hours. After 30 hours, 70% of amiodarone remained under oxidative conditions, 73% under basic conditions, and 98.5% under acidic conditions (Figure 5).
Identification of amiodarone impurities
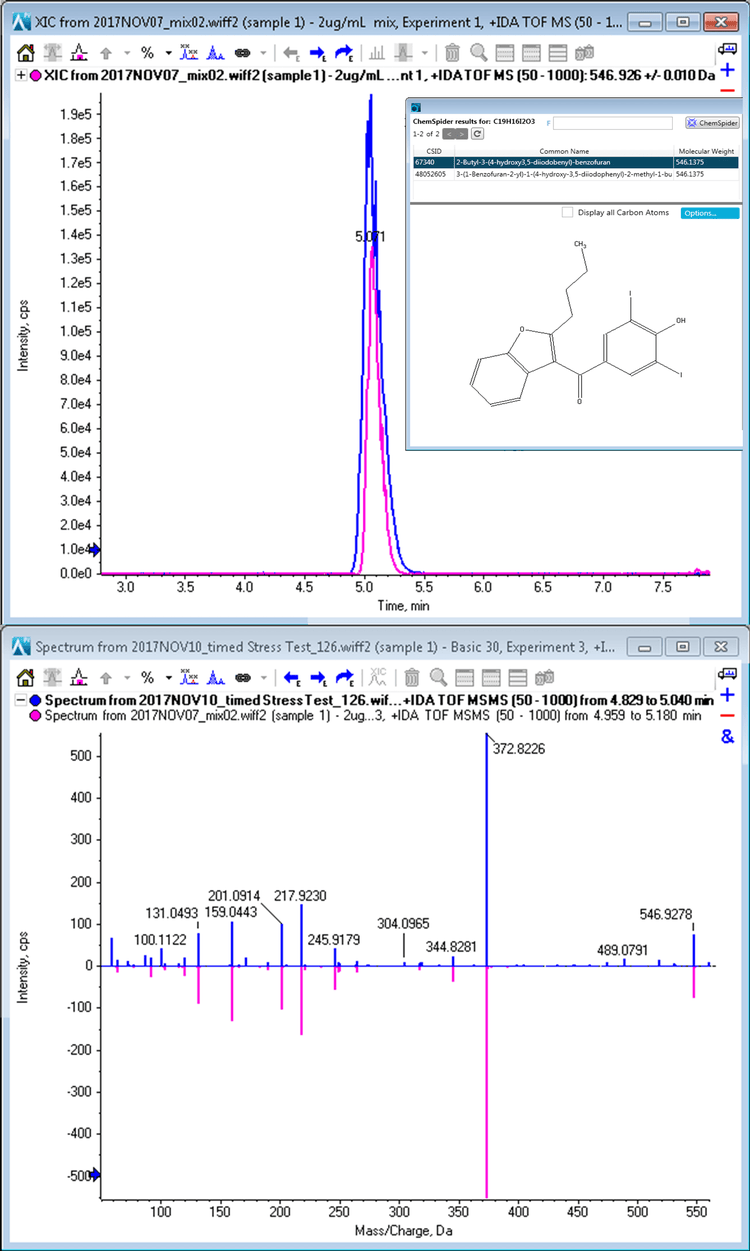
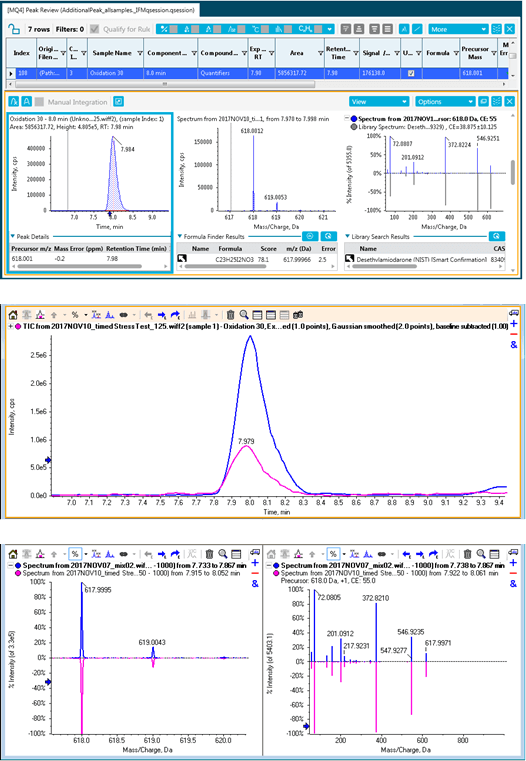
Once the reportable impurities were calculated several tools were used to determine their identity. SCIEX OS Software Analytics has both quantitative and qualitative (targeted and non-targeted screening) functionality built-in. The screening workflow can take advantage of library searching and includes a connection to ChemSpider for compound look-up. In addition to ChemSpider, the NIST library was searched. Matches were found for the 5.0 minute and 8.0-minute peaks from the basic incubations in the ChemSpider database and NIST library. The peaks were identified as amiodarone impurity D (Figure 8) and amiodarone impurity B (Figure 9). These were then confirmed by spiking with the authentic impurity standards.
MS/MS data for identification of amiodarone oxidation isomers
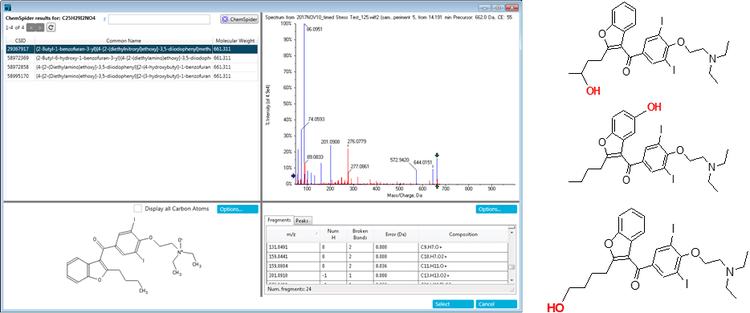
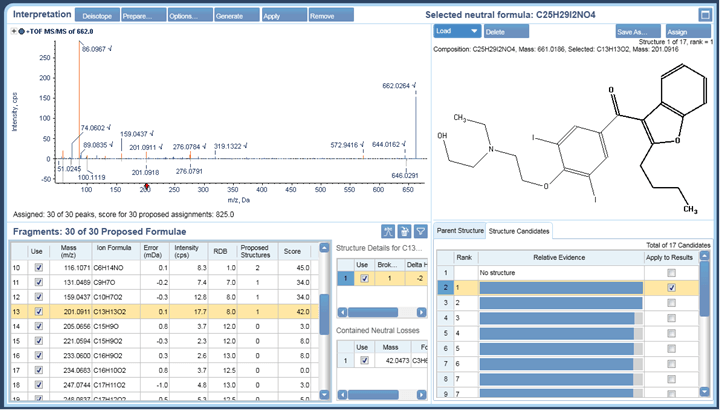
The peak at 14.2 minutes in the oxidation samples with m/z 662.0239 had four ChemSpider matches with identical chemical formulas and mass. Figure 10 shows the top hit and additional hits for this impurity. The four possibilities have unique sites of oxidation and the MS/MS information can be used to distinguish between them. To aid in the MS/MS interpretation MetabolitePilot Software 2.0 was used to process the data. MetabolitePilot Software has an automated structural proposal tool and features both targeted (for cleavages and transformations like oxidations) and untargeted peak finding capabilities.
Conclusions
The X500R QTOF System equipped with the ExionLC System, SCIEX OS System and MetabolitePilot Software 2.0 provides an integrated solution for the routine and automated identification of drug impurities. The speed of the data acquisition ensures nothing is missed, while the sensitivity, high resolution, and high mass accuracy in both MS and MS/MS mode provide high quality data critical for the definitive identification of impurities. In this study, Amiodarone was degraded under different stress conditions. The high mass accuracy of the MS data facilitated the straightforward identification of two known impurities (B and D) under basic and oxidative conditions through library matching, which were then confirmed with authentic standards. An oxidized metabolite of amiodarone was found, and four possible matches of identical mass were found in ChemSpider. Further analysis of the MS/MS data using MetabolitePilot Software 2.0 interpretation tools eliminated three of these possibilities and confirmed the site of oxidation on the N-diethyl moiety.
References
- MetabolitePilot Software 2.0. SCIEX technical note RUO-MKT-02-4989-A.