Abstract
While co-formulated drugs have been around for some time, the remarkable success of biologics has propelled co-formulated antibodies into the spotlight, especially following the COVID-19 pandemic.1
The effective combination of antibodies is a powerful strategy employed in various drugs, leveraging the synergistic properties of each component.
This technical note demonstrates a simple and reliable 7- minute (min) capillary zone electrophoresis (CZE) separation method for assessing the charge heterogeneity of co-formulated monoclonal antibodies (mAb), which could serve as a potential assay for lot release (Figure 1).
Key features of co-formulated monoclonal antibodies by CZE
- Fast separation method: A less than 7-min separation was achieved for charge heterogeneity of co-formulated antibodies
- Simple sample preparation - Antibody samples are diluted in water and injected without the need for buffer exchange
- Commercially pre-assembled cartridge: Consistent capillary length ensures reproducibility and comparability of data.
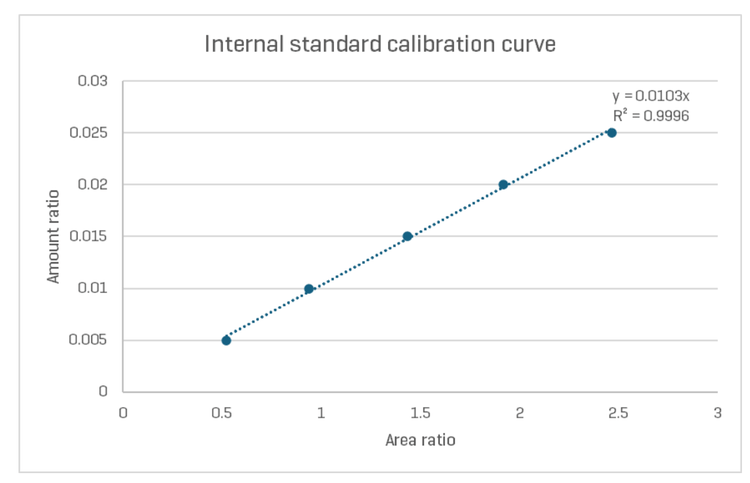
- Quantitative assay: good linearity of the calibration curve, with an R2 of 0.999
Introduction
Chromatography-based technologies, including size exclusion, ion exchange, and reversed-phase liquid chromatography, are invaluable for analyzing these complex mixtures.2 However, the characterization landscape is only complete with orthogonal techniques to charge heterogeneity such as capillary isoelectric focusing (cIEF) and CZE. CZE and cIEF are charge heterogeneity-based separation methods, sensitive enough to detect degradation and post-translational modifications. (PTMs).3
In a clinical setting, co-formulated antibodies provide several benefits, such as enhanced therapeutic efficacy through cooperative effects between multiple antibodies, improved patient convenience with fewer required treatments, reduced risk of dosing errors, and potentially better patient compliance than administering individual antibodies separately. From a regulatory perspective, co-formulated antibodies are classified as new drugs. Therefore, factors such as stability, protein interactions, protein concentrations, excipient types, and pH must be rigorously investigated.4
Examples of co-formulated therapies include polyvalent vaccines, such as the poliovirus vaccine, and combinations of fast- and intermediate-acting insulin.4
Therefore, a variety of analytical technologies are necessary to characterize these complex mixtures, including size exclusion chromatography (SEC), ion exchange chromatography (IEC), and dynamic light scattering (DLS). 4 Wang et al.5 reported that charge-based separations like cIEF and IEC are particularly useful due to their sensitivity to modifications such as protein interactions, pH, stability, etc.
However, cIEF sample preparation can be complex and challenging due to the numerous reagents required for preparation and separation, making it less desirable in a quality control setting. He et al.6 reported a simple yet robust CZE method for separating monoclonal antibodies, requiring minimal sample preparation. Moritz et al.7 published a landmark paper discussing an intercompany collaborative effort using CZE to analyze mAbs in detail. This study successfully demonstrated that the CZE for charge heterogeneity profiling of mAbs is precise, accurate, robust, linear, and sensitive across sites and users with no prior training on the application. Therefore, the straightforward implementation of this assay makes it ideal for a regulated GMP environment.
In this work, mAb reference standards from NIST and USP were used as surrogate molecules to emulate co-formulated antibody mixtures. The feasibility and quantitation of this assay were conducted using the CZE rapid charge variant analysis kit.
Methods
Samples: NISTmAb, Humanized IgG1k Monoclonal Antibody (P/N: 8671) was from NIST (Gaithersburg, MD). USP mAb 001, Monoclonal IgG1 (P/N 1445539) and USP mAb 002, Monoclonal IgG1 (P/N 1445547) were from USP, Frederick, MD. Before CZE analysis, these samples were diluted to 1mg/mL in water.
Reagents: The CZE Rapid Charge Variant Analysis kit (P/N: C44790) and cIEF Charge Heterogeneity analysis kit (P/NC30101) were from SCIEX (Framingham, MA).
Capillaries and capillary cartridges: The pre-assembled bare fused silica capillary cartridge (P/N A55625) for CZE experiments and the neutral capillary used in cIEF experiments (P/N 477441) were from SCIEX.
Capillary electrophoresis instrument: PA 800 plus system equipped with a UV detector was from SCIEX. Data acquisition for CZE and cIEF experiments was carried out at 214 nm and 280 nm, respectively.
Instrument methods: The CZE and cIEF methods used in this study were as described in the respective application guides.8,9
Software: 32 Karat software, Version 10, was the acquisition software, and data analysis was performed with the BioPhase software, version 1.2.
Results and discussion
CZE vs. cIEF
CZE is the simplest mode of capillary electrophoresis (CE) separation, where sample molecules are separated based on their size-to-charge ratio. Essentially, molecules with smaller hydrodynamic volumes and higher charges move faster under the applied electric field.10
In contrast, cIEF is a sophisticated, high-resolution separation mechanism where the protein molecules are separated based on their isoelectric point (pI)10. cIEF sample mixture is a complex combination of:
1. ampholytes - species that promote the separation based on pI
2. cathodic and anodic stabilizers – compounds that maintain the pH gradient stable inside the capillary
3. pI markers – to aid in the pI assignment
4. the protein of interest
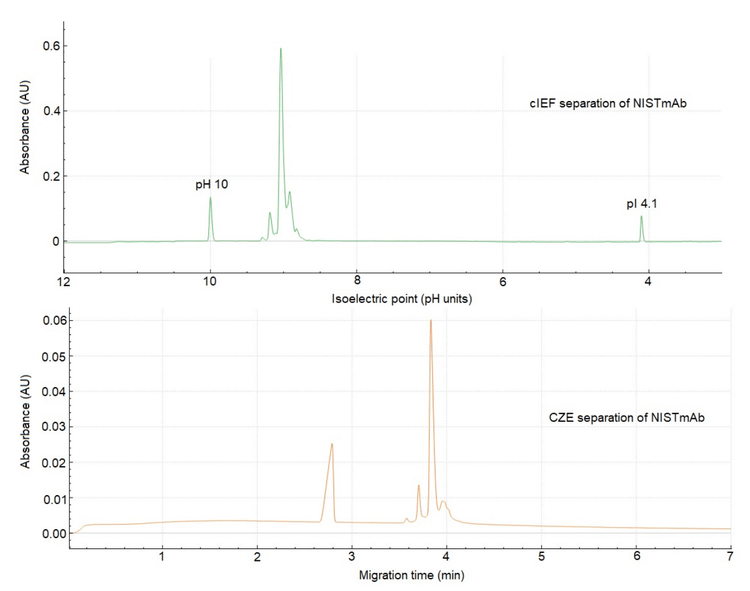
The CZE application for the separation of mAbs to elucidate their charge heterogeneity was developed by He et al., using a bare fused silica capillary. The buffer system consists of ε-aminocaproic acid (EACA) and triethylenetetramine (TETA). TETA, a polyamine, interacts with the negatively charged silica surface, thereby enhancing the resolution of basic variants.6,7 Figure 2 compares the CZE and cIEF separations of NISTmAb. Besides the inherent high-resolution capability of cIEF, the overall profiles of CZE and cIEF are comparable. Although CZE cannot determine pI information, it is equally sensitive to charge heterogeneity changes resulting from sample stability, PTMs, protein-to-protein interactions, to name a few. 6
Feasibility of CZE to characterize co-formulated antibodies
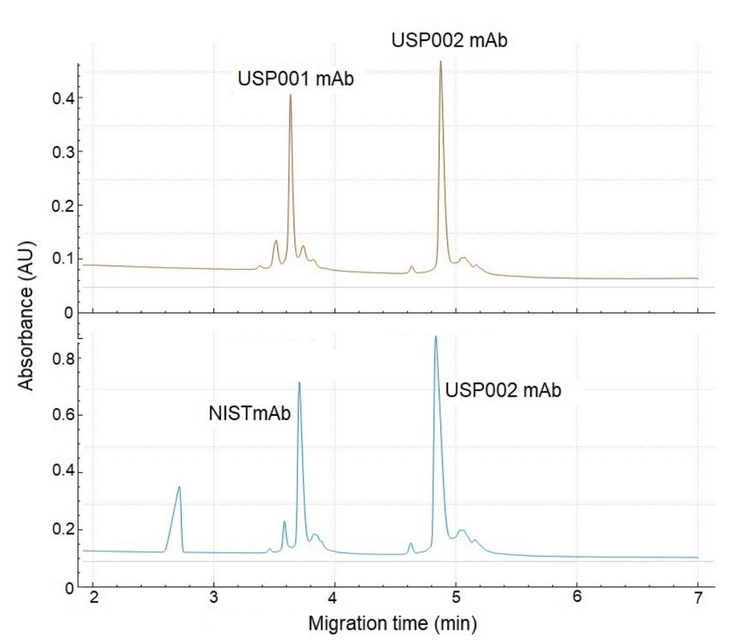
Figure 3 shows 2 electropherograms (e-grams). The top e-gram displays the CZE separation of USP001 and USP002, each at a concentration of 1µg/µL. Similarly, the bottom egram shows the profile separation of NISTmAb and USP002. These mixtures were specifically chosen because the pI of the mAbs (main peak) differ by approximately 1 pH unit. Therefore, Figure 3 demonstrates excellent separation between the 2 antibodies, indicating the suitability of CZE for assessing the charge heterogeneity of these co-formulated samples.
It is important to note that if the physicochemical properties of the antibodies are similar, such as having closely aligned pI values, the profiles will inevitably overlap. In such cases, the use of this assay is not recommended.
Linearity of the method
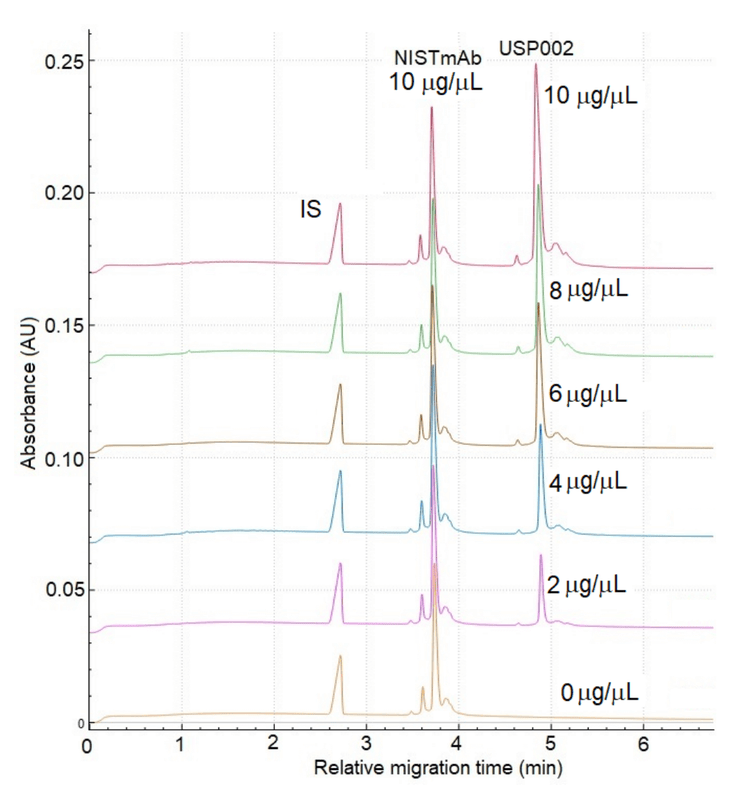
In antibody co-formulation, challenges include antibody interactions with excipients, stability in formulation buffer and pH, and concentration disparities between the antibodies. Figure 4 shows a stacked view of the NISTmAb and USP002 mAb to demonstrate the linearity of this assay when applied to the concentration disparity. In this experiment, the concentration of NISTmAb was kept constant at 1.0 µg/µL. Meanwhile, the concentration of USP002 increased from 0 to 1.0 µg/µL by increments of 0.2 µg/µL.
Typically, in capillary electrophoresis, to eliminate any variations from the sample injection, a calibration curve is done using an internal or external standard. The internal standard refers to a compound spiked into the sample at a known concentration. In this work, the internal standard (IS) is the peak migrating at approximately 2.7 min in the NISTmAb separation in Figure 3. This peak is attributed to L-histidine in the formulation buffer,11, at a concentration of 25 mM. Figure 4 shows the calibration curve with the amount ratio on the Y-axis and the area ratio on the X-axis. The amount ratio is calculated by dividing the amount of the compound of interest at various concentrations and the amount of the IS in µg/µL. Likewise, the X-axis is calculated by dividing the corrected peak areas (CPA) of the compound of interest at various concentration levels by the corrected peak area of the IS.
In this work, the corrected peak area for USP002mAb is the sum of the basic, main, and acidic variants. To validate the quantitative assay, a mixture of 1.0 μg/μL NISTmAb and 0.50 μg/μL USP002 was analysed using this assay.
The concentration of the USP002 mAb was calculated based on CPA, using the calibration curve shown in Figure 5, revealing a concentration of 0.51 μg/μL for USP002, demonstrating a recovery of 102%.
Overall, the CZE assay utilizing the SCIEX CZE rapid charge variant analysis kit shows potential as a lot-release assay for co-formulated mAbs, offering high-speed separation in 7 minutes, along with high resolution and quantitation capabilities.
Conclusions
-
A streamlined workflow with a simple sample preparation and fast separation was developed for charge heterogeneity analysis of co-formulated mAbs.
- Simple sample preparation: requires only sample dilution in water
- Fast separation: co-formulated antibodies can be separated by charge heterogeneity in less than 7 minutes
- Ease of use: A commercial kit combines chemistry and pre-assembled cartridge.
-
Quantitative assay: The assay demonstrated good linearity and provided accurate quantitation results.
References
- S. Liu, Y. Yan, C. M. Secor, Z. R. Oberholtzer, D. J. Skow, Mu. Sheikh, Y. Moon, Y. Fu, C. Sandu, S. Wang, N. Li, J. B. Nguyen, M. P. Rosconi & E. A. Pyles (2024) Enrichment strategy and initial characterization of heterodimers enriched from a co-formulated cocktail of therapeutic antibodies against SARS-COV-2, mAbs, 16:1, 2338301
- F. Kuhne, K. Heinrich, M. Winter, J. Fichtl, G. Hoffmann, F. Zähringer, K. Spitzauer, M. Meier, T. A. Khan, L. Bonnington, K. Wagner, J. O. Stracke, D. Reusch, H. Wegele, M. Mormann, and P. Bulau, (2023), Identification of Hetero-aggregates in Antibody Co-formulations by Multi-dimensional Liquid Chromatography Coupled to Mass Spectrometry, Anal. Chem. 95, 2203−2212
- M. Cao, N. De Mel, A. Shannon, M. Prophet, C. Wang, W. Xu, B. Niu, J. Kim, M. Albarghouthi, D. Liu, E. Meinke, S. Lin, X. Wang & J. Wang (2019) Charge variants characterization and release assay development for co-formulated antibodies as a combination therapy, mAbs, 11:3, 489-499.
- V. M. Chauhana, H. Zhang, P. A. Dalby, J. W. Aylotta, (2020) Advancements in the co-formulation of biologic therapeutics, Journal of controlled release Volume 327, Pages 397-405
- J. Kim, Y. J. Kim, M. Cao, N. De Mel, K. Miller, J. S. Bee, J. Wang, X. Wang and M. Albarghouthi (2020) Analytical characterization of coformulated antibodies as combination therapy, mAbs, 12:1, 1738691.
- Y. He, C. Isele, W. Hou, M. Ruesch, (2011) Rapid analysis of charge variants of monoclonal antibodies with capillary zone electrophoresis in dynamically coated fused-silica capillary, J Sep Sci. , 34(5):548-55.
- B. Moritz, V. Schnaible, S. Kiessig, A. Heyne, M. Wild, C. Finkler, S. Christians, K. Mueller, L. Zhang, K. Furuyad, M. Hassel, M. Hamm, R. Rustandi, Y. He, O. S. Solano, C. Whitmore, S. Ae. Park, D. Hansen, M. Santos, M. Lies, (2015) Evaluation of capillary zone electrophoresis for charge heterogeneity testing of monoclonal antibodies, Journal of Chromatography B, 983–984, 101-110.
- CZE rapid charge variant analysis kit for the PA 800 Plus Pharmaceutical Analysis System, application guide.
- Capillary isoelectric focusing (cIEF) kit for the PA 800 Plus Pharmaceutical Analysis System application guide.
- J. P. Landers, (1997), Handbook of capillary electrophoresis, second edition.
- A. Turner and J. Schiel (2018), Qualification of NISTmAb charge heterogeneity control assays, Analytical and Bioanalytical Chemistry, 410:2079–2093.