Abstract
This technical note introduces a new capillary electrophoresis sodium dodecyl sulfate (CE‐SDS) method on the BioPhase 8800 system, equivalent to the gold standard high‐speed (HS) method on the PA 800 Plus system. The new method enables a seamless method transfer from the PA 800 Plus system to the BioPhase 8800 system, offering higher throughput with 8 parallel capillaries(Figure 1).
The introduction of the PA 800 Plus system and the IgG Heterogeneity and Purity Assay has made the CE‐SDS method an essential analytical tool for characterizing therapeutic biomolecules. In the fast‐paced environment of process development and support, where thousands of samples are screened annually, there is a demand for quick, reliable sample analysis method that can be efficiently transferred throughout the pipeline. To support this demand for even higher throughput, the IgG HS method is easily transferrable from the PA 800 Plus system to the 8‐capillary BioPhase 8800 system.

Introduction
CE‐SDS is widely used in biotherapeutic analyses for lot release, stability testing, formulation‐buffer screening, process development, cell line development and product characterization. There are 2 versions of the CE‐SDS separation method available on the PA 800 Plus system: the IgG high‐ resolution (IgG HR) and IgG HS. The IgG HR method was created for the high resolution between the ng‐HC and the HC. Both methods have been adopted, validated, transferred and used in analytical development and quality control for numerous commercial molecules. However, only the IgG HR separation method was previously available on the BioPhase 8800 system. The IgG HS separation method on the PA 800 Plus system was created to reduce the total analysis time by 15 minutes, without compromising the data quality compared to the IgG HR method. The effective separation length is the fundamental difference between the IgG HR and HS methods. Effective length is the distance the molecule travels from introduction to detection. In the IgG HS method, the effective length is 10 cm. This distance is much shorter than the traditional IgG HR, where the effective length is 20 cm with a 30 – 40 min separation time. Consequently, the separation is considerably quicker.
This study proposes a new CE‐SDS‐based method for the BioPhase 8800 system that matches the performance of the IgG HS CE‐SDS method on the PA 800 Plus system.
Key features of the HS CE‐SDS method
- Seamless transition from the PA 800 plus system to the BioPhase 8800 system: By taking advantage of the flexibility of the hardware settings on BioPhase software, an equivalent IgG HS CE-SDS method was developed
- Same outstanding performance: Consistency between runs and cartridges demonstrates the method's reproducibility. Inter‐capillary reproducibility over 96 samples is <5% for light chain (LC), glycosylated (HC) and non‐glycosylated heavy chains (ng‐HC).
- Similar migration time as original PA 800 Plus method: Migration time of the 10 kDa marker on the BioPhase 8800 system high‐speed method is within 1 minute (min) window compared to the migration time on the PA 800 Plus system.
- The MW estimation for lysozyme and carbonic andrydrase was better than 16%.
Methods
Samples: USP mAb 002, Monoclonal IgG1 ‐ United States Pharmacopeia (USP) Reference Standard (P/N: 1445547‐2MG) was from USP (Rockville, MD). NISTmAb, Humanized IgG1k Monoclonal Antibody (P/N: 8671) was from NIST (Gaithersburg, MD). IgG control standard (P/N: 391734) was from SCIEX (Framingham, MA).
Reagents: The BioPhase CE‐SDS Protein Analysis Kit (P/N: C30085) was from SCIEX. The β‐mercaptoethanol (β ‐ME) (P/N: M3148‐25ML) and iodoacetamide (IAM) (P/N: I6125) were from Sigma‐Aldrich (St. Louis, MO).
Capillary cartridges: For the BioPhase 8800 system, the CE‐SDS analysis was performed using a BFS capillary cartridge – 8 x 30 cm (P/N: 5080121) from SCIEX. For the PA 800 Plus system, the CE‐SDS analysis was performed using a BFS pre‐assembled capillary cartridge (P/N: A55625) from SCIEX.
Capillary electrophoresis instrument and consumables: The BioPhase 8800 system (P/N: 5083590F) and a starter kit of 4 sample plates, 4 reagent plates and 8 outlet plates (P/N: 5080311) were from SCIEX. CE‐SDS analysis was performed using UV detection at 220 nm.
The PA 800 Plus system (P/N: A51963AE) was equipped with a PDA detector. The detection wavelength was 220 nm.
Instrument methods: On the PA 800 Plus system, the capillary conditioning method comprises 0.1M NaOH rinse at 20 psi for 10 min, 0.1M HCl rinse at 20 psi for 5 min, ddi H2O rinse at 20 psi for 2 min,SDS‐MW gel buffer rinse for 10 min at 70 psi and a voltage separation at 15 kV for 10 min. The separation method consists of 0.1M NaOH rinse at 70 psi for 3 min, 0.1M HCl rinse at 70 psi for 1 min, ddi H2O rinse at 70 psi for 1 min and SDS‐ MW gel buffer rinse for 10 min at 70 psi, 2 water dips, an injection at 5 kV for 20 seconds, and the separation at 15 kV for 20 min
The separation method used on the BioPhase 8800 system is shown in Figure 2.

Software: BioPhase software, version 1.2 e‐license, was used to create methods and sequences for data acquisition and data analysis on the BioPhase 8800 system. The 32 Karat (version 10.1) software package was used for data acquisition and processing.
Sample preparation for CE‐SDS analysis under reducing and non‐reducing conditions: The USP mA 2 IgG sample was used without any previous treatment. 10 μL of the USP mAb 2 IgG sample was mixed with 2 μL of 10 kDa marker, 83 μL of SDS sample buffer pH 9 and 5 μL of β ‐ME or 250mM IAM for reduced and non‐reduced conditions, respectively. Then, the mixture was heat‐denatured at 70o C for 10 min before CE analysis.
Results and discussion
Selecting 10 kDa as the internal mobility marker and defining a migration time window for 10 kDa
In CE, using an internal mobility marker is crucial. This is due to the consistent relative position between the marker and the sample peaks, which guarantees reproducibility for different runs, capillaries, chemistry lots, instruments and users.
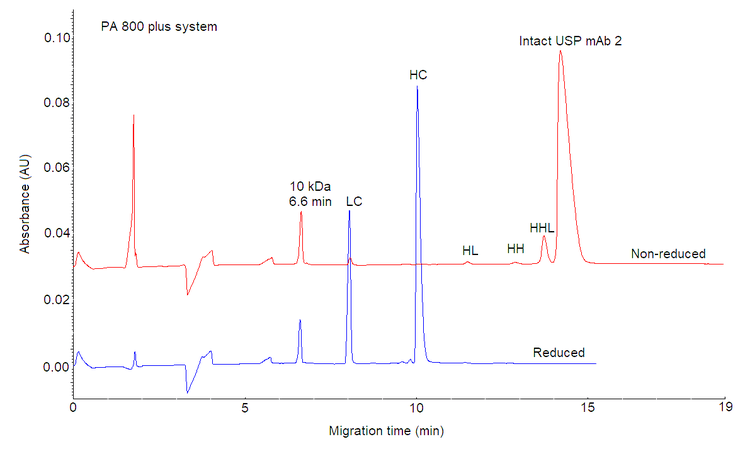
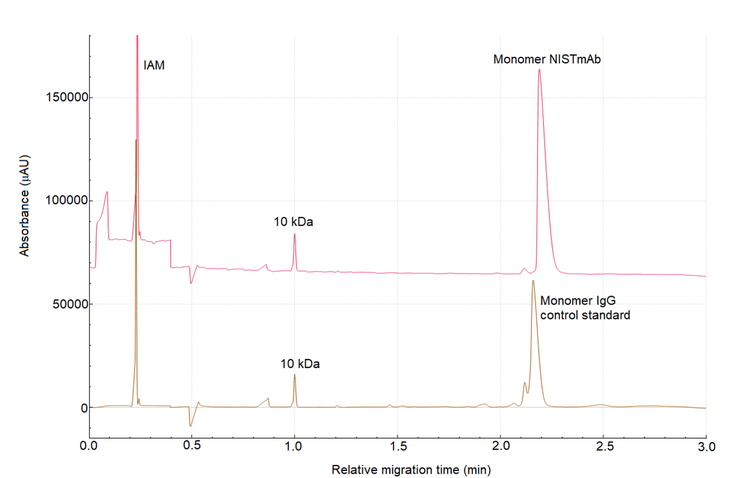
The first step in developing the method was to set a migration time requirement. Although, any peak could be used as a marker, the migration time for a mAb molecule peak under reduced or non‐reduced conditions can vary due to differences in the antibody hydrodynamic size and primary sequence. These differences can affect the hydrophobicity of the mAb. Consequently, using a mAb peak as a reference can impact assay accuracy and reproducibility, as it may change from molecule to molecule, making the method non‐viable as a plaƞorm method.1 Figure 3 illustrates the difference between the migration time of the monomer peak for NISTmAb and SCIEX's IgG control standard mAbs. Defining a migration time window for the 10 kDa internal marker is more reliable than using a mAb peak, as this molecule exhibits a consistent migration pattern regardless of the antibody sample and the sample preparation conditions (reducing and non‐reducing). Figure 1 shows that the migration time of the 10 kDa internal marker using the IgG HS method was around 6.6 minutes on the PA 800 Plus system under reducing and non‐reducing conditions. Therefore, the 10 kDa molecule was used as a marker to investigate other instrument seƫngs in this study. Arbitrarily, a requirement for the migration time of the 10 kDa on the BioPhase 8800 system was set at 6.6? +/‐ 1 min. Migration time of 10 kDa marker on the BioPhase 8800 system using the HS CE‐SDS method was within 1 min window compared to the migration time on the PA 800 Plus system, demonstrating excellent data consistency between the two systems.
Investigating the separation temperature and electric field strength
It is well known that 3 main factors can impact the separation time: capillary length, electric field (voltage), and separation temperature.2
On the BioPhase 8800 system, the total capillary length is fixed at 30 cm with 20 cm of effective length. Thus, the electric field and separation temperature are the only variables that can be adjusted in a method.
Figure 4 shows the separation of reduced USP mAb 002 under various voltages and temperature conditions.
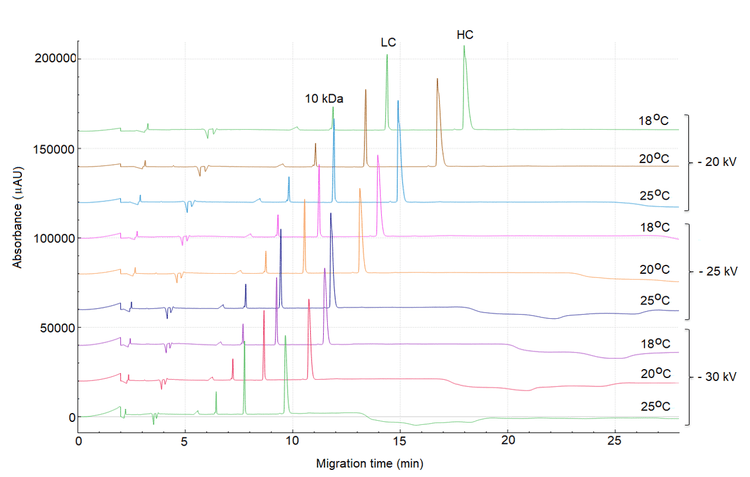
As expected, the higher the electric field and temperature, the faster the migration time. However, as the peaks of interest migrated faster, the baseline fluctuation from the separation gel buffer became more significant and could potentially interfere with peak integration. The background signal from the separation gel buffer was influenced by temperature and electric field. Figure 4 shows that the baseline noise was less significant at lower temperatures, i.e., 18°C, even at higher electric fields.
Even though the baseline interference was mitigated at 18o C, the migration time of the 10 kDa marker at the highest electric field (‐30 kV) was 7.69 min, which falls outside the target range of 6.5 +/‐ 1 min. Therefore, further method optimization was carried out as described below.
Optimizing separation ramp time
Another method setting that is often overlooked is the ramp time. Ramp time is when the instrument’s high voltage power supply goes from 0 kV to the set separation voltage. The ramp time setting is crucial because it directly impacts the reproducibility of the separation. When the voltage is applied, the electrode generates a sudden heat wave that propagates to the surrounding areas, affecting the capillary.3‐4 The temperature gradient may induce dispersion and reduce separation efficiency. However, theoretical models of the thermal gradient, as explained by Guiochon et al.,5 indicate that this effect is negligible for capillaries with an inner diameter of 100 um. The inner diameter of the capillary used in this application was only 50 um.
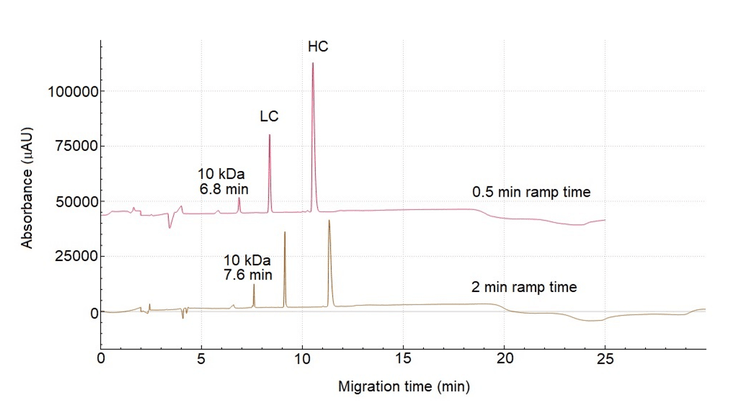
Typically, in CE‐SDS‐based separation, the BioPhase 8800 and PA 800 Plus systems have a pre‐set ramp time of 2 minutes. Figure 5 shows the influence of the ramp time on the separation of USP mAb 002 under reducing conditions. In the lower trace with a ramp time of 2 min, the 10 kDa marker migrated at 7.6 min. The upper trace shows a separation using a ramp time of 0.5 min, where the 10 kDa marker migrated at 6.8 min, which falls within the required migration time window. Therefore, 0.5 min was selected as the optimal ramp time. The final optimized HS CE‐SDS method comprised an 18°C separation temperature and a‐30 kV separation voltage with 0.5 min ramp time.
Reproducibility of the method
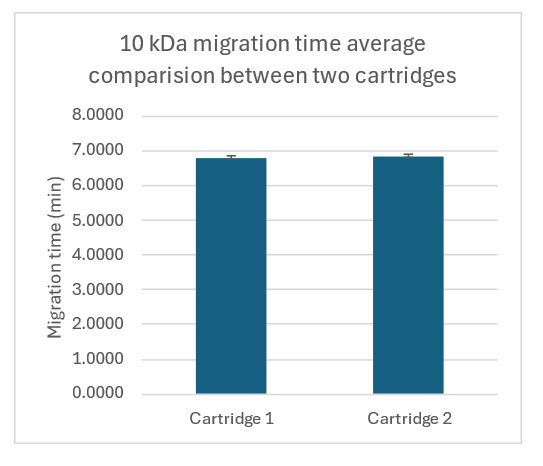
To ensure the decrease in ramp time did not compromise the method's reproducibility, a discrete precision study was conducted using 2 cartridges. Figure 6 shows the average migration time values for the 10 kDa marker obtained from 2 cartridges. The error bar is the standard deviation from 96 separations per cartridge. The RSD for the 10 kDa migration time with both cartridges was better than 1.6%, demonstrating excellent assay reproducibility.
This method was also tested with the intact USP mAb under non‐reducing conditions, and the CPA %RSD was 4.3%, indicating high assay reproducibility.
Molecular weight estimation
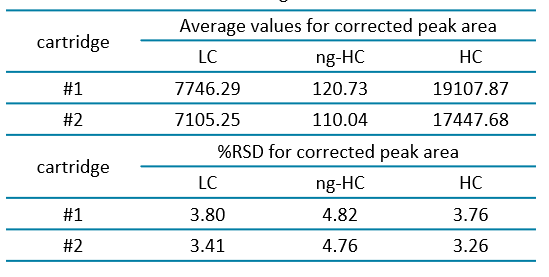
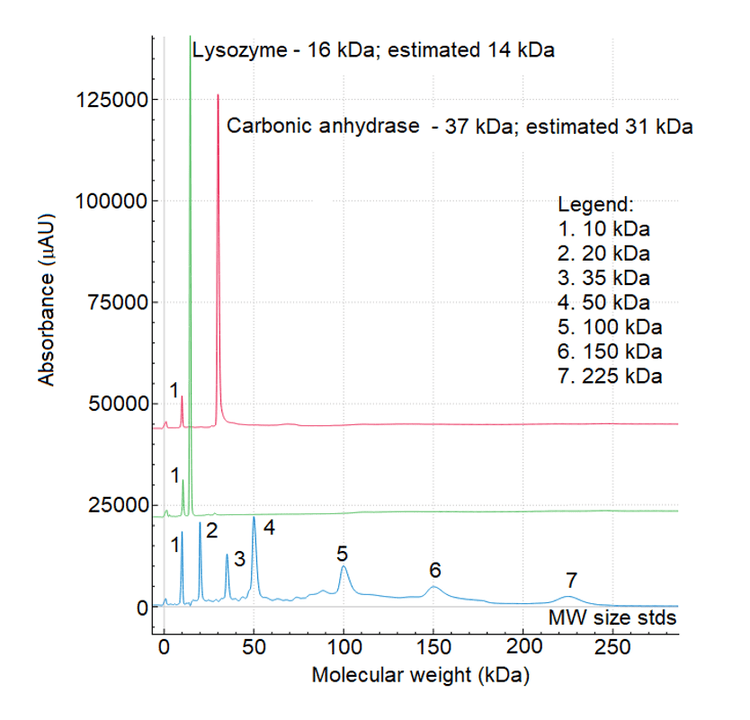
A simple experiment was conducted to estimate the molecular weight of carbonic anhydrase and lysozyme, aiming to determine whether the change in separation temperature adversely affected the estimation. Figure 7 shows an overlay of the molecular weight size standards (bottom, blue trace), lysozyme (middle, green trace) and carbonic anhydrase (top, red trace). The X‐axis represents the molecular weight, while the Y‐axis shows absorbance units.Table 1 presents the Figure 5: Overlay of electropherograms obtained with NISTmAb and USP mAb002 under non‐reducing conditions using the IgG standard method from PA 800 Plus system ( ‐30 kV/18o C). Figure 6: Average migration time values for the 10 kDa marker obtained from 2 cartridges with 96 samples per cartridge. 5 corrected peak area average and the percentage of relative standard deviation for the LC, HC and ng‐HC of the USP mAb 002 reference standard under reducing conditions. The consistency of these values, with a %RSD of less than 5% for both cartridges demonstrates the excellent reproducibility of the method.
Conclusions
- Seamless transfer of the HS CE SDS method from the PA 800 Plus system to the BioPhase 8800 system with a higher throughput was accomplished
- Accurate molecular weight estimation with accuracy better than 16% was achieved
- Excellent assay reproducibility was demonstrated with %RSD of CPA < 5%
- A successful method transfer was achieved using 18 o C for separation temperature and 30 kV for separation voltage with a 0.5 min for ramp time
References
- Nunnally B. et al. A series of collaborations between various pharmaceutical companies and regulatory authorities concerning the analysis of biomolecules using capillary electrophoresis. Chromatographia 2006 64:359 ‐ 368.
- Noblitt SD andHenry CS. Overcoming challenges in using microchip electrophoresis for extended monitoring applications; Capillary electrophoresis and microchip capillary electrophoresis: principles, applications, and limitations. 2013
- Palonen S et al.Effect of initial voltage ramp on separation efficiency in non‐aqueous capillary electrophoresis with ethanol as background electrolyte solvent. J. Chrom A 2005 1068 (1):107‐114.
- Xuan X et al.Joule heating effects on separation efficiency in capillary zone electrophoresis with an initial voltage ramp. Electrophoresis 2006 27: 3171– 3180.
- Dose EV and Guiochon G Timescales of transient processes in capillary electrophoresis. J. Chrom. A 1993 652(1):263‐275.
- UniProt: the universal protein knowledgebase