Abstract
This technical note demonstrates the performance of the ZenoTOF 8600 system, particularly the electron activated dissociation (EAD) fragmentation technique, in the deep characterization of human erythropoietin (EPO). Accurate mass measurement and sequence analysis of intact EPO and its O‑glycoforms were achieved using intact MS and top-down MS/MS. The complex N‑and O‑glycosylation in EPO was confidently identified and localized using an EAD-based peptide mapping workflow (Figure 1).
Human EPO is a key glycoprotein hormone that regulates erythropoiesis in the human body. Insufficient EPO production can lead to severe anemia. Recombinant human EPO (rhEPO) is a widely used biotherapeutic for the treatment of anemia. The glycan structures of rhEPO directly influence in vivo half‑life, stability, immunogenicity, receptor binding affinity, and biological activity. Therefore, comprehensive characterization of EPO and its glycoforms is important for rhEPO development and quality control. However, as a labile post-translational modification (PTM), glycosylation poses an analytical challenge to traditional collision-based MS/MS approaches, such as collision-induced dissociation (CID). These techniques preferentially cleave glycosylation, resulting in the loss of site-specific information.
In contrast, EAD offered by the ZenoTOF 8600 system allows sensitive detection, confident identification, and unambiguous localization of N- and O-glycosylation, providing single-platform analytical support for in‑depth structural elucidation of complex biotherapeutics.1-5
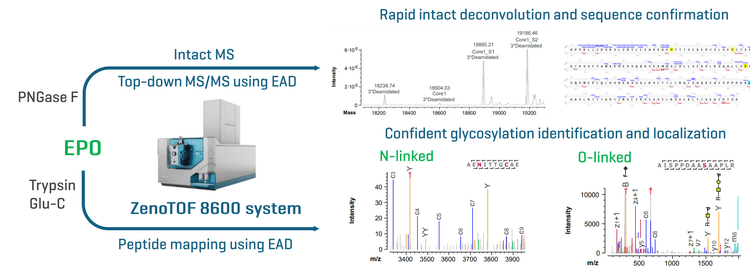
Key features of the ZenoTOF 8600 system for comprehensive EPO characterization
- Multi‑level characterization on a single platform: The system offers enhanced intact MS, top‑down MS/MS, and peptide mapping workflows, enabling accurate mass measurement, rapid sequence confirmation, and in-depth PTM characterization.
- Advanced EAD fragmentation for PTM localization: EAD technology provides extensive backbone fragmentation while preserving labile PTMs, allowing confident identification and accurate localization of complex N‑ and O‑glycosylation.
- Intuitive data analysis workflows: Biologics Explorer software enables transparent, optimized, and multi‑level characterization of biotherapeutics, from intact mass to site‑specific PTM analysis.
Introduction
The rhEPO, widely used to treat anemia , contains multiple N- and O- glycosylation sites.7 The glycan composition of rhEPO critically influences its pharmacokinetics and biological activity. To overcome its relatively short in vivo half-life, glycoengineering approaches have introduced additional N-glycosylation sites, leading to long-acting EPO analogs with enhanced stability and sialylation. Traditional collision-based MS/MS approaches, such as CID, when applied to glycopeptides, result in the loss of labile glycan moieties. Hence, accurate determination of glycosylation sites using CID is extremely challenging, particularly for O-glycosylatio n without a consensus se quence. Compared to CID, EAD is superior for glycopeptide analysis given its ability to preserve the glycan structures in the fragments. In this work, a comprehensive characterization of EPO was performed using the ZenoTOF 8600 system. This work demonstrates a powerful analytical strategy for the in‑depth characterization of complex glycoprotein therapeutics and provides valuable support for biopharmaceutical development and quality control.
Methods
Sample preparation: The sample analyzed in this study was human erythropoietin (EPO) European Pharmacopoeia reference standard ( Catalog Code: Y0001725).
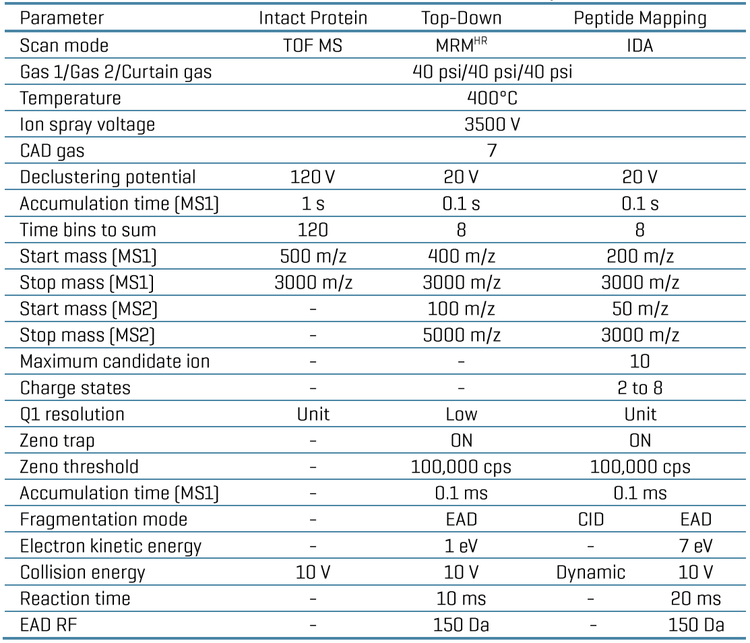
For intact protein analysis, N‑glycans were enzymatically removed using Rapid PNGase F (non‑reducing format) (New England Biolabs, P0711). 10 μg of EPO was mixed with 2 μL of 5× Rapid PNGase F Reaction Buffer and adjusted to a final volume of 10 μL. The mixture was incubated at 75 °C for 5 min for protein denaturation, followed by the addition of 1 μL of Rapid PNGase F. The reaction mixture was subsequently incubated at 50 °C for 10 min to achieve complete N‑glycan removal. After deglycosylation, 40 ng of the treated protein was injected for intact protein analysis. For peptide mapping analysis, EPO sample was denatured with 7M guanidine hydrochloride, followed by reduction using dithiothreitol and alkylation with iodoacetamide. The digestion was performed using the trypsin/ Glu-C protease (Promega). 1 μg of the final digest was injected for LC-MS analyses.
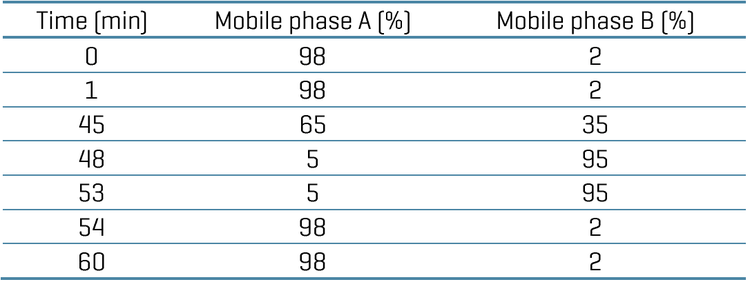
Liquid chromatography: The ExionLC AE system (SCIEX) was used for chromatographic separation. Mobile phase A was 0.1% formic acid (FA) in water and mobile phase B was 0.1% FA in acetonitrile. The column oven temperature was set to 40°C. For intact protein analysis, separation was achieved using a Waters ACQUITY UPLC Protein BEH SEC column (200 Å pore size, 1.7 μm particle size, 4.6 mm × 150 mm). An isocratic elution was applied with 35% solvent B at a flow rate of 0.22 mL/min. For peptide mapping analysis, chromatographic separation was performed on a Waters ACQUITY UPLC Peptide CSH C18 column (130 Å, 1.7μm, 2.1 mm × 150 mm), at a flow rate of 0.20 mL/min. The LC gradient used for peptide separation is provided in Table 1.
Intact protein analysis
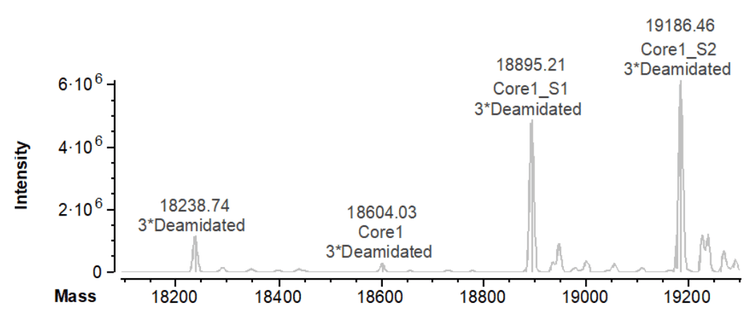
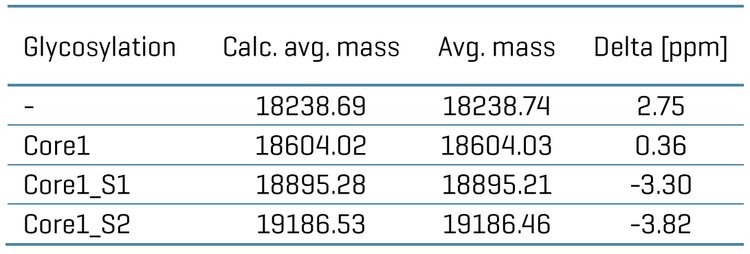
Human EPO contains 3 N- and 1 O-glycosylation.3,6 To reduce protein heterogeneity arising from N-linked glycosylation, the N-glycans were enzymatically removed using PNGase F, followed by intact mass analysis. Figure 2 shows the intact deconvolution spectrum of the N-deglycosylated EPO. The measured intact masses of the deglycosylated EPO are in excellent agreement with theoretical values (Table 3). The detection of 3 deamidations indicates the complete removal of 3 N-glycosylation in EPO (Figure 2). Three O-glycan structures, including Core1, Core1_S1, and Core1_S2, were identified at the intact protein level. The differences between the measured average masses (avg. mass) and the calculated values (calc. avg. mass) were all within 5 ppm (Table 3), demonstrating high mass accuracy of the analysis. Based on the deconvolution result, the relative abundance of the O-glycoforms follows the order Core1_S2 > Core1_S1 > Core1, with Core1_S2 being the most predominant O-glycan species in EPO (Figure 2).
Top-down characterization of EPO
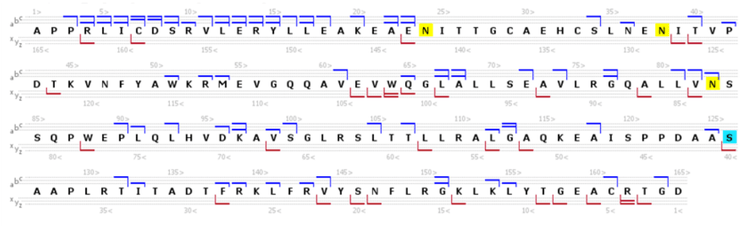
Intact mass analysis enables accurate mass measurement of intact EPO and its glycoforms; however, it does not allow sequence analysis and PTM localization. Top‑down MS/MS analysis enables protein sequence analysis at the intact level without enzymatic digestion, providing rapid characterization of protein sequence and modifications. In this study, top‑down analysis using EAD was performed on the N‑deglycosylated EPO. The resulting MS/MS data yielded a sequence coverage of ~50%, as shown in Figure 3, demonstrating effective backbone fragmentation and sequence analysis at the intact protein level.
Peptide mapping analysis of EPO
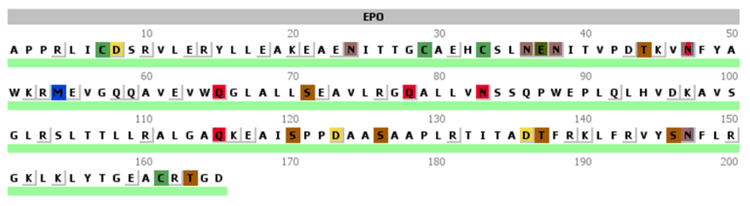
Peptide mapping analysis was performed on the ZenoTOF 8600 system using DDA methods with EAD and CID, respectively. The EAD-based peptide mapping workflow provided 100% sequence coverage of EPO in a single injection (Figure 4), demonstrating the high efficiency and comprehensive sequence characterization capability of this workflow.
N‑linked glycosylation
EPO contains 3 N‑linked glycosylation sites (N24, N38, and N83), each of which is occupied by diverse glycan structures.3,6 In addition, certain glycans undergo O‑acetylation or O‑methylation, contributing to protein stability in circulation. The presence of multiple glycosylation sites, heterogeneous glycoforms, and secondary glycan modifications substantially increases the molecular complexity of EPO, thereby posing significant challenges for accurate glycan characterization and site‑specific localization.
While traditional CID technique leads to preferential cleavage of labile glycosylation, the alternative EAD fragmentation offered by the ZenoTOF 8600 system enables the generation of fragment ions that retain intact glycan structures , allowing accurate localization of this labile PTM. When combined with fragment ion signal enhancement via the Zeno trap, high‑quality MS/MS spectra are obtained, allowing confident glycopeptide identification. Furthermore, Biologics Explorer software provides an integrated N‑glycan database and supports searches for O‑acetylation and O‑methylation modifications on glycans, facilitating accurate localization and assignment of N‑linked glycosylation.
Figure 5 shows the CID and EAD MS/MS spectra of the glycopeptide AENITTGCAE. Under CID fragmentation, extensive glycan fragmentation was observed, resulting in dominant glycan‑derived oxonium ions at low m/z, while peptide backbone fragmentation was limited, preventing confident site‑specific glycosylation assignment. In contrast, EAD fragmentation produced extensive backbone coverage, generating c3–c9 and z8+1 ions that retained intact N‑glycan structures, enabling confident identification and localization of the glycan structure A3G3F1S3.
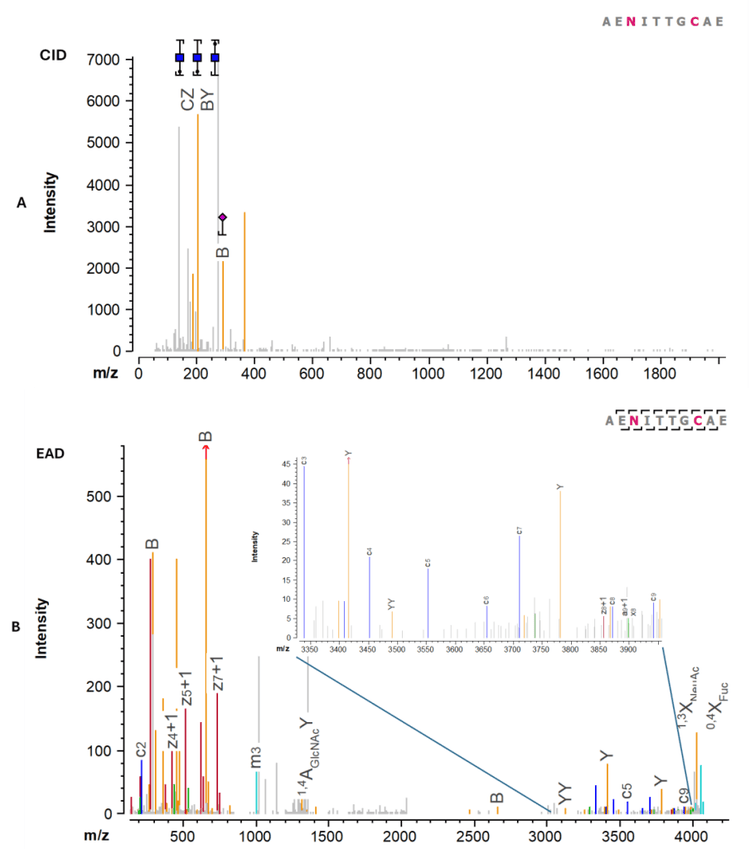
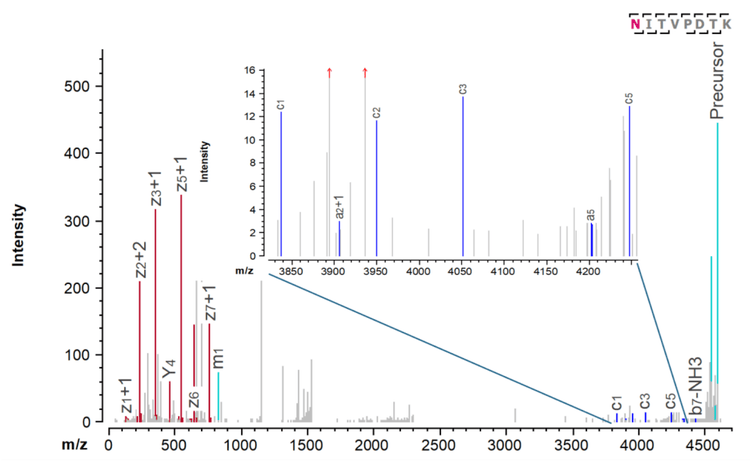
Figure 6 shows the EAD spectrum of the N38-glycosylated peptide NITVPDTK. Under EAD fragmentation, the glycopeptide NITVPDTK yielded glycan-containing c1–c3 and c5 ions, enabling confident identification and localization of the complex glycan structure A4G4F1S4_OAc1 with 1 O‑acetylation (OAc).
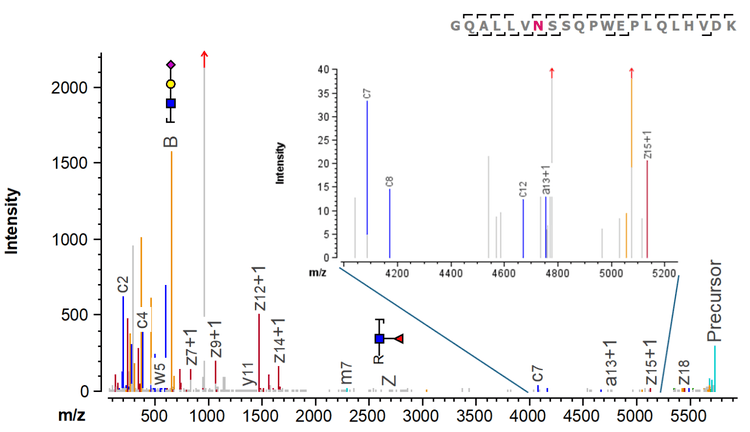
Figure 7 shows the MS/MS spectrum of the N83-containing glycopeptide GQALLVNSSQPWEPLQLHVDK. EAD preserved the glycan structure A4G4F1S3 in the fragment ions, such as c7, c8, c12, and z15+1 ions (inset of Figure 7), allowing accurate localization of this glycan to N83.
O‑linked glycosylation
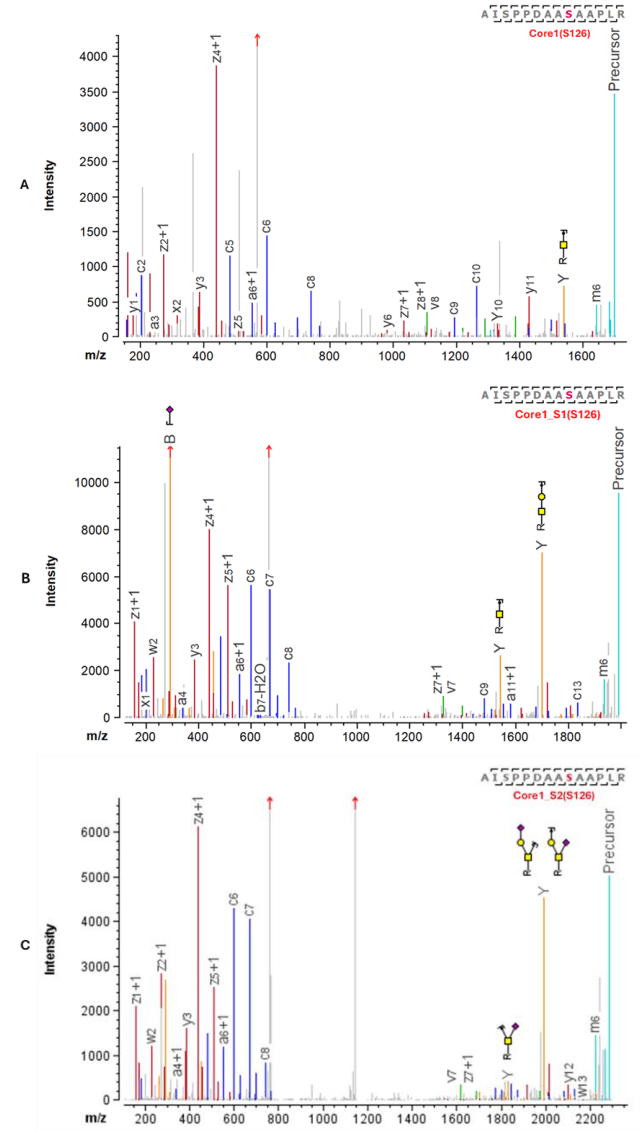
In addition to 3 N‑linked glycosylation described above, EPO contains a single O‑linked glycosylation site at S126. Biologics Explorer software includes a comprehensive O‑glycan library, enabling rapid and accurate localization of O‑linked glycosylation. As shown in Figure 8, the glycopeptide AISPPDAASAAPLR contains 2 potential O‑glycosylation sites, S120 and S126. Following EAD fragmentation, high‑quality MS/MS spectra were obtained, providing extensive coverage of c‑ and z‑type fragment ions. The resulting fragmentation pattern offered clear evidence for site‑specific localization. All 3 O‑glycan structures, Core1, Core1_S1, and Core1_S2, are exclusively attached to S126, while no O‑glycosylation at S120 was observed.
Conclusions
- In-depth characterization of EPO was achieved using orthogonal intact MS, top-down MS/MS, and peptide mapping techniques.
- Top‑down analysis using EAD achieved ~50% sequence coverage for rapid sequence confirmation.
- Single‑injection EAD-based peptide mapping workflow enabled 100% sequence coverage for sequence analysis of EPO.
- The ability of EAD to preserve labile PTMs enabled accurate localization of 3 N‑linked and 1 O‑linked glycosylation in EPO.
- Intuitive Biologics Explorer software with embedded N‑ and O‑glycan libraries enable d rapid, confident identification of various glycoforms using optimized data analysis workflows.
References
- Takashi Baba et al. (2021) Dissociation of biomolecules by an intense low-energy electron beam in a high sensitivity time-of-flight mass spectrometer. J. Am. Soc. Mass Spectrom. 32(8): 1964-1975.
- An evaluation of a single injection platform method for advanced characterization of protein therapeutics using electron activation dissociation (EAD). SCIEX technical note, RUO-MKT-02-13965-A.
- Peptide mapping study on human erythropoietin (EPO): a complex N- and O-linked glycoprotein. SCIEX technical note, RUO-MKT-02-13650-B.
- Enhanced sensitivity of intact LC-MS approaches to expand the capability of biotherapeutic analysis. SCIEX technical note, RUO-MKT-35364-A.
- A peptide mapping workflow with improved MS sensitivity for enhanced PQA characterization. SCIEX technical note, RUO-MKT-35361-A.
- Li, X. et al. (2024) Comprehensive glycosylation characterization of recombinant human erythropoietin by electron-activated dissociation mass spectrometry. App. Biochem. Biotechnol. 196: 8317–8331.
- Kim, U., Oh, M. J., Seo, Y., Jeon, Y., Eom, J. H., & An, H. J. (2017). Sensitive and comprehensive analysis of O-glycosylation in biotherapeutics: a case study of novel erythropoiesis stimulating protein. Bioanalysis, 9(18): 1373–1383.