Abstract
This single injection platform method offers superior capability over other fragmentation techniques for detailed biopharmaceutical characterization. A comprehensive evaluation of the electron kinetic energy (KE) of EAD was performed to determine the single optimal condition for peptide mapping. Furthermore, the results highlight the ability to adjust electron KE, a key advantage of EAD, to facilitate the fragmentation of a wide range of peptides.
Introduction
New biopharmaceutical modalities, such as fusion and multi-specific protein therapeutics, are becoming more complex in their composition and diverse in their modifications. As a result of this complexity, the characterization of biopharmaceutical modalities is challenging for traditional analytical approaches. It has been demonstrated that EAD1 provides fast and confident peptide mapping2,3 and is powerful for the accurate localization of labile modifications and differentiation of isomers.4-6 These experiments can be performed in a data-dependent manner at up to 20 Hz to maintain compatibility with analytical flow liquid chromatography (LC).
In this technical note, the effect of the KE of the electrons on the fragmentation pattern of various peptides was examined in detail. The results demonstrate the ability of EAD as a generic fragmentation method to meet the needs of efficient bottom-up analysis of protein therapeutics and their candidates.
Key features of the generic platform method for biopharmaceutical characterization
- Optimized single injection method: One EAD method provides best-in-class single injection analysis results for biopharmaceutical proteins
- Ease-of-use: No optimization necessary for EAD, enabling adoption by walk-up users for efficient, routine analysis
- Reproducibility and high sensitivity: EAD provides consistent fragmentation patterns day-in and day-out and high MS/MS sensitivity, boosted by the Zeno trap
- Tunable electron KE: For advanced users, the ability to quickly fine-tune electron KE in a method enables characterization of analytes and modifications that pose challenges for traditional electron-induced dissociation (ExD) approaches
Methods
Sample preparation: The leucine (Leu) and isoleucine (Ile) isomers of human leptin (93-105, NVIQISND-X-ENLR, where X = Leu or Ile) were obtained from AnaSpec Inc. The 2 isomeric peptides were analyzed separately or in a mixture.
NISTmAb (reference material #8671, NIST) was denatured by guanidine-hydrochloride, reduced with dithiothreitol and alkylated using iodoacetamide, followed by tryptic digestion. Several peptides in the tryptic digest of NISTmAb were selected for further analyses, including N-glycosylated and singly charged peptides. Different KEs were used as part of an EAD MRMHR experiment to investigate the impact on fragmentation patterns and information gain.
Etanercept, an N- and O-linked fusion protein, was digested with trypsin using the same procedure described above. This digest was further treated with N-glycanase (PNGase F, Agilent Technologies Inc.) for removal of all N-glycans, and reacted with SialEXO (Genovis Inc.) to cleave sialic acids. Selected O-linked glycopeptides were characterized by EAD in an MRMHR experiment.
Chromatography: Peptides were separated using an ACQUITY CSH C18 column (2.1 × 150 mm, 1.7 µm, 130 Å, Waters Corp), which was kept at 60 °C in the column oven of an ExionLC system (SCIEX). Table 1 shows the LC gradient used for separation of peptide isomers at a flow rate of 0.25 mL/min with mobile phases A and B consisting of 0.1% formic acid (FA) in water and 0.1% FA in acetonitrile, respectively. The separation of peptides derived from NISTmAb and etanercept were carried out using a 60-minute gradient described previously.2


Confidence in peptide identification
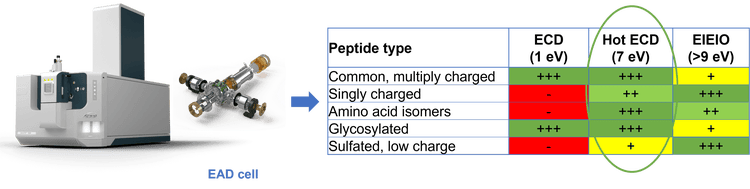
The power of a generic platform method using alternative fragmentation with EAD at 7 eV for confident peptide mapping, differentiation of isomers and accurate localization of glycosylation was highlighted in previous technical notes.2-6 Here, the effect of electron KE, which is a key parameter for EAD, on fragmentation of isomeric, singly to multiply charged, and glycosylated peptides was studied in detail. The results highlight the benefits of using an electron KE = 7 eV as a generic setting for effective, yet comprehensive bottom-up analysis of protein therapeutics.
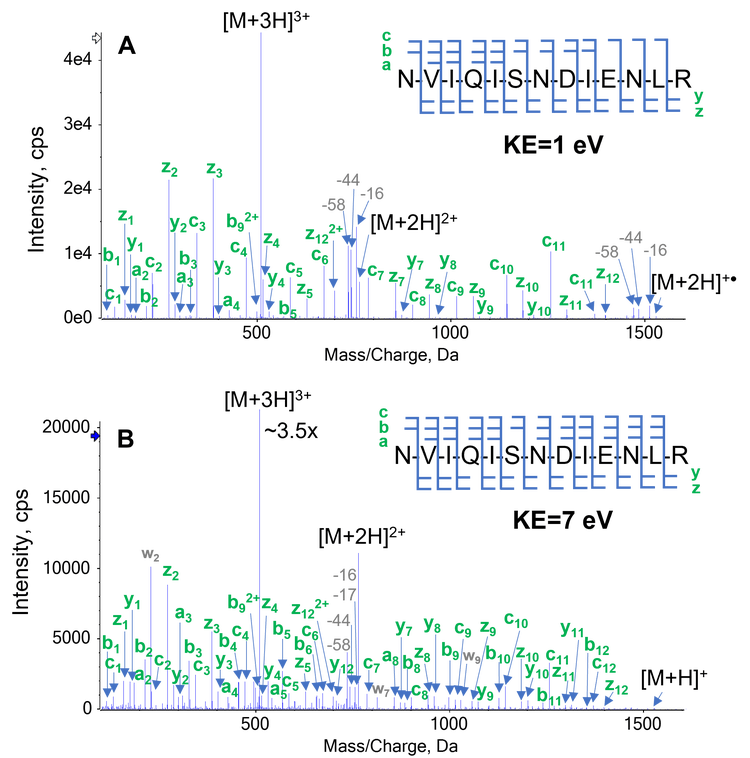
Figure 2 displays EAD spectra of the triply charged leptin (Ile) at electron KE = 1 eV and 7 eV. An electron KE = 1 eV (Figure 2A) produced a high-quality EAD spectrum, dominated by c/z-type fragments. This result is consistent with typical low-energy ExD experiments and yielded complete sequence coverage of this peptide. A higher electron KE of 7 eV (Figure 2B) leveraged hot ECD1, a mechanism that led to the formation of additional fragment ions (a/b-type) for increased confidence in identification and secondary fragmentation of z ions, needed for differentiation between isomers, as will be described more in detail in the following section.
Differentiation between isomers
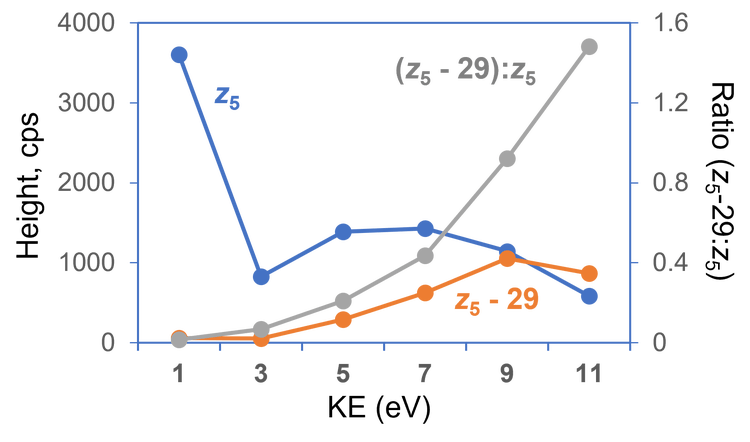
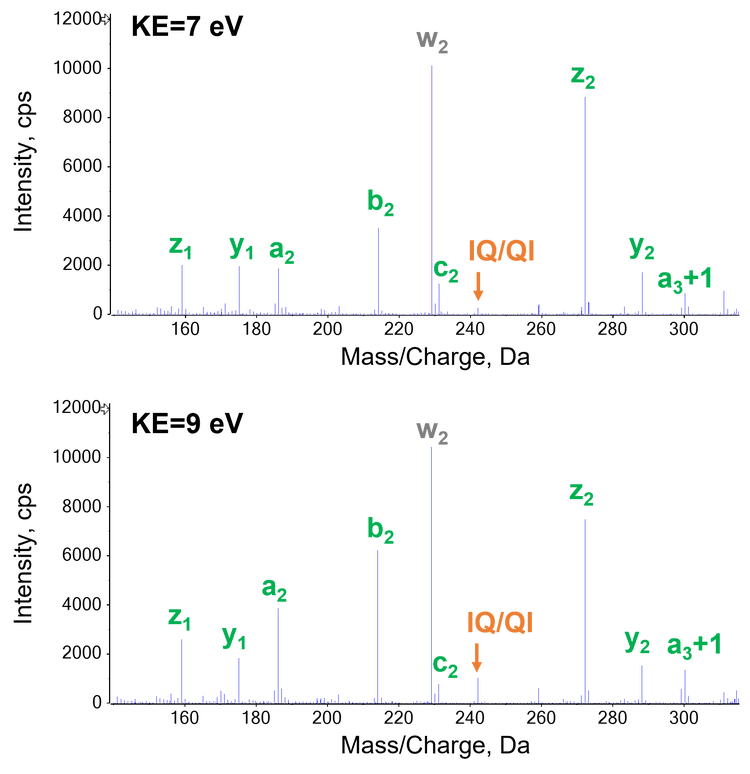
As described previously, EAD allows differentiation of Leu/Ile isomers by generating a signature z-29 fragment for Ile and a z‑43 ion for Leu via the losses of CH3CH2· and (CH3)2CH· from the side chains of Ile and Leu, respectively. Therefore, the Leu/Ile isomer peptides of leptin, which were separated chromatographically (Figure 3A), can be confidently assigned. A z5-29 fragment was detected for the Ile isomer (Figure 3C), but was absent in the EAD spectrum of the Leu isomer (Figure 3D), as expected. The generation of this signature fragment was dependent on the electron KE applied. While an electron KE = 7 eV produced an abundant z5-29 for the Ile isomer (Figure 3C), this peak was barely visible at KE = 1 eV (Figure 3B) despite the presence of an intense z5. This indicates that electrons with KE = 1 eV were not “hot” enough to induce secondary fragmentation of the z-ion needed for the differentiation between isomers. The detailed effect of electron KE on the formation of z5 and z5-29 from the Ile isomer is illustrated in Figure 4. It is worth noting that the significant drop in intensity of z5 between KE = 1 eV and 3 eV can be attributed to a change of the EAD mechanism, from the low-energy condition, typically used in ExD, to hot ECD, capable of providing rich sequence information.1 The transition from low-energy to hot ECD likewise results in the ratio of z5-29 to z5 (gray trace) to increase with KE. Although this ratio continues to increase with electron KE (gray trace in Figure 4), the absolute intensities of the z5 and z5-29 fragments dropped at high KE values (blue and orange traces in Figure 4, respectively). An electron KE = 7 eV provided a balanced outcome for generating the sequence-specific z and Ile-diagnostic z-29 ions, while avoiding excessive internal or secondary fragmentation. As illustrated in Figure 5, EAD with an electron KE = 9 eV resulted in a higher level of internal and secondary fragmentation compared to the platform method with electron KE = 7 eV. Taken together, the results described above demonstrate the capability and suitability of the EAD platform method for confident peptide identification and differentiation of isomers in a single injection.
Localization of N- and O-linked glycosylations
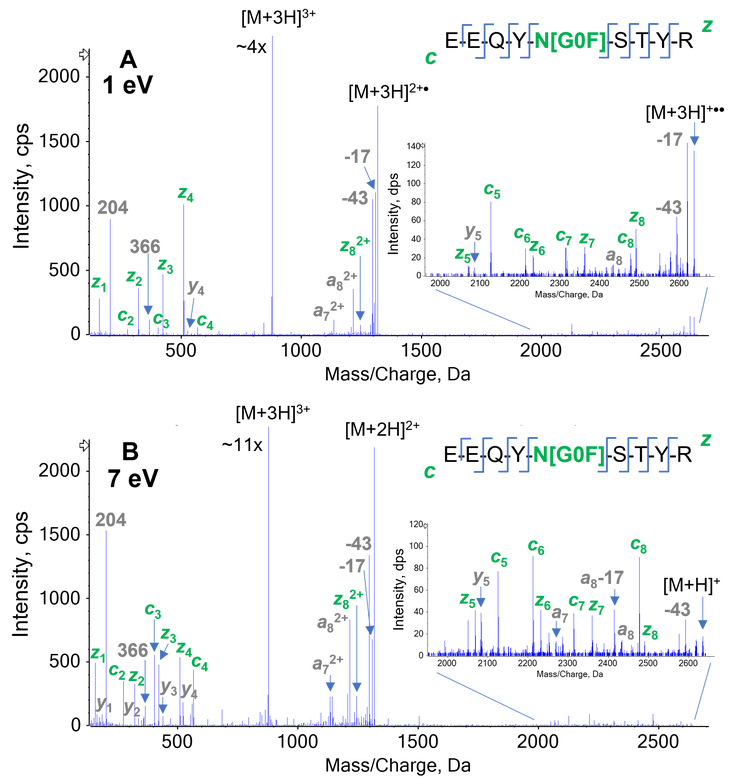
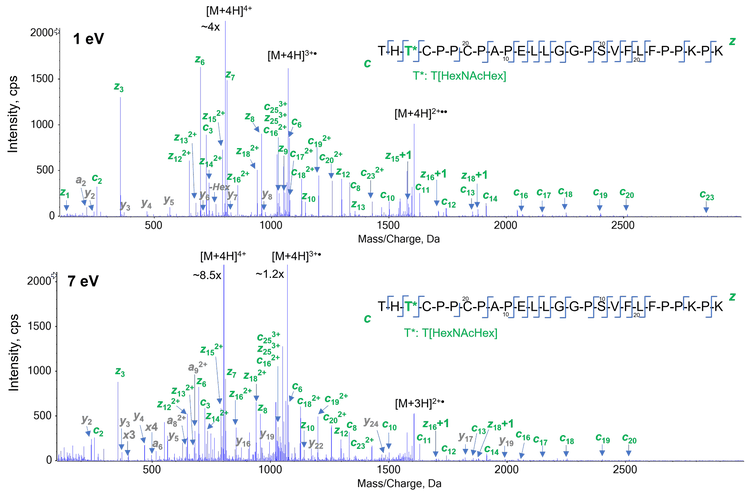
The capability of EAD for accurate localization of glycosylation was demonstrated previously.3 The effects of the electron KE on the fragmentation of an N-linked glycopeptide from NISTmAb (EEQYNSTYR) and an O-linked glycopeptide from etanercept (THTCPPCPAPELLGGPSVFLFPPKPK) were illustrated in Figure 6 and 7, respectively. The electron KEs of 1 eV and 7 eV both generated high-quality EAD data, which enabled unambigous localization of G0F in the N-linked glycopeptide (Figure 6) and HexNAcHex in the O-linked glycopeptide (Figure 7).
Similar to the observation made for the unmodified peptide (Figure 2), an electron KE = 7 eV produced more fragment ions that aided in the identification of the glycopeptides, while still providing confident localization information of the glycosylation. It should be noted that only 1 of the 3 potential sites (2 T and 1 S) in the analyzed O-linked glycopeptide was found to be occupied. These results demonstrate that the EAD platform method using electron KE = 7 eV is powerful for the identification of N- and O-linked glycopeptides, due to extensive peptide backbone fragmentation, and enables accurate localization of glycosylations within peptides with multiple potential glycosylation sites.
Characterization of singly charged peptides
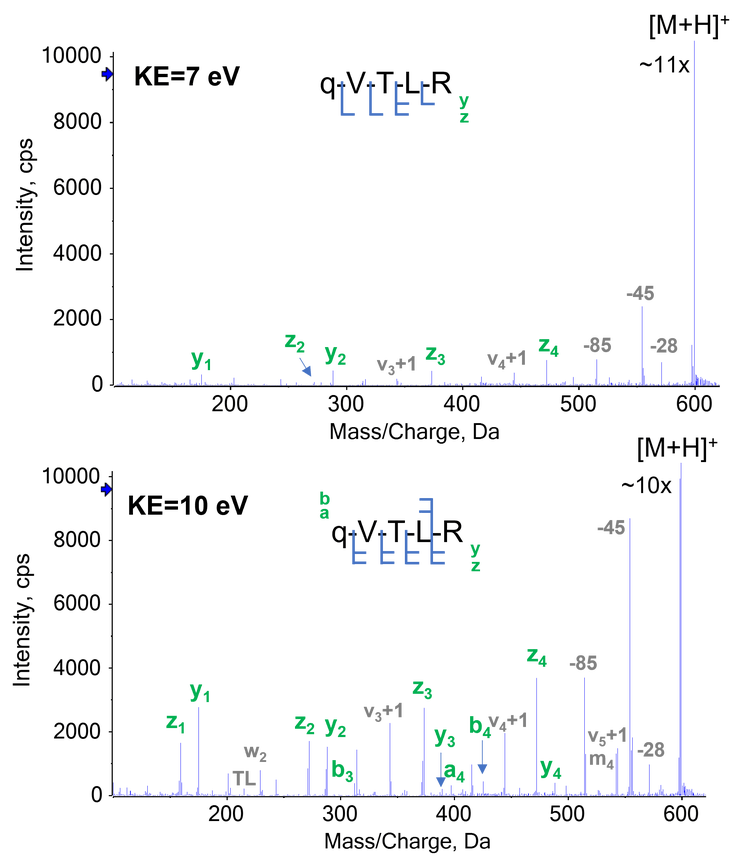
The analysis of singly charged peptides has been a long-standing challenge for traditional ExD approaches and has limited their adoption as a general characterization tool, compared to CID. In this work, the ability of EAD of singly charged peptides was explored. Low electron KEs of 1-5 eV were not sufficient to produce fragment ions for singly charged peptides (data not shown). By comparison, the EAD platform method generated predominantly y/z-type ions for complete sequence coverage of the singly charged qVTLR (q = pyroglutamic acid) from the N-terminus of NISTmAb heavy chain (Figure 8A). Similar results were obtained for other singly charged peptides (for example, SFNR and SLSLSPG) in the NISTmAb digest (data not shown).
Interestingly, increasing electron KE to 10 eV yielded the optimal outcome for singly charged peptides in terms of the number and intensity of the sequence ions detected (Figure 8B). However, further increase of electron KE to >10 eV resulted in excessive internal and secondary fragmentation, without providing any information gain such as additional sequence information (data not shown).
Conclusions
- Efficient and comprehensive characterization of a wide range of peptides in a single injection can reliably be achieved with the optimized platform method using an electron KE = 7 eV
- Confident peptide identification, differentiation between isomers, accurate localization of glycosylations and the characterization of singly charged peptides with EAD enable an unprecedented level of information, not achievable with CID or traditional ExD techniques in a single injection
- The ability to fine-tune electron KE offers additional mechanisms of fragmentation (low-energy ECD or EIEIO) for full flexibility on the fragmentation achieved for specific analytes.
References
- Takashi Baba, Pavel Ryumin, Eva Duchoslav et al. (2021) Dissociation of biomolecules by an intense low-energy electron beam in a high sensitivity time-of-flight mass spectrometer. J. Am. Soc. Mass Spectrom. 32(8):1964-1975.
- Evaluation of biotherapeutic sequence coverage using electron activated dissociation (EAD). SCIEX technical note, RUO-MKT-02-12920-B.
- Comprehensive peptide mapping of biopharmaceuticals utilizing electron activated dissociation (EAD). SCIEX technical note, RUO-MKT-02-12639-B.
- A new electron activated dissociation (EAD) approach for comprehensive glycopeptide analysis of therapeutic proteins. SCIEX technical note, RUO-MKT-02-12980-A.
- Differentiation of aspartic and isoaspartic acid using electron activated dissociation (EAD). SCIEX technical note, RUO-MKT-02-12550-B.
- Differentiation of leucine and isoleucine using electron activated dissociation (EAD). SCIEX technical note, RUO-MKT-02-12605-B.
- Electron activation dissociation (EAD) for accurate localization of labile tyrosine sulfation. SCIEX technical note, RUO-MKT-02-14045-A.
- Peptide mapping study on human erythropoietin (EPO): a complex N- and O-linked glycoprotein. SCIEX technical note, RUO-MKT-02-13650-B.