Abstract
Monoclonal antibody (mAb) stability and purity analysis is an essential step in the development and manufacturing of this therapeutic modality or biosimilars. As a result, biopharma scientists are faced with the analytical challenge of measuring the percent content composition of IgG molecules and impurities after production or during storage conditions. To this end, in this technical note, we describe the application of the high quality and ready to use SCIEX Low pH Sample buffer as an additional biochemical tool to characterize the stability of thermally induced fragmentation of non-reduced IgG. Moreover, we demonstrate the multiplexing capability the BioPhase 8800, a multi-capillary electrophoresis system for high throughput analysis of protein therapeutics using the all-in-one SCIEX CE-SDS protein analysis kit. In summary, the SCIEX Low pH Sample Buffer and the BioPhase 8800 system offer an additional analytical solution for mAb analysis during manufacturing or to examine recommended IgG quality attributes for clinical applications or commercialization.
Introduction
In more detail, we describe the process for the pH stabilizing effect on IgG molecules during mAb sample preparation using capillary electrophoresis-sodium dodecyl sulfate (CE-SDS) and UV detection. For example, it has been shown that treating mAb samples with a basic pHsample buffer(9.0) or a slightly acidic pHsample buffer(6.8) and thermally induced fragmentation under alkylating and non-reducing conditions before CE-SDS analysis leads to a differential IgG purity profiling of the same mAb sample. In this case, it is done by monitoring IgG fragmentation or aggregated IgG species.
Predominantly, showing that IgG molecules are more likely to dissociate or generate impurities in the presence of basic sample preparation conditions, in contrast to a cleaner IgG purity profile by applying a slightly acidic sample buffer during sample preparation, as a result of inhibiting the thiol-disulfide exchange reaction. 4
To demonstrate this biochemical pH stabilizing effect on mAb samples in a high-throughput fashion reflecting manufacturing processes and QA/QC environments, we utilized commercially available biosimilars for drozitumab (anti-DR5), infliximab (anti-TNF alpha), and adalimumab (anti-TNF alpha). Subsequently, samples from these three different biosimilars were prepared for CE-SDS analysis using the BioPhase 8800 system in the presence of the SCIEX SDS-MW sample buffer (pH 9.0) or by using the SCIEX low pH SDS sample buffer (pH 6.8). In addition, to applying thermally induced fragmentation under alkylating and non-reducing conditions to both sets of sample preparation conditions. In summary, this technical note, provides an additional analytical tool to examine mAb stability and purity analysis.
Key features
- Application of the SCIEX low pH SDS sample buffer for CE-SDS analysis of mAbs reduces artifacts
- In combination, the SCIEX low pH and the SDS-MW sample buffers for mAb sample preparation under alkylated and non-reducing conditions with the BioPhase 8800 system provide more accurate assessment of IgG stability and purity content
- The BioPhase 8800 system, including the analysis software, greatly reduce sample processing and analysis time, providing excellent CE-SDS repeatability and intermediate precision results based on the IgG profiling of three different biosimilars for drozitumab, infliximab, and adalimumab.
Methods
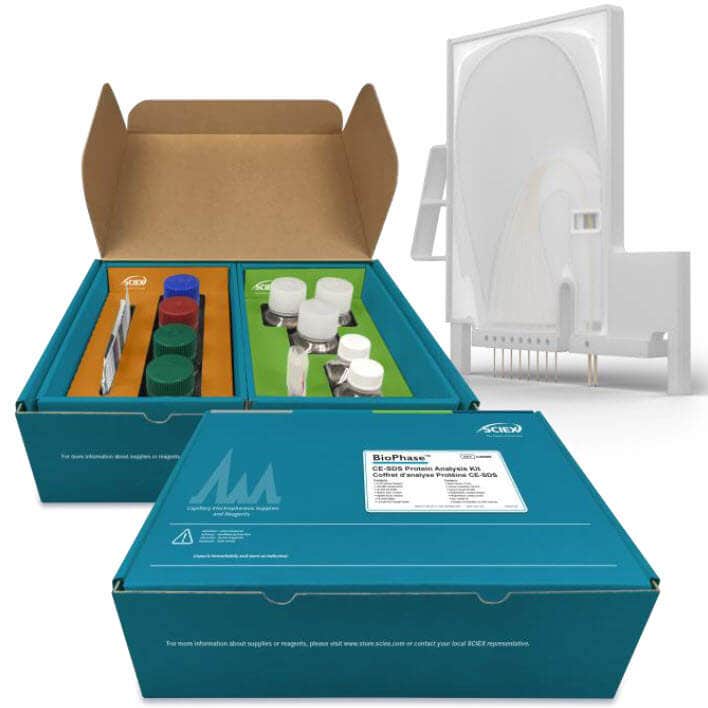
Materials: The biosimilars for drozitumab, anti-DR5 human IgG1, lambda (P/N AB00740-10.0), infliximab, anti-TNF alpha human IgG1, kappa (P/N Ab00146-10.0), and adalimumab, anti-TNF alpha human IgG1, kappa (P/N Ab00718-10.0) monoclonal antibodies (mAbs) were obtained from Absolute Antibody, Redcar, Cleveland, United Kingdom. Iodoacetamide (P/N I1149) was purchased from Millipore-Sigma, St. Louis, Missouri. The CE-SDS protein analysis kit (P/N C30085, Figure 3) containing the SDS-MW sample buffer (pH9.0), the low pH (pH 6.8) sample buffer, the Acidic and basic wash, CE-SDS gel, CE grade water, along with the BioPhase BFS (bare fused silica) capillary cartridge (8 x 30 cm) (P/N 5080121) were obtained from SCIEX, Framingham, Massachusetts.
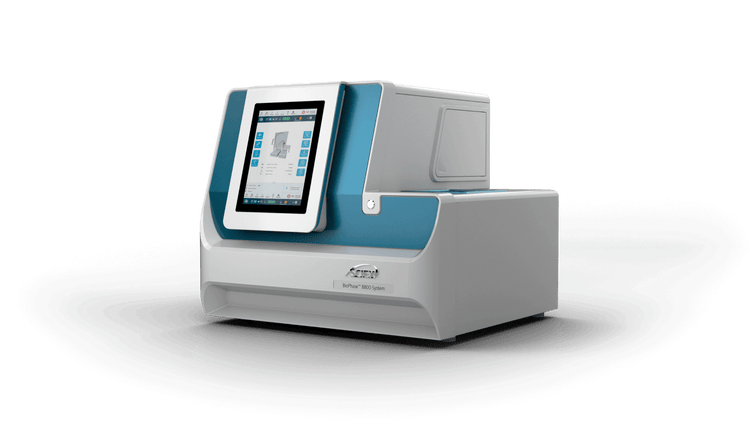
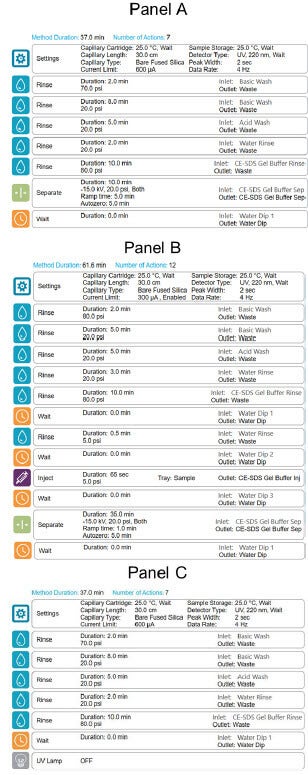
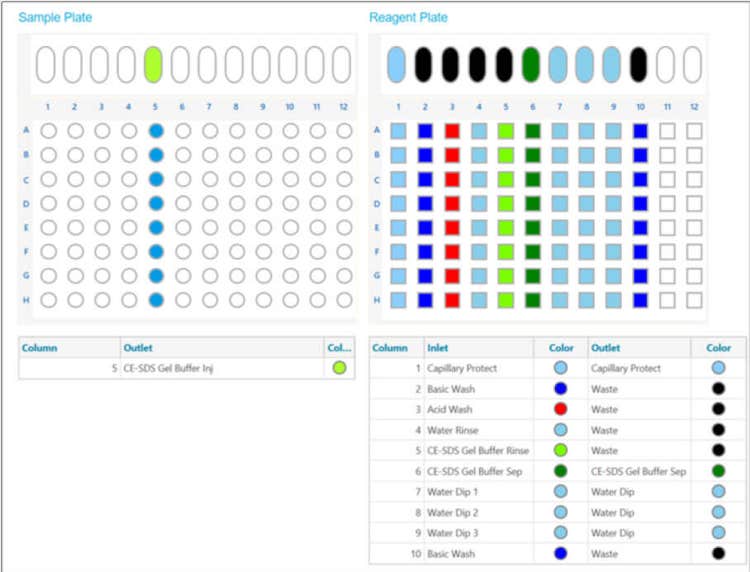
BioPhase 8800 system methods and sequences*:* The BioPhase BFS capillary cartridge conditioning, separation, and shut down methods were created using the BioPhase software v1.0 as illustrated on Figure 4, panels A, B, and C, respectively. CE-SDS monoclonal antibody profiles were generated by running defined BioPhase 8800 system sequences depending on the experimental design. As an example, Figure 5 shows the sample and reagent plate layout for an 8-capillary run. This layout was sufficient to analyze 8 different samples, with each sample analyzed four times with a fully automated process.
Results and discussion
CE-SDS drozitumab IgG purity and stability profiling
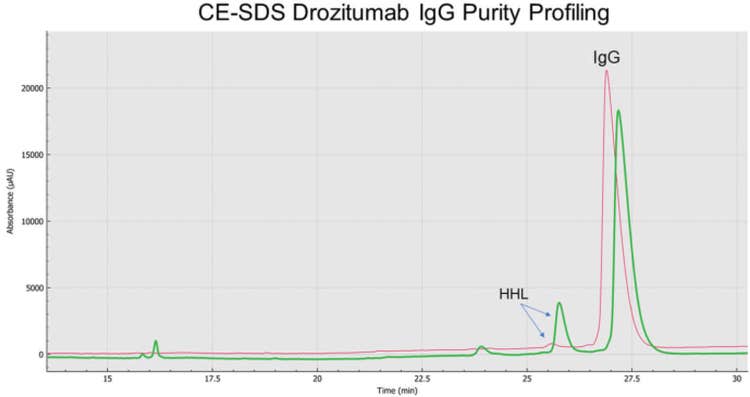
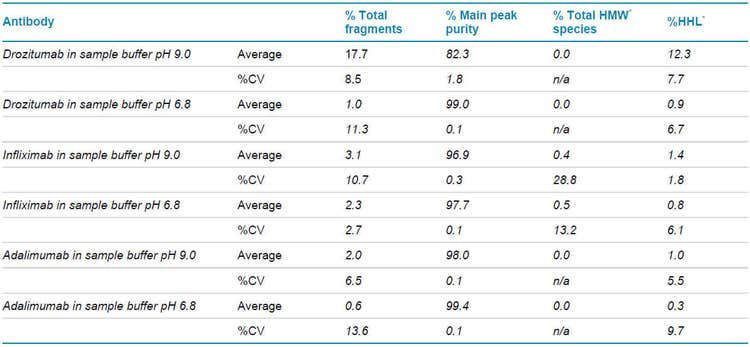
As shown on Figure 1, and consistent with the biochemistry for the thiol-disulfide exchange equilibrium, a much greater IgG purity content was observed for non-reduced and alkylated drozitumab treated with the SCIEX low pH (6.8) SDS sample buffer (average IgG content 99.0%; red trace). The main impurity reflecting the Heavy-Heavy-Light Chain (HHL) product with an average impurity content of 0.9% (arrows). In contrast, CE-SDS sample preparation under basic conditions (pH 9.0) using the SCIEX SDS-MW sample buffer (green trace) highly favored IgG reduction as demonstrated by the appearance of IgG-related impurities, mainly the production of HHL products with an average content of 12.3%, resulting on an IgG average purity content of 82.3%. Furthermore, Table 1 summarizes the pH effect on the stability of drozitumab treated under slightly acidic or basic conditions. Mainly, greater fragmentation or artifacts were detected on drozitumab by using CE-SDS in the presence of a basic sample buffer.
Analysis of infliximab with pH 9.0 and pH 6.8 sample buffers
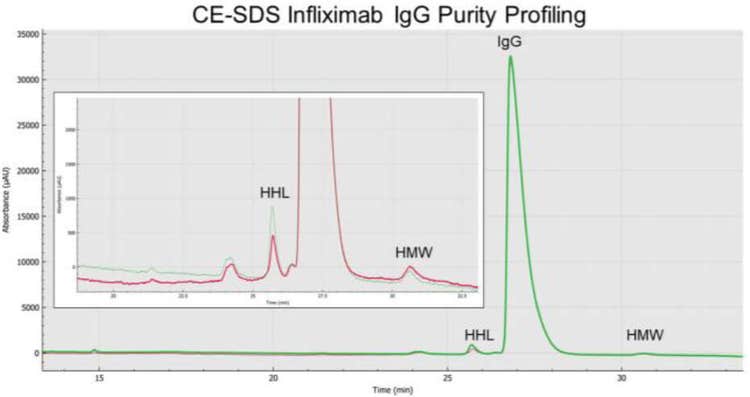
As previously shown in previous studies, IgG alkylation during sample preparation using IAM is a key step to prevent aberrant product formation like IgG heavy molecular weight species due to thiol-disulfide exchange reactions. In this section, we present the CE-SDS infliximab purity profiling in the presence of the basic or slightly acidic sample buffers. Our results showed that infliximab sample preparation using thermally induced fragmentation under alkylated and non-reducing conditions with basic or slightly acidic buffers lead to detection of higher molecular weight (HMW) species as shown on Figure 7 with a percent composition of less than 1% (Table 1).
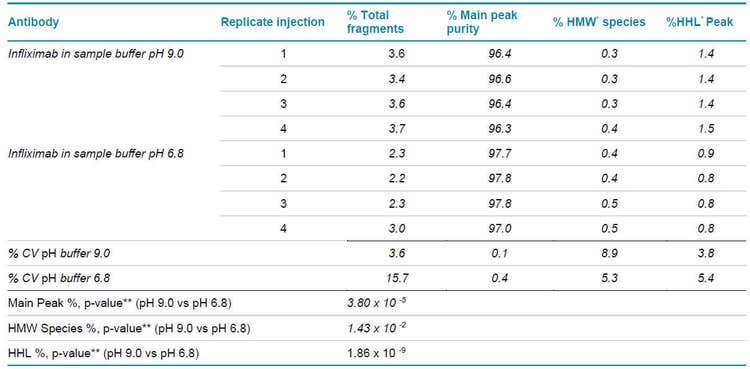
However, closer analysis showed infliximab having an average HMW content of 0.5% in the presence of the pH 6.8 sample buffer and average HMW content of 0.4% using the pH 9.0 sample buffer (p-value of 0.014).
The HHL impurity for infliximab using this sample preparation procedure showed average content composition of 0.8% using the pH 6.8 sample buffer, in contrast to an HHL impurity of 1.4% in the presence of the pH 9.0 sample buffer (p = 1.86 x 10⁻⁹).
Lastly, the intact IgG purity under slightly acidic conditions was greater than with using a basic sample buffer during sample preparation. In this case, an average IgG purity content of 97.7% and 96.9% (p = 3.80 x 10⁻⁵), respectively.
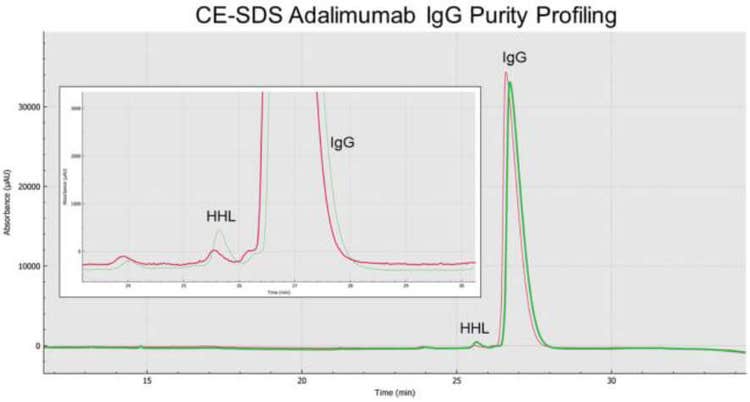
Increased adalimumab IgG purity detected with SCIEX low pH sample buffer
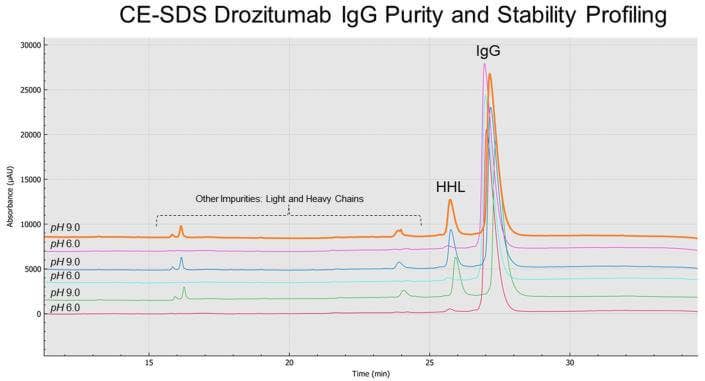
BioPhase 8800 system analysis of adalimumab IgG purity showed that sample preparation also played a role on IgG purity profiling. For example, the overlay or stacking of the electropherograms for non-reduced and alkylated adalimumab samples in the presence of the basic or slightly acidic SCIEX sample buffers for CE-SDS analysis, as shown on Figure 8 and Table 1, demonstrated a much bigger HHL peak (green trace) for samples treated with the basic buffer in contrast to the adalimumab treated with the low pH sample buffer (red trace).
Specifically, adalimumab’s IgG (% main peak purity) average content was 99.4% in the presence of the SCIEX low pH sample buffer. The average IgG content for adalimumab treated with the SCIEX SDS-MW sample buffer was 98.0%, making for a statistically significant difference of p = 1.88 x 10⁻¹³ for the IgG purity under these two sample preparation conditions. No HMW species were detected for adalimumab treated with the basic or slightly acidic SCIEX sample buffers.
The average adalimumab HHL content composition for the acidic and basic sample preparation conditions were 0.3% and 1.0%, respectively (p = 4.15 x 10⁻¹³).
BioPhase 8800 system performance on IgG purity profiling
To support the characterization of IgG purity in development and QA/QC, we performed an intermediate precision CE-SDS study on drozitumab, infliximab, and adalimumab using the BioPhase 8800 system.
Following alkylated and non-reduced mAb sample preparation conditions for thiol-disulfide exchange reactions using the slightly acidic or basic sample preparation buffers as noted in the Methods section for CE-SDS analysis this intermediate precision study consisted of three different sample preparations over three different days, with each sample preparation analyzed four times (n=4). In summary, Table 1 illustrates the average percent composition for the main peak or IgG and impurities such as HHL, HWM, and other fragmentation species for drozitumab, infliximab, and adalimumab in the presence of the basic or slightly acidic pH buffers. The least variation (%CV) on IgG purity content determination consistently across drozitumab, infliximab, and adalimumab by CE-SDS using the BioPhase 8800 system and the CE-SDS protein analysis kit, was by preparing the mAb sample with SCIEX low pH SDS sample buffers. Note that % Total Fragments represents all artifacts or impurities prior to the IgG peak and the HWM species. All the %CV values for the % Total Fragments across the different mAbs were calculated below a 15% cut off. However, we recommend that analytical labs follow the most current acceptance criteria guidelines for impurity assay development or qualification.
Overall, the different %CV values shown on Table 1 support the analytical capability of the BioPhase 8800 system for development and QA/QC applications. In more detail, Table 2 indicates the individual values for infliximab’s %Total Fragments, %Main Peak, %HMW species, and %HHL Peak calculated by the BioPhase 8800 software. This representative series of injections based on the mAb sample preparation using the basic or slightly acidic buffer demonstrate the high reproducibility of impurities profiling by applying the SCIEX CE-SDS protein kit and the simultaneously analyses performed by the BioPhase 8800 system.
Conclusions
- UV CE-SDS IgG purity content determination using the BioPhase 8800 system demonstrated excellent robustness for development and QA/QC characterization
- High-throughput processing using a fully automated platform characterized up to 72 injections or mAb profiles with minimal BioPhase 8800 system interaction. Saving hours or days of sample processing time compared to other single channel CE-SDS systems.
- IgG purity profiling can differ when the sample preparation is performed with a basic pH buffer (pH 9.0) or a slightly acidic pH buffer (pH 6.8)
- Parallel mAb sample preparation using the SCIEX SDS-MW sample buffer (pH 9.0) and the low pH SDS sample buffer (pH 6.8) can provide a better assessment for IgG stability and purity profiling.
References
- Wang, W., et. al. Minireview – Antibody Structure, Instability and Formulation. Journal of Pharmaceutical Sciences. 96.1.2007. (1-26).
- Ma, Hui., et. al. Antibody Stability: A key to performance – Analysis, influences and improvement. Biochimie. 177.2020. (213-225).
- Chung, W.K., et. al. Effects of Antibody Disulfide Bond Reduction on Purification Process Performance and Final Drug Substance Stability. Biotechnology and Bioengineering. 114.6.2017. (1264-1274).
- Zhang, J., et. al. Method development and validation of capillary sodium dodecyl sulfate gel electrophoresis for the characterization of a monoclonal antibody. Journal of Pharmaceutical and Biochemical Analysis. 53. 2010. (1236-1243).