Abstract
Established methodologies for the quantification of Tg in serum usually employ an immunoassay approach, however, such techniques are known to generate false low or high results in the presence of anti-Tg autoantibodies, which are believed to present in up to 30% of thyroid cancer cases. Therefore, LC-MS assays have been investigated as alternative methods for greater specificity. Here an assay has been developed using three main automatable steps – addition of stable isotope internal standards, digestion and antibody enrichment, followed by a short (7.5 min) LC-MS analysis. Good quantification of the target peptides for thyroglobulin in human serum was demonstrated.
Introduction
Thyroglobulin (Tg) is a protein produced by the follicular cells of the thyroid. Under the action of thyroid stimulating hormone (TSH), it is broken down to release the thyroid hormones thyroxine (T4) and triiodothyronine (T3) when needed. Thyroglobulin is recycled and the active forms of thyroid hormone are then passed into circulation where they have known functionality in almost every cell in the body, playing a role in many critical metabolic processes.
Established methodologies for the quantification of Tg in serum usually employ an immunoassay approach. However, such techniques are known to suffer from selectivity issues. Specifically, immunoassay methods of analysis of thyroglobulin anti-Tg autoantibodies, which can be present in some thyroid cancers, are known to interfere with results. Therefore, research into alternative methods of analysis with greater specificity is increasing.
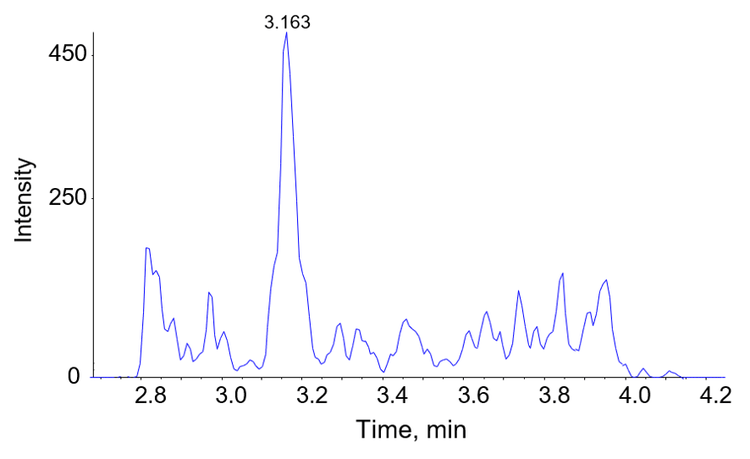
Mass spectrometry has been investigated as an option for analysis of thyroglobulin. LC-MS is becoming widely established in clinical laboratories and is increasingly the method of choice for a number of key analyses. A method for the analysis of Tg by mass spectrometry has been developed and is presented here. An example chromatogram is shown in Figure 1.
The analysis of a protein such as Tg presents novel challenges for established mass spectrometry sample preparation workflows where analysis of a low-abundance protein is desired. In these cases, sample processing procedures play an important role in determining assay performance. With that in mind, a sample preparation procedure based on the SISCAPA workflow has been developed, with targeted magnetic antibody bead separation of a tryptic Tg peptide.
Key features of the Citrine Triple Quad MS/MS System for the analysis of thyroglobulin
- Robust approachallows direct detection of serum Tg using partially automatable sample preparation and fast chromatography
- Targeted MRM workflow allows sensitive detection with high selectivity
- The reduced matrix effects associated with a tandem mass spectrometry approach give higher confidence inresults
Methods
Sample preparation: Sample preparation consisted of a modified version of the SISCAPA workflow (SISCAPA Assay Technologies, California, United States). Briefly, the workflow is as follows in 96 deep well format:
-
Digestion of sample proteins to peptides, composed of:
- Heat and chemical denaturation with deoxycholate
- Alkylation with iodoacetamide
- Trypsin digestion, quenched with trypsin inhibitor
-
Addition of stable isotope labelled FSP peptide internal standard (SIS)
-
Enrichment of target peptide and its respective SIS, using anti-FSP-peptide antibody coated magnetic beads (from SISCAPA Assay Technologies)
-
Washing and elution of FSP-peptide from antibody-bead conjugate
-
Chromatography of target peptide and SIS with quantification by triple quadrupole mass spectrometry
Chromatography: Chromatographic separation was achieved using an Aeris Peptide C18 HPLC column (Phenomenex) with mobile phases composed of water (Mobile Phase A) and acetonitrile (Mobile Phase B), both containing 0.1 % (v/v) formic acid. A gradient of 5 – 95 – 5 % Mobile Phase B was applied over a chromatographic run time of 7.5 minutes.
Mass spectrometry: Mass spectrometry analysis was provided by the Citrine Triple Quad MS/MS System, operating in positive electrospray mode. Compound-dependent parameters were optimized for the FSP peptide and its corresponding SIS. A total of 2 MRM transitions were analyzed for the FSP peptide and 1 MRM transitions for the SIS (Table 1).
Data processing: Quantification was carried out using Analyst® MD Software 1.6.3. Standard curves were generated using linear fits with a 1/x weighting.

Analytical sensitivity
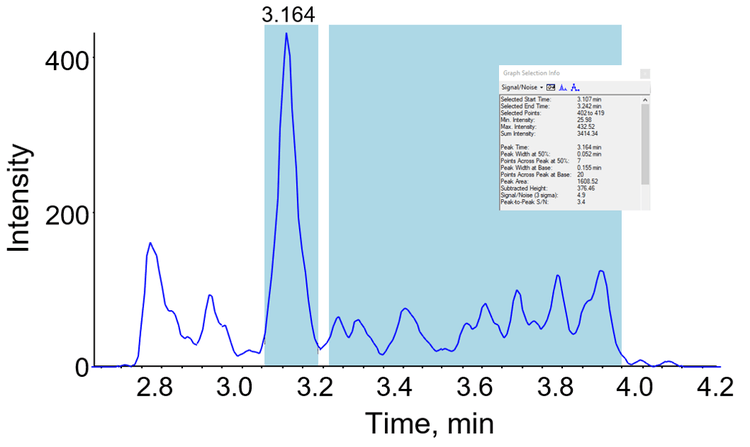
Analytical sensitivity was investigated with a series of calibration standards prepared in matrix and processed as per the procedure outlined above. Figure 2 shows the chromatogram generated from a 0.1 ng/mL calibrator, with signal:noise calculations based on peak-to-peak parameters.
Analytical linearity
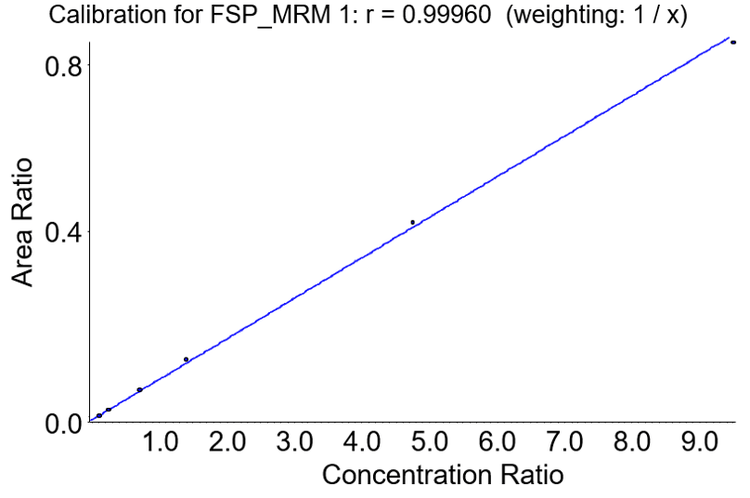
A series of calibrators were prepared in matrix to assess linearity over the proposed analytical range required for the quantification of thyroglobulin in human serum. Research suggests that measured thyroglobulin levels in the range of 0.1–2.0 ng/mL in athyrotic individuals on suppressive therapy indicate a low risk of clinically detectable recurrent papillary/follicular thyroid cancer. Research also shows that measured thyroglobulin levels between 2.1 and 9.9 ng/mL suggest further investigation in the context of TSH is advisable. As any potential thyroglobulin assay requires accuracy over this narrow concentration range, calibrators across the range of 0–9.5 ng/mL in matrix were prepared and processed as per the procedure outlined previously. Figure 3 shows a calibration curve for the primary MRM transition of the FSP peptide analyzed as described.
Precision
Intra-day precision performance was demonstrated using replicates (n=5) of two pools of serum at separate, discreet concentrations across the range investigated, processed and quantified as described (Table 2). Inter-day precision performance was assessed using performance of calibration standards over regular incidences (n=10) of assay utilization over a time period of approximately six months. Table 3 shows the collated mean, accuracy and percentage co-efficient of variation values generated from these data.


Comparison with existing MS-based assays
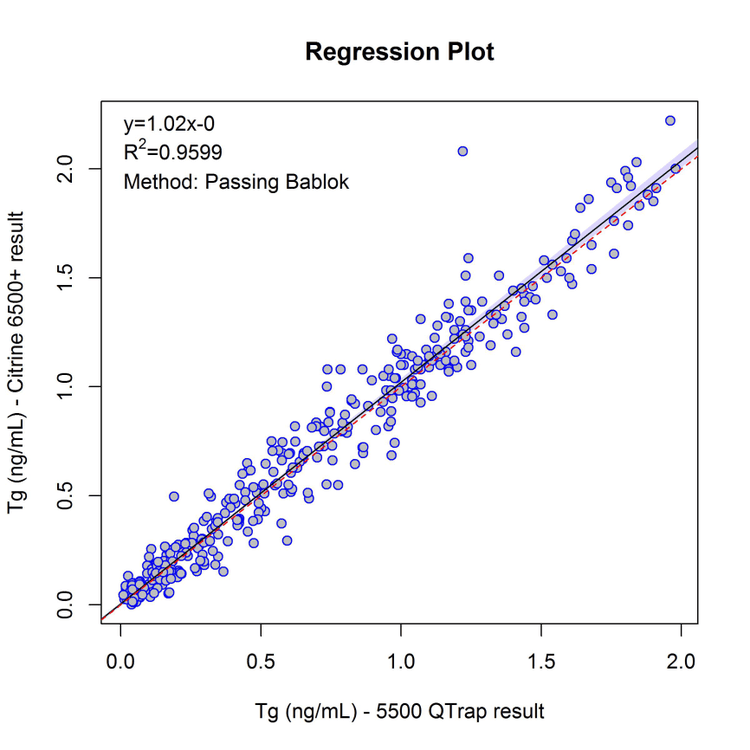
To show acceptable performance when compared with established assays, a series (n=380) of pre-analyzed samples were processed by the proposed methodology and the comparison between results generated by established and proposed methodologies were displayed as a Passing-Bablok regression plot in Figure 4
Conclusions
The data were generated from a method developed for the sensitive quantification of thyroglobulin in human serum. The workflow consisted of three main automatable steps — addition of stable isotope internal standards, digestion and antibody enrichment, followed by a short (7.5 min) LC-MS analysis.
The assay demonstrated the following performance parameters:
- Sensitivity, based on signal:noise calculated by a peak-to-peak algorithm, was shown to be 3.4:1 at a 0.1 ng/mL matrix standard
- Linearity was defined over a specific dynamic range and was calculated at an r2 value of 0.9992 over a range of 0.1–9.5 ng/mL
- Intra-day accuracy and precision, calculated using pooled serum at two discreet concentrations, was shown to be ≥89.5% accurate with a %CV of ≤13.5% for all concentrations analyzed
- Inter-day accuracy and precision, calculated using repeat analysis of serum calibrators over a long time period, was shown to be between 95.5–102.9% accurate with a %CV of ≤ 11.99 for all concentrations analyzed
- Comparisons of previously analyzed samples between this and established MS-based assays for the quantification of thyroglobulin show good agreement across all concentration ranges analyzed