Quantitative and qualitative determination of 130 novel psychoactive substances in whole human blood
Abstract
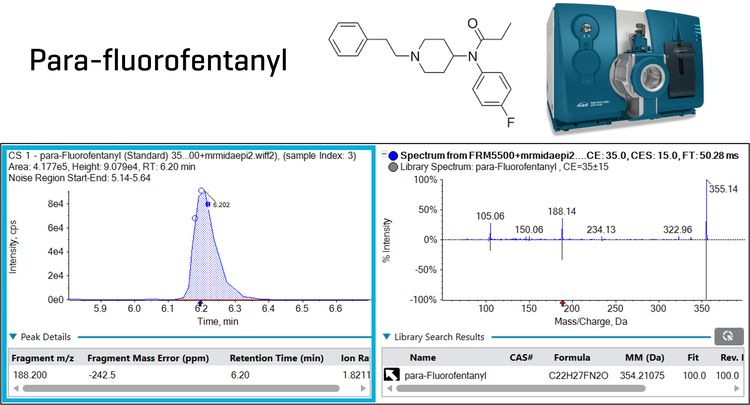
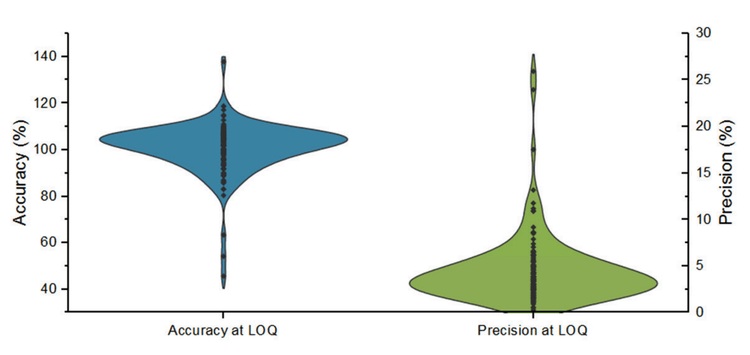
This technical note describes the quantitation of 130 novel psychoactive substances (NPS) in human whole blood, achieving in-sample limits of quantitation (LOQs) down to 0.1 ng/mL for most compounds using an MRM acquisition method. In addition, using the QTRAP technology of the SCIEX 5500+ system, compound detection confidence was improved using enhanced product ion (EPI) scans which enabled MS/MS library matching (Figure 1). Most NPS showed positive MS/MS matches against a user-generated reference standard library in the 0.1 ng/mL calibrator, demonstrating good sensitivity and applicability for real-world samples. Using a standalone MRM method, good quantitative performance was shown in matrix spikes with mean accuracies between 80% and 120% and precision <10%CV for most NPS. In addition, the method demonstrated chromatographic separation for 24 out of 29 isobaric NPS groups. The acquisition of full scan MS/MS spectra distinguished most co-eluting isobaric groups, providing an added level of confidence for compound confirmation.
Key benefits for the analysis of NPSs in human whole blood using the SCIEX 5500+ system
Broad applicability. Routine, robust screening of 130 NPSs in human whole blood covering a wide diversity of NPS classes
Isobar separation. False positives minimized with the chromatographic separation of 24 out of 29 isobaric groups
Trace-level sensitivity. NPS were quantifiable in sample down to at least 0.1 ng/mL (in-sample) except for two compounds
Good LOQ quantitative performance. Mean accuracies were mostly between 80-120%, mean precision was mostly <10%CV
Enhanced detection confidence. EPI scans acquired highquality MS/MS spectra for library matching against a user-generated database of reference standards. 122 out of 130 NPS showed a positive, accurate library match in the 0.1 ng/mL calibrator
Introduction
NPS comprise a diverse class of chemicals and are analogues of controlled drugs and pharmaceuticals or newly synthesized compounds.1 These novel drugs are often designed with the intention to mimic the effects of known controlled substances.1 Recent years have seen a proliferation of NPS in the illicit drug market and they are well-recognized as significant public health concerns.
The diversity and complexity of NPS present a significant challenge for forensic toxicology workflows.2 A robust screening workflow must be comprehensive, sensitive and possess a high degree of selectivity to minimize interferences from biological matrices. Further, large NPS panels are difficult due to the presence multiple isobaric chemicals, requiring chromatographic separation to avoid false positive detections. Finally, screening workflows must be adaptable to meet the constant discovery of new NPS chemicals.
In this technical note, we present a comprehensive, robust method for analyzing 130 NPS compounds in human whole blood using a simple protein precipitation sample preparation procedure and the SCIEX 5500+ system. Two workflows are presented. The first workflow used a traditional MRM acquisition method to achieve sub-ng/mL sensitivity in whole blood. The second method used data dependent acquisition (DDA) with an MRM survey scan to trigger EPI-based MS/MS, combined with MS/MS spectral library matching, to increase NPS detection confidence.
Methods
Target analytes: The target analytes comprised 130 NPS compounds of which 22 were stimulants, 16 were hallucinogens, 6 were dissociatives, 45 were synthetic opioids, 13 were benzodiazepines and 28 were synthetic cannabinoids (including cannabinoids). Target analytes were purchased from Cerilliant Corporation (Round Rock, TX) and Cayman Chemical Company (Ann Arbor, MI). A master stock solution of all 130 NPS (1000 ng/mL) was prepared in methanol using seven individual mix solutions. The master stock solution was then used to make 3 intermediate stock solutions at 1, 10 and 100 ng/mL in whole blood.
Calibrator preparation: The 3 stock solutions in human whole blood were used to prepare a series of 9 calibrator solutions covering concentrations of 0.1-50 ng/mL (0.1, 0.25, 0.5, 1.0, 2.5, 5.0, 10, 25, and 50 ng/mL) for most analytes. The concentration range for alpha PPP was 0.01-5 ng/mL and 0.04-20 ng/mL for U-48800. The following components had one or both transitions calibrated only up to 25 ng/mL due to detector saturation: 4-APB, 3-chlorocathinone, deschloronorketamine, 4F-pentedrone, N-methyl-hexylone, bentazepam, 3-fluoro-N-ethylbuphenedrone, N-ethyl heptedrone, 5-MeO-MiPT, N-butyl hexedrone, flunitrazolam, PCE, para-methyl AP-237, furanyl UF-17, nitrazolam, 4F-MDMB-BICA, tenocyclidine, despropionlyl ortho-fluorofentanyl, ADB-BINACA, N-piperidinyl etonitazine, ADB-4EN-PINACA, 5F-EMB-PICA, 5F-BZO-POXIZID (5F-MDA-19), 4CN-CUMYL-BINACA, 4F-MDMB-BINACA, 4’-hydroxy nitazene, 5F-MDMB-PICA, ADB-PHETINACA, clonitazene.
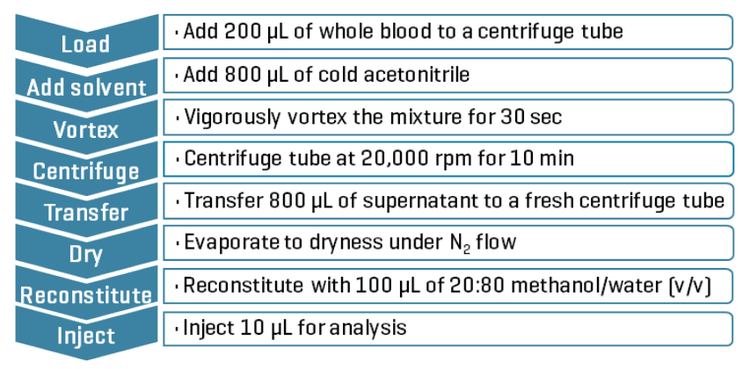
Sample preparation: NPS were extracted from 200 µL of the spiked human whole blood mixtures using a protein precipitation procedure with acetonitrile. The protein precipitation procedure is summarized in Figure 2.
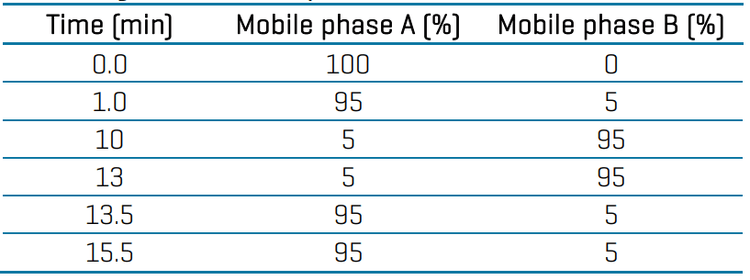
LC chromatography: Chromatographic separation was performed using an ExionLC system and the Phenomenex Kinetex C18 column (50 x 3.0mm, 2.6 µm, 00B-4462-Y0). Mobile phase A (MPA) was 5mM ammonium formate in water with 0.1% (v/v) formic acid and mobile phase B (MPB) was 50:50 (v/v) methanol/acetonitrile with 0.1% (v/v) formic acid. The LC gradient program is presented in Table 1. The injection volume was 10 µL, the column oven was 30oC, the LC flow rate was 0.4 mL/min and the total LC runtime was 15.5 min.
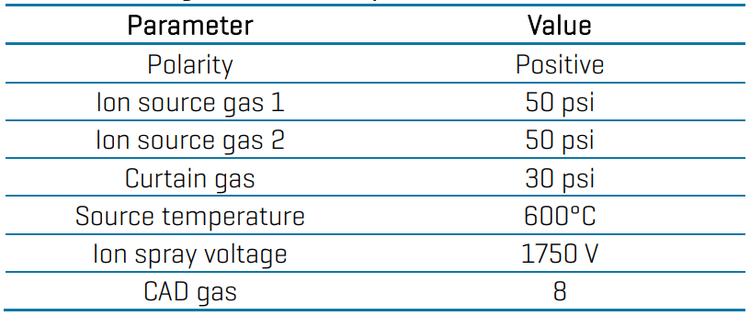
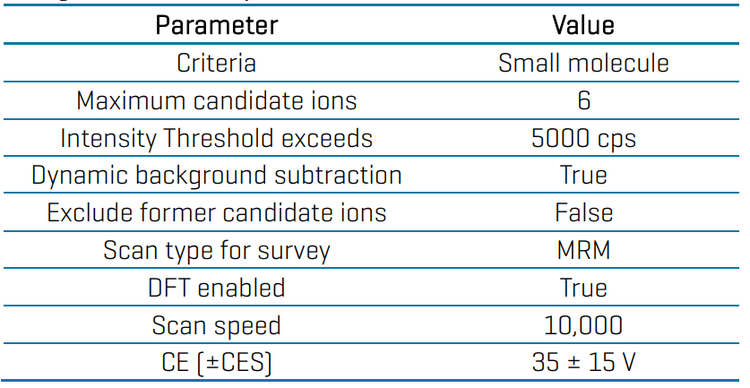
Data processing: Data acquisition and processing were performed in SCIEX OS software (v 3.4). Quantitative analysis was performed in the Analytics module of the software and peaks were automatically integrated using the MQ4 algorithm. Calibration curves, concentration calculations and accuracy and precision statistics were automatically generated.
MS/MS spectral library comparison was performed with the MRM-DDA-EPI data. The library search algorithm was set to “Smart Confirmation Search” with results sorted by “Fit”. In the Algorithm Parameters criteria, “Precursor Mass Tolerance” was set to ±0.4 Da, and “Use Polarity” was selected. The “Intensity Threshold” was 0.05 and the “Intensity Factor” was 5. Experimental MS/MS spectra were compared against a custom-built library that was previously generated from the individual neat standard mixtures.
Chromatographic separation of isobaric NPS groups
Chromatographic separation of isobars is important to minimize potential false positives, false negatives and poor quantitative accuracy. The NPS analyte panel contained 29 isobaric groups comprising a total of 70 compounds and therefore the LC column, mobile phases, modifiers, and gradient conditions were chosen to optimize the isobar chromatographic separation.
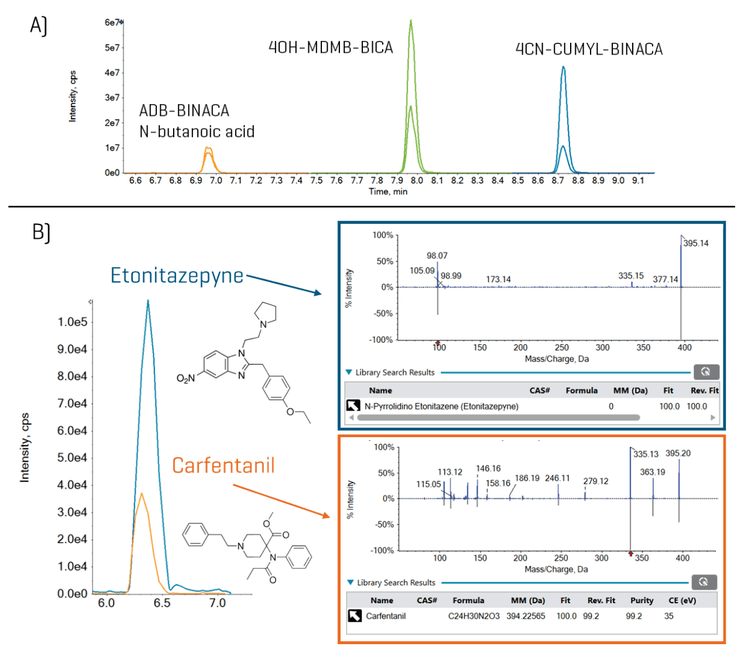
Overall, the method chromatographically separated 24 out of the 29 isobaric groups. Figure 3 (top panel, “A”) shows an example of the baseline separation of the isobaric group: ABD-BINACA N-butanoic acid, 4OH-MDMB-BICA, and 4CN-CUMYL-BINACA. Of the 5 non-chromatographically separated groups, 2 isobaric groups contained compounds with unique fragments and were, therefore, distinguished using their MS/MS spectral patterns. For example, as shown in Figure 3 (bottom panel, “B”), the co-eluting isobaric pair of etonitazepyne and carfentanil were confirmed by their unique MS/MS spectra and library matching. For the remaining 3 isobaric groups, detection confirmation and quantitation should be performed using orthogonal chromatography conditions.
Quantitative performance in matrix-matched calibrators
Sensitivity, accuracy, precision, and linear dynamic range were evaluated in a series of calibrators spiked into human whole blood, processed through the protein precipitation sample preparation procedure, and analyzed using the SCIEX 5500+ system. The calibration range was from 0.1 ng/mL to 50 ng/mL except for alpha-PPP (0.01-5 ng/mL) and U-48800 (0.04-20 ng/mL).
For most NPS compounds, the linear dynamic range was 2-2.5 orders of magnitude, and a quadratic calibration curve was the best regression model. Overall, the quadratic regression relationship was good with r2 values >0.900. For NPS with higher sensitivity, detector saturation was observed at the top two calibrators (25 and 50 ng/mL). Specifically, the following NPS had one or both transitions calibrated only up to 25 ng/mL due to detector saturation: 4-APB, 3-chlorocathinone, deschloronorketamine, 4F-pentedrone, N-methyl-hexylone, bentazepam, 3-fluoro-N-ethylbuphenedrone, N-ethyl heptedrone, 5-MeO-MiPT, N-butyl hexedrone, flunitrazolam, PCE, para-methyl AP-237, furanyl UF-17, nitrazolam, 4F-MDMB-BICA, tenocyclidine, despropionlyl ortho-fluorofentanyl, ADB-BINACA, N-piperidinyl etonitazine, ADB-4EN-PINACA, 5F-EMB-PICA, 5F-BZO-POXIZID (5F-MDA-19), 4CN-CUMYL-BINACA, 4F-MDMB-BINACA, 4’-hydroxy nitazene, 5F-MDMB-PICA, ADB-PHETINACA, clonitazene. In contrast, NPSs with their actual LOQ near the 0.1 ng/mL calibrator showed linearity throughout the 0.1 to 50 ng/mL range. The observed range in linearity behavior was expected due the structural diversity of the NPS included in the panel.
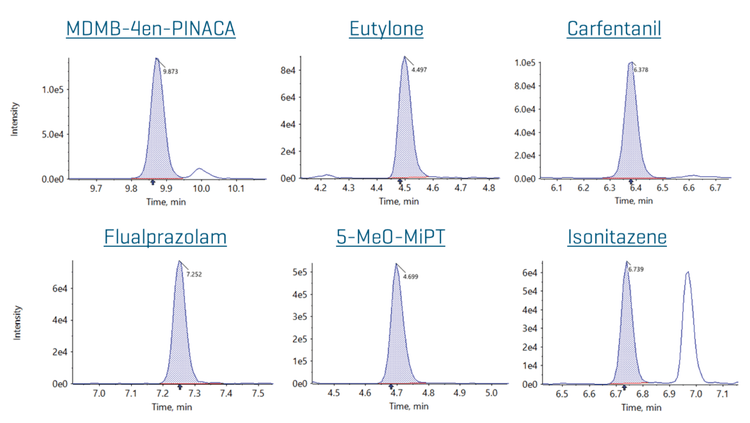
Most NPS compounds were quantifiable down to 0.1 ng/mL, which represented the lowest calibrator point. The only exceptions were alpha-PPP (LOQ = 0.01 ng/mL) and U-48800 (LOQ = 0.04 ng/mL), which had a lower calibration range, and ADB-4EN-PINACA (LOQ = 0.25 ng/mL) and 4-AcO-EPT (LOQ = 5 ng/mL), which showed comparably less sensitivity. Extracted ion chromatograms (XICs) for representative NPS at the LOQ are shown in Figure 4. These XICs demonstrate good signal-to-noise down at the LOQ concentration for most NPSs, indicating that the actual LOQ was presumably significantly lower.
Improved detection confidence using QTRAP technology and MS/MS library matching
It is crucial for forensic toxicology labs to obtain confident, unambiguous NPS detection in real-world samples. QTRAP instruments can acquire enhanced product ion (EPI) scans which provide high-quality MS/MS spectra for library matching and compound detection confirmation. Therefore, separate MRM-DDA-EPI experiments were performed to acquire MS/MS spectra for the full calibrator set. The experimental MS/MS were compared against a user-generated MS/MS spectral library of reference standards using the Library Search module in the SCIEX OS software. The custom NPS library was previously generated from individual neat standard solutions.
At the lowest calibrator level (0.1 ng/mL for most NPS), positive MS/MS library matches were confirmed for 122 out of the 130 NPS target analytes. Examples are shown in Figure 1 for parafluorofentanyl and Figure 6 for brorphine. In addition, Figure 6 shows the qualitative flagging rules filtering in the Results Table. A library Fit score >70 was considered a positive match for compound detection. The Results Table was quickly filtered using the qualitative flagging rules in the SCIEX OS software, significantly reducing the data review time. Of the 7 compounds that did not have positive matches, 2 compounds did not trigger MS/MS acquisition, and 5 compounds had poor MS/MS spectral quality due to low sensitivity and matrix interferences. In the 1 ng/mL calibrator, all NPS showed positive library matches except for 4-AcO-EPT which did not trigger the EPI scan. Overall, the method showed sufficient sensitivity to obtain good MS/MS library matches even at trace levels of NPS in human whole blood

Conclusion
This technical note demonstrated:
- Broad applicability to NPS exhibiting a range of chemical and physical properties
- Chromatographic separation of 24 out of 29 isobaric groups, thereby minimizing false positives and false negatives. Most
of the co-eluting NPSs could be distinguished by unique MS/MS spectra - LOQs down to 0.1 ng/mL except for two compounds, demonstrating the sensitivity needed for forensic toxicology labs
References
- Shafi, A.; Berry, A.J.; Sumnall, H.; Wood, D.M.; Tracy, D.K. New psychoactive substances: a review and updates. Ther. Adv. Psychopharmacol. 2020, 10, 1-21. DOI: 10.1177/2045125320967197
- Krotulski, A.J.; Mata, D.C.; Smith, C.R.; Palmquist-Orlando, K.B.; Modell, C.; Vikingsson, S.; Truver, M.T. Advances in analytical methodologies for detecting novel psychoactive substances: a review. JAT 2025, 49(3), 152-169. DOI: 10.1093/jat/bkae098
Acknowledgements
The author would like to thank Alex Krotulski and Alberto Salomone for curating the list of relevant NPS and providing some of the standards used in these experiments.
Supporting information
Compound-specific parameters may be downloaded from SCIEX Now