Abstract
In this technical note, data-dependent acquisition (DDA) experimental data acquired by the ZenoTOF 8600 system were processed using MSDIAL 5.5 software to detect and identify lipid molecular species in human plasma samples. These results were compared to similar experiments performed on the ZenoTOF 7600 system.
Untargeted lipidomics workflows, such as DDA, are intended to identify as many lipids in a sample as possible. The extent of the lipidome's coverage reflects the method design and the analytical power of the mass spectrometer used to acquire data. Instrument sensitivity has the most significant impact on coverage by enabling the detection of low-level analytes. Collision-induced dissociation (CID) is the routine fragmentation mode for lipidomics experiments; however, a complementary fragmentation mode, electron activated dissociation (EAD), can provide additional diagnostic fragments that may improve the identification of lipids.
Here, the data show that the ZenoTOF 8600 system is approximately 10-fold more sensitive than a previous-generation high-resolution mass
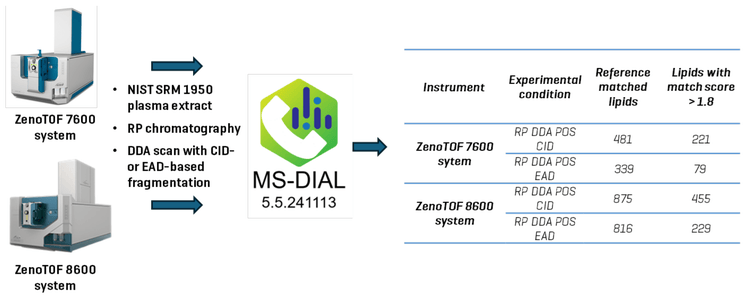
spectrometer, the ZenoTOF 7600 system. Using the ZenoTOF 8600 system, CID-based DDA lipidomics experiments (positive ion mode) using reversed-phase chromatography (RP) generated ~1.8-fold more identified lipids; EAD-based DDA experiments resulted in a 2.4-fold increase (Figure 1). The improved coverage may reveal new analytes relevant to biological studies and understanding the potential pathophysiology of human disease through biomarker analysis.
Key features of lipidomics analysis using the ZenoTOF 7600 system
- The ZenoTOF 8600 system is approximately 10-fold more sensitive than the ZenoTOF 7600 system, as evidenced by an improved S/N in TOFMS XIC peak areas
- Compared to the ZenoTOF 7600 system, the ZenoTOF 8600 system identified ~1,8-fold more lipids CID-based DDA experiments; EAD-based DDA experiments showed an improvement of 2.4-fold more lipids identified
- EAD analysis of lipids generated key, structurally diagnostic fragments that improved the specificity of lipid characterization
Introduction
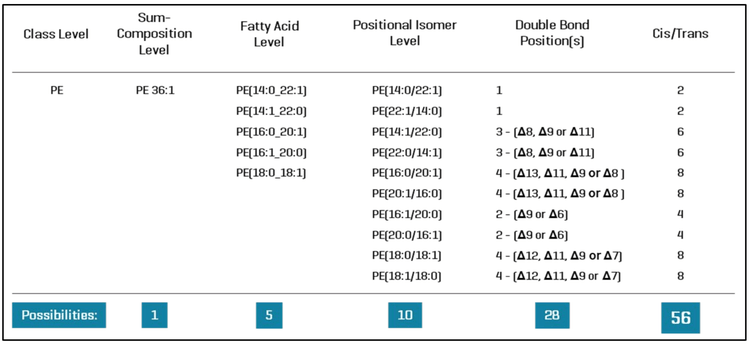
The analysis of lipids in biological samples is particularly challenging due to the sheer number of lipid molecular species (estimated to be more than 150,000), the extensive isobaric overlap among lipids, and the lack of sufficient primary and internal reference standards. Furthermore, the identification and quantitation of lipids are confounded by the level of structural specificity afforded by the analytical method used to measure these compounds. For example, the lipid PE 36:1 is defined by its sum composition (lipid class and the total number of carbons and double bonds); however, if analyzed at the fatty acid level of specificity, this apparently single lipid molecular species can be conservatively expanded to 5 lipids, as shown in Figure 2. A deeper structural elucidation reveals that the example lipid PE 36:1 can represent 56 different lipid molecular species when considering fatty acids, fatty acid positions, double bond positions and stereochemical configurations.
There is currently considerable interest in targeted lipid analysis. This workflow avoids the need for interpretive software, and the results are quantitative at the MS2 level(1). However, untargeted analytical approaches are still an important part of lipid analysis that potentially enable the discovery of novel lipid molecular species. The success of an untargeted lipidomics experiment depends on several factors, including chromatographic separation, primary reference standards, the level of structural specificity required, and instrument sensitivity. The last directly affects the quality of the product ion spectra generated during DDA analysis. Typically, the better the spectral quality (i.e., the breadth and intensities of fragments), the more likely a match can be made using lipid spectral databases.
There are different mass spectrometric workflows commonly used for untargeted lipidomics analysis. The original workflow, “shotgun lipidomics,” is a semi-targeted experiment that identifies lipids at the sum composition level by grouping lipids that undergo CID to generate lipid class-diagnostic fragment ions or neutral losses. DDA approaches can provide identification at the fatty acid level but can only quantitate at the precursor ion level; this is currently the most common approach. Finally, there is data-independent analysis (DIA; SWATH), which can simultaneously provide qualitative identification and quantitative measurement at the MS2 level. However, SWATH, in its current form, cannot resolve precursor ions to < 1 Da, which can result in a higher false positive rate compared to DDA experiments. Here, DDA experiments were used to evaluate the performance of a new high-resolution mass spectrometer, the ZenoTOF 8600 system.
The ZenoTOF 8600 system has unique design features that make it particularly suited for untargeted lipidomics analysis. First, the instrument has a complementary fragmentation mode, EAD, that provides unparalleled structural characterization of lipids (2-6). Using this fragmentation mode, lipids can be routinely identified at the fatty acid, positional isomer, and double bond position levels (Figure 2). Additionally, using EAD to determine the stereochemical configuration of the fatty acid double bonds is possible(5). Second, improved hardware, such as the front end with the Optiflow Pro source and an advanced optical detector, provides high sensitivity. Third, the instrument's front end is equipped with a DJET+ with Mass Guard, which has been shown to reduce instrument contamination on the SCIX 7500+ system (7), an important consideration for lipid analysis.
The experiments here analyzed human plasma (NIST SRM 1950) lipid extracts using DDA with CID- or EAD-based fragmentation in the positive ion mode. Lipids were resolved using RP chromatographic separation strategies, and the data were processed using MS-DIAL 5.5 software. The goal was to determine the differences between the ZenoTOF 8600 and 7600 systems on the lipid coverage in human plasma, compare the data quality, and measure the improvement in sensitivity for lipid analysis.
Materials and methods
Sample preparation: Human plasma (NIST SRM 1950) was obtained from Millipore Sigma (Burlington, MA), and lipids were extracted by the method of Bligh and Dyer (8). Extracts were dried down under a stream of nitrogen and resuspended in methanol for RP separation. The final concentration of extracts was 1 µl plasma/10 µl injection solvent. Samples were placed into HPLC vials and analyzed by mass spectrometry. 5 µl of plasma extract (0.5 µl plasma equivalent) was analyzed for all experiments.
Chromatography: Chromatographic separation was performed using an Exion AD system (SCIEX) comprising a binary ultrahigh pressure gradient pump with degasser, a temperature-controlled autosampler, and a column oven. Separation was performed using a Phenomenex Luna C18 column (2.1 µm, 150 x 2 mm) held at 55°C. Mobile phase A was water/acetonitrile/isopropanol (50/30/20, v/v) containing 10 mM ammonium acetate, and mobile phase B was isopropanol/acetonitrile/water (90/9/1, v/v) containing 10 mM ammonium acetate. The flow rate was 0.4 mL/min, and the gradient profile is shown in Table 1. Samples were kept in the autosampler at 10 °C, and the injection volume was 5 μL. It should be noted that HILIC chromatography was tried with this DDA approach (not shown). The results generated by RP chromatography afforded better coverage. Consequently, the results reported here are exclusively from RP separation.

Mass spectrometry: Lipid detection was performed on two instruments: a ZenoTOF 7600 system and a ZenoTOF 8600 system, both equipped with an Optiflow Turbo V ion source and an electrospray ionization (ESI) probe. Instrument calibration was maintained using the automated calibrant delivery system (CDS), which calibrated every five samples with an ESI calibration solution specific for positive or negative ionization modes. DDA and experiments were performed using CID-based fragmentation in the positive ion mode.
The systems were configured for CID-based DDA experiments to select the top 50 most abundant ions for fragmentation. For EAD experiments, DDA selection criteria were set to acquire the top 25 ions for fragmentation. Dynamic background subtraction (DBS) with a mass tolerance of 50 mDa was applied to both experiments to minimize noise and maximize the MS/MS quality. The TOF MS accumulation time was set to 100 ms. The TOF MS and TOF MS/MS parameters are shown in Table 2 for CID and EAD. Note that the parameter settings were the same for both instruments. A detailed description of the ZenoTOF 7600 system instrument parameters and their relevance to metabolomics and lipidomics DDA experiments has been previously published (9).
Data processing: All DDA data were processed using MS-DIAL 5.5 software (10). Optimal parameter settings for MS-DIAL software are presented in a recent SCIEX technical note (11). Lipid coverage determined from data generated by each instrument is given as

Results and discussion
Quantitative performance of the ZenoTOF 8600 system
The ZenoTOF 8600 system was designed with an optical detector that can process more ion current than the detector used in the ZenoTOF 7600 system. This ability, along with the upgraded front-end ion optics, imparts greater sensitivity to the instrument. To measure the impact of improved sensitivity on untargeted lipid analysis, two aspects of the data were considered: the increase in TOFMS peak intensities, measured using XIC peak areas with an extraction window of ± 0.010 Da, and the extent of lipid molecular species identified using MS-DIAL 5.5 software.
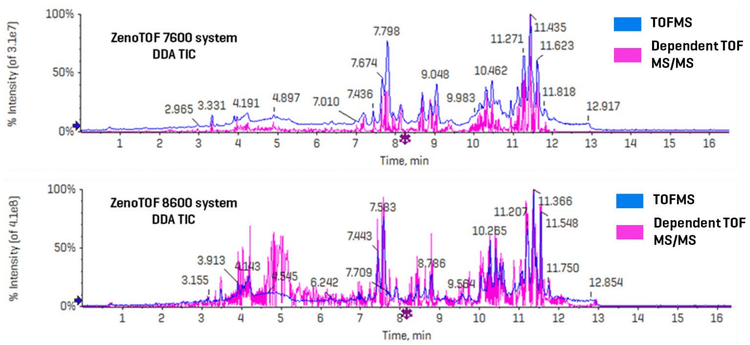
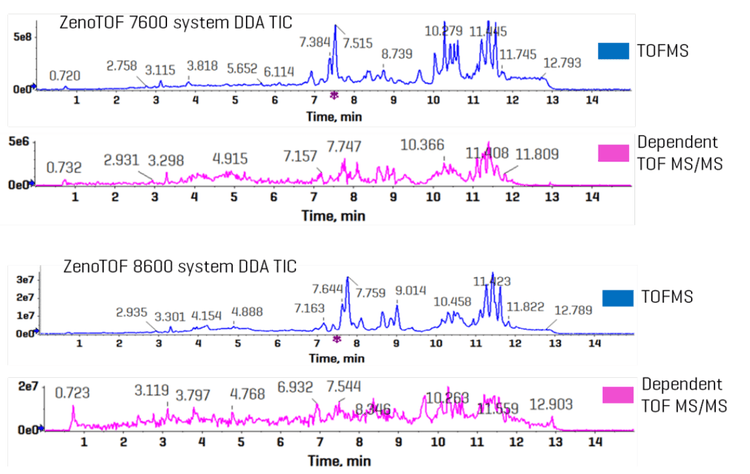
Figure 3 shows the combined TICs (TOFMS in blue and dependent product ion scans in pink) for the ZenoTOF 7600 and 8600 systems (top and bottom panels, respectively). A cursory inspection of each instrument’s TICs indicates an approximately 10-fold increase in ion intensity for the ZenoTOF 8600 system, reflecting the improved sensitivity of the instrument. This improvement caused a significant increase in the number of features acquired using the ZenoTOF 8600 system compared to the ZenoTOF 7600 system (25,816 vs. 12,482).
The 10-fold increase in peak intensity on the ZenoTOF 8600 system does not necessarily mean the instrument is 10-fold more sensitive.
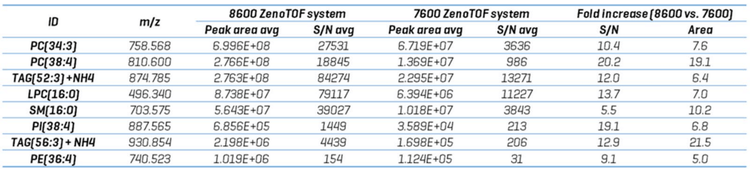
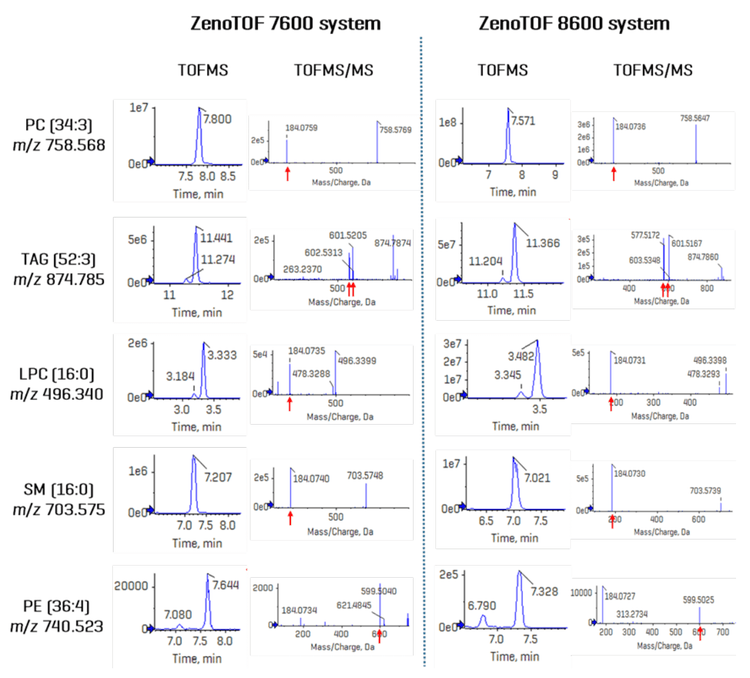
Sensitivity improvements should be reported in terms of an increase in the signal-to-noise ratio (S/N). Because DDA experiments are not quantitative at the TOF MS/MS level, sensitivity was assessed by comparing the TOFMS XIC peak intensities and their concordant S/N from lipid analytes detected on each instrument. Figure 4 shows the TOFMS XIC and TOF MS/MS spectra for 5 selected analytes. The left-hand panel shows results derived from CID-based data acquired on the ZenoTOF 7600 system; the right-hand panel shows the same data type for the ZenoTOF 8600 system. Key diagnostic fragment ions are indicated for each product ion spectrum, and the identity of each lipid, expressed in terms of sum composition, was confirmed using these fragments. Due to the extensive isobaric overlap among different lipid classes during RP separation, the MS/MS spectra can appear convolved due to multiple precursor ions being co-isolated during product ion analysis. (This is one of several reasons that DDA experiments are not quantitative at the MS/MS level of analysis.) However, using a narrow XIC window allows for the accurate isolation of precursors at the TOFMS level of analysis. In all five examples shown in Figure 4, the peak intensities are ~ 10-fold higher in data acquired using the ZenoTOF 8600 system. An evaluation of these and additional molecules with S/N calculations for each peak is presented in Table 3. The S/N was calculated using SCIEX OS software using the Explorer data analysis module and represent the average value for each analyte from n=5 injections. The noise region from each TOFMS XIC used to calculate the S/N was selected using the following criteria: the “blank” chromatographic region was > 1 min in length and within 3 min of the
targeted peak elution time, and the region needed to be devoid of any extraneous isobaric peaks. The S/N of the TOFMS XIC peaks was improved by an average of 12.9-fold (range = 5.5- to 20.2-fold) on the ZenoTOF 8600 system. This improvement is mirrored by the average 10.4-fold increase in peak intensities (range = 5.0- to 19.1-fold). Together, these data indicate that the ZenoTOF 8600 system provides greater sensitivity with a commensurate improvement in the number of dependent scans triggered during DDA analysis.
Identification of lipids using MS-DIAL 5.3 software
The improved sensitivity of the ZenoTOF 8600 system and the increased number of features should translate to better coverage of the lipidome from untargeted lipidomics experiments. In general, better sensitivity allows for detecting less prominent fragment ions, improving the quality of the product ion spectra and leading to a better match and more confident lipid identification. To test this hypothesis, DDA experiments were performed on the ZenoTOF 7600 and 8600 systems to compare the numbers of identified lipid molecular species in human plasma lipid extracts. Previously, it was reported that a top-50 approach was the best selection criteria for DDA metabolomics analysis (9). To ensure the best coverage possible for lipidomics, top-40, top-50 and top-60 DDA selection criteria approaches were used (not shown), and the top-50 DDA method was determined to be optimal for untargeted lipid analysis on the two systems.
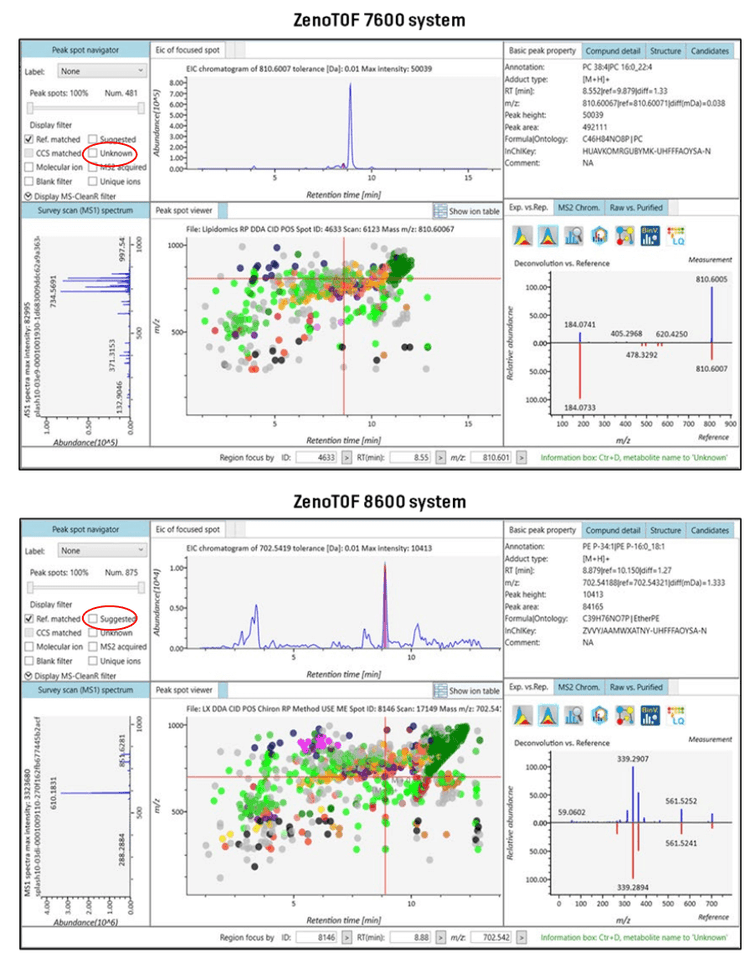
The MS-DIAL user interface provides a comprehensive view of the processed DDA data (Figure 5). The upper left-hand panel, the peak spot navigator, shows the number of reference-matched lipids identified from data processing. This is the total number of uniquely identified lipids from the batch process. The top panel of Figure 5 shows the results From the ZenoTOF 7600 system, and the lower panel shows the results from data acquired on the ZenoTOF 8600 system. The enhanced sensitivity of the latter instrument resulted in a 182% increase (~1,8-fold increase) in coverage of the human plasma lipidome in these experiments (875 vs. 481 reference-matched IDs). These identified lipids have match scores ranging from 2.6 to 0.6. From these and previous experiments (11), it was determined that a minimum match score of 1.8 gives the greatest confidence in the results. As shown in Figure 1, the reference-matched lipids with scores > 1.8 were 221 and 455 for the ZenoTOF 7600 and 8600 systems, respectively. This represents a 205% (~2-fold) increase in confidently identified lipids using the ZenoTOF 8600 system to analyze a 0.5 µl equivalent of human plasma in DDA experiments performed with CID-based fragmentation in the positive ion mode.
Characterization of lipids using EAD-based fragmentation
The data generated from CID-based analysis of lipids provides minimal structural information for lipids. In the positive ion mode, results are limited to sum composition, as shown in Table 4. This is because the loss of the phospholipid head group is the most favorable fragmentation event during CID; the fatty acids are lost as neutral species, and the complementary lyso-lipid fragments are typically low in abundance. In the negative ion mode, it is possible to identify lipids at the fatty acid level (see Figure 2); however, class distinction is not possible in this ionization mode, and class specificity relies on chromatography or other types of separation. EAD-based fragmentation is performed in the positive ion mode and provides information about the lipid class and the fatty acids, providing a near-complete structural characterization of lipids (5).
The ZenoTOF 8600 system's increased sensitivity was leveraged to analyze lipids with a DDA scan mode using EAD-based fragmentation. Compared to CID, EAD is relatively inefficient in terms of fragmentation, with only 30-40% of the precursor ion being depleted in a typical lipidomics experiment with the electron kinetic energy set to 15 eV. A distinct beneficial consequence of incomplete fragmentation of the precursor ion is that most fragments that are produced are primary fragments (i.e., fragments derived directly from the precursor ion). However, the low fragmentation efficiency makes the Zeno trap and the improved sensitivity of the ZenoTOF 8600 system key instrument attributes to generate high-quality EAD-based product ion spectra for lipid analysis.
Example TICs from EAD-based DDA experiments are presented in Figure 6. The top two chromatograms show the survey scan (TOFMS in blue) with its associated dependent scan in pink from data acquired on the ZenoTOF 7600 system. The TICs were separated in this figure due to the relatively large differences in scale between the two, which is not an issue with CID-based data (Figure 3). Below these panels are EAD-based DDA data acquired using the ZenoTOF 8600 system. The elution profiles look similar at the TOF MS and TOF MS/MS levels; however, the intensities of the peaks between the two instruments are quite different, with the ZenoTOF 8600 system displaying ~10 X greater intensities. To assess the quantitative differences between the two instruments using EAD-based fragmentation, the peak areas and their related S/N values were measured for a representative number of compounds (Table 4). As was seen with the CID-based fragmentation data, the ZenoTOF 8600 system is more sensitive at the MS1 level, as determined by comparing the S/N of analyte peaks generated from the two instruments. Data acquired on the ZenoTOF 8600 system had an average increased peak area of 23.8-fold (range = 2.3 – 54.9) and an average increase in S/N of 6-fold (range = 1.8 – 9.7). This is significant but somewhat lower than the ~10-fold increase in the CID-based data. This may be related to the classes of compounds selected for comparison. The three classes of compounds that had the lowest increases in S/N were acylcarnitines (CAR), diacylglycerols (DAG), and monoacylglycerols (MAG). The classes of molecules that showed
TOFMS survey scan independent of the fragmentation event, these data suggest there may be some compound dependency on sensitivity between the two instruments.
The EAD-based DDA data was processed using MS-DIAL 5.5 software with similar parameter settings as the CID-based data. Some notable exceptions were the use of a dedicated EIEIO library that contains in silico-generated EAD spectra for ~9000 lipids. Because most, if not all, CID-based fragments are also generated using EAD, the normal CID-based lipid database was also used for data processing. The number of identified lipids dramatically increased when plasma extract was analyzed using the ZenoTOF 8600 system compared to the ZenoTOF 7600 system (816 vs. 339), representing a 240% increase (Figure 1). The number of product ion spectra acquired was similar on both instruments (~3.5K), which is consistent with these being top-25 experiments rather than top-50 experiments used for the CID-based DDA analyses. This means improved lipid identification is likely due to better-quality product ion spectra, resulting in better database matching.
Spectral matching is a key component of compound identification. In lipidomics, a false positive rate to assess the data processing quality is not easily defined nor commonly used. Rather, confidence in identification is based on the similarity between spectra (i.e., reference vs. measured) and is quantified using a dot product score. This mathematical function generates a value between 0 and 1, with 1 indicating the highest level of similarity. In interpreting mass spectrometry data, this function assesses the similarity between the
number and intensities of fragment ions. MS-DIAL software uses a “match score” value to qualify an identified compound (12). This score is derived from the combination of the dot product score, the reverse dot product score, the RT similarity and the precursor mass similarity. Although it is not explicitly qualified in the literature, in this report and others (11), a match score value >1.8 is considered a strong match. For compounds with values below 1.8, manual verification may be warranted.
Figure 1 shows the number of lipids identified with a match score >1.8 on each instrument with the different fragmentation types. The ZenoTOF 8600 system not only generated more reference-matched IDs, but the identified lipids generally had higher match scores, potentially reflecting the higher quality product ion spectra generated on this instrument. The match scores were notably lower for each instrument’s respective EAD-based fragmentation data. This may be due to the lower fragment intensities in EAD-generated spectra, but it may also be because the EIEIO library was created in silico, and the number of fragments and their intensities may not necessarily match those of a spectrum acquired using authentic standards. This discrepancy should be reflected in the Dot Product score, with the score being lower as a consequence. For example, using the ZenoTOF 8600 system, a glycerophospholipid identified in the CID-based experiment as PE P-34:2 had a dot product score of 944. On the same instrument using EAD-based fragmentation, the compound was identified as PE (p-16:0_18:2), with a calculated dot product score of 598. Upon manual inspection, the diagnostic peaks are present in the measured spectrum, but their intensities are low compared to the reference spectrum (not shown).
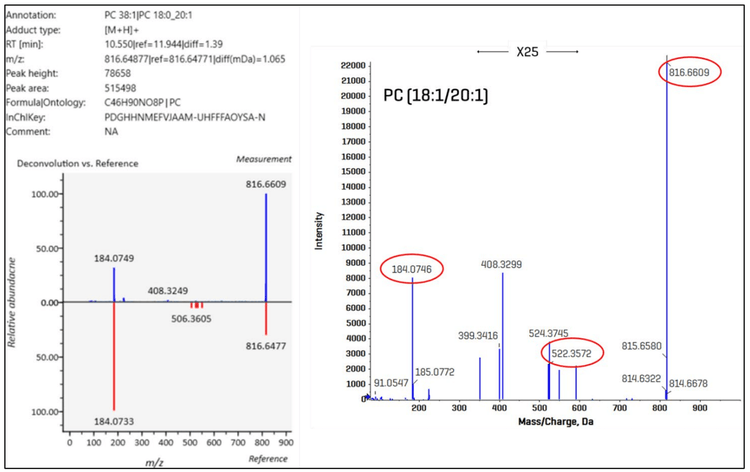
EAD-based fragmentation provides a product ion spectrum enriched with structurally diagnostic fragment ions (3-6, 11). Figure 7 shows the qualitative analysis of an example lipid molecular species. On the left side of the figure, the MS-DIAL user interface display for PC (18:0_20:1) is shown, which includes molecular details and an inverted display of the deconvoluted data vs. the reference spectrum. MS-DIAL identified the two fatty acids in this example but did not assign a regiospecific configuration. On the right side of the figure is the product ion spectrum of the molecule visualized within the Explorer module in SCIEX OS software. Highlighted in red are the diagnostic ions that can be used to further structurally characterize the PC molecule. Of note, the fragment at m/z 522.3572 results from the specific neutral loss of a 20:1 fatty aldehyde from the sn-2 carbon of the glycerol backbone(5), enabling the unambiguous identification at the positional isomer level as PC (18:0/20:1). Specific neutral losses and fragment ions associated with regiospecific fatty acids generated from complex lipids during EAD-based fragmentation have been identified and can be used for enhanced structural characterization (5).
In summary, the ZenoTOF 8600 system is ideal for untargeted lipidomics analysis. Its ability to perform 100 MS/MS operations per second and its ~10-fold greater sensitivity (as compared to the ZenoTOF 7600 system in terms of S/N at the MS1 level) enables excellent identification and coverage of lipids in human plasma. MS-DIAL 5.5 software provides a seamless pathway for data processing, and it can interpret EAD-based fragmentation data from DDA experiments to routinely identify lipids at the fatty acid level and the regio-specific and double bond position levels (Figure 2; 11).
Conclusion
- The ZenoTOF 8600 system is significantly more sensitive than the ZenoTOF 7600 system, with an approximately 10-increase in TOFMS XIC peak intensities and S/N
- More than double the features were acquired using the ZenoTOF 8600 system (~25 vs. ~12k) under similar experimental conditions
- The improved quantitative performance of the ZenoTOF 8600 system translates to improved lipid coverage for CID-based DDA lipidomics experiments in the positive ion mode; the instrument provided ~1.8-fold more reference-matched spectra in a direct comparison with the ZenoTOF 7600 system
- MS-DIAL 5.5 software can routinely process WIFF2 files derived from CID-based fragmentation experiments on SCIEX instrume
- MS-DIAL 5.5 software has the unique capability to process EAD-based fragmentation data with its in silico-generated EIEIO spectral database
- EAD-based fragmentation DDA experiments performed on the ZenoTOF 8600 identified 240% more IDs than the ZenoTOF 7600 system and provided additional structurally diagnostic fragments to identify lipids with a high level of structural specificity
References
- Zhang, Z., Singh, M., Kindt, A., Wegrzyn, A. B., Pearson, M. J., Ali, A., Harms, A. C., Baker, P., & Hankemeier, T. (2023). Development of a targeted hydrophilic interaction liquid chromatography-tandem mass spectrometry based lipidomics platform applied to a coronavirus disease severity study. Journal of chromatography. A, 1708, 464342. https://doi.org/10.1016/j.chroma.2023.464342
- Baker, P. R., Proos, R., Seferovic, M. D., & Horvath, T. D. Quantitative analysis and structural characterization of bile acids using the ZenoTOF 7600 system. SCIEX technical note MKT-30747-A, https://sciex.com/tech-notes/life-science-research/metabolomics/quantitative-analysis-and-structural-characterization-of-bile-ac
- Baba, T., Campbell, J. L., Le Blanc, J. C., & Baker, P. R. (2016). In-depth sphingomyelin characterization using electron impact excitation of ions from organics and mass spectrometry. Journal of lipid research, 57(5), 858–867. https://doi.org/10.1194/jlr.M067199
- Baba, T., Campbell, J. L., Le Blanc, J. C., & Baker, P. R. (2016). Structural identification of triacylglycerol isomers using electron impact excitation of ions from organics (EIEIO). Journal of lipid research, 57(11), 2015–2027. https://doi.org/10.1194/jlr.M070177
- Baba, T., Campbell, J. L., Le Blanc, J. C. Y., Baker, P. R. S., & Ikeda, K. (2018). Quantitative structural multiclass lipidomics using differential mobility: electron impact excitation of ions from organics (EIEIO) mass spectrometry. Journal of lipid research, 59(5), 910–919. https://doi.org/10.1194/jlr.D083261
- Baba T, Campbell JL, Le Blanc JCY, Baker PRS. Distinguishing Cis and Trans Isomers in Intact Complex Lipids Using Electron Impact Excitation of Ions from Organics Mass Spectrometry. Anal Chem. 2017 Jul 18;89(14)//doi: 10.1021/acs.analchem.6b04734
- Selen, E., Baghla, R., Moore, I., Galermo, E., Zhang, Z., and Jones, E. Redefine bioanalysis with enhanced robustness on the SCIEX 7500+ system. SCIEX technical note MKT-31350-A. https://sciex.com/tech-notes/pharma/bioanalysis-pk/redefine-bioanalysis-with-enhanced-robustness-on-the-sciex-7500-plus-system
- BLIGH, E. G., & DYER, W. J. (1959). A rapid method of total lipid extraction and purification. Canadian journal of biochemistry and physiology, 37(8), 911–917. https://doi.org/10.1139/o59-099
- Baker, PRS. and Proos, R. Untargeted data-dependent acquisition (DDA) metabolomics analysis using the ZenoTOF 7600 system. SCIEX technical note RUO-MKT-02-15367-A. https://sciex.com/tech-notes/life-science-research/metabolomics/untargeted-data-dependent-acquisition--dda--metabolomics-analysiTakeda, H., Matsuzawa, Y., Takeuchi, M., Takahashi, M., Nishida, K., Harayama, T., Todoroki, Y., Shimizu, K., Sakamoto, N., Oka, T., Maekawa, M., Chung, M. H., Kurizaki, Y., Kiuchi, S., Tokiyoshi, K., Buyantogtokh, B., Kurata, M., Kvasnička, A., Takeda, U., Uchino, H., … Tsugawa, H. (2024). MS-DIAL 5 multimodal mass spectrometry data mining unveils lipidome complexities. Nature communications, 15(1), 9903. https://doi.org/10.1038/s41467-024-54137-w
- Ozbalci, C., Chiapparino, A., Duban-Deweer, S., Hachani, J., Saint-Pol, J., and Baker, PRS. The simultaneous processing of DDA and SWATH data by MS-DIAL software improves coverage for untargeted lipidomics analysis. SCIEX technical note MKT-33774-A. https://sciex.com/tech-notes/life-science-research/lipidomics/The-simultaneous-processing-of-DDA-and-SWATH-data-by-MS-DIAL-software-improves-coverage-for-untargeted-lipidomics-analysis
- Tsugawa, H., Cajka, T., Kind, T., Ma, Y., Higgins, B., Ikeda, K., Kanazawa, M., VanderGheynst, J., Fiehn, O., & Arita, M. (2015). MS-DIAL: data-independent MS/MS deconvolution for comprehensive metabolome analysis. Nature methods, 12(6), 523–526. https://doi.org/10.1038/nmeth.3393