Abstract
This technical note details instrument settings and best practices for untargeted metabolomics using the ZenoTOF 7600 system. The ion flow path of this instrument is different from any other QTOF instrument available. Therefore, untargeted metabolomics method development requires unique instrument settings to achieve success. Here, appropriate parameter settings are provided and these settings are explained in the context of how the device functions and is designed. Understanding how the hardware is used to generate untargeted metabolomics data can dramatically improve data quality and increase the number of metabolites detected and identified during data processing.
Introduction
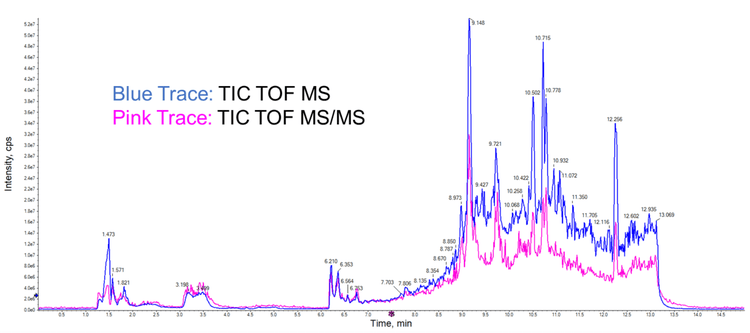
Ideally, untargeted metabolomics experiments are designed to detect and potentially quantify all biomolecules in a sample. These data represent a snapshot of the metabolic state of the organism studied. A typical results file for DDA metabolomics analysis is shown in Figure 1. In practice, the quality of the data and the extent of metabolite coverage depend on the parameter settings used on the instrument and the experimental method. For targeted analysis experiments, in which internal and primary reference standards are typically available, instrument parameter settings can be optimized empirically. In contrast, generalized parameter settings are required for global analysis to maximize coverage of the diverse compounds present in the biome.
Key features of untargeted metabolomics analysis using the ZenoTOF 7600 system
- The unique instrument design that enables electron-activated dissociation (EAD) and the use of the Zeno trap requires specific instrument parameter settings for untargeted metabolomics
- Parameter setting suggestions and their detailed explanations are provided to optimize metabolomic coverage and spectral quality
- The untargeted metabolomics method described here leverages the speed and sensitivity of the ZenoTOF 7600 system to maximize throughput while maintaining data quality
Methods
Sample preparation: NIST SRM 1950 plasma was extracted using 4 volumes of methanol. After centrifugation to separate the precipitated proteins, the supernatant was analyzed directly.
Chromatography: Samples were analyzed using an ExionLC system with a Kinetex F5 column (2.1 × 150 mm, 1.7 µm, Phenomenex). A simple linear gradient from 0 to 95% B was used with standard reversed phase mobile phases (A = 0.1% formic acid in water and B = 0.1% formic acid in acetonitrile) with a flow rate of 200µL/min. A 1µL injection volume was used and the column temperature was maintained at 30°C throughout the analysis. The total run time was 15 min.
Mass spectrometry: The extracted sample was analyzed on the ZenoTOF 7600 system equipped with the OptiFlow Turbo V ion source. Data were collected using DDA methods designed to vary from top 20 to top 100 candidate ions, with dynamic background subtraction (DBS), and exclusion criteria of 6s after 3 occurrences, both activated and deactivated. The TOF MS accumulation time was set to 100 ms, and a collision energy (CE) of 30 V was used. A 5 ms accumulation time was used for TOF MS/MS experiments.
Data processing: All data were analyzed using the Analytics module in SCIEX OS software. The MS/MS spectra were compared to the library spectra using version 2.0 of the SCIEX All-in-One and SCIEX Accurate Mass Metabolite spectral libraries and the NIST 17 spectral library.

Mass spectrometry: Extracted sample extracts were analyzed using the ZenoTOF 7600 system with an OptiFlow Turbo V ion source and a QTrap 7500 system with an OptiFlow Pro Turbo V ion source using a scheduled, high-resolution multiple reaction monitoring (sMRMHR) or a scheduled multiple reaction monitoring (sMRM) scan mode, respectively. In some cases, a pseudo-MRM transition was used (i.e., precursor ion to precursor ion). On the QTRAP 7500 system, these molecules were quantitated at the MS/MS level with low CE. However, for the data acquired for these bile acids on the ZenoTOF 7600 system, the TOFMS data were used.
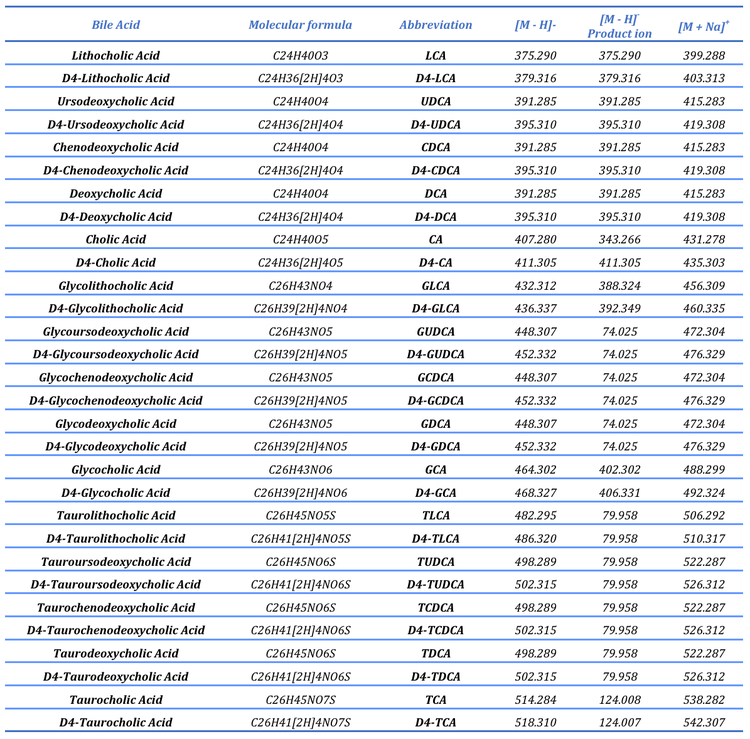
To structurally characterize bile acids, an MRM-triggered datadependent acquisition (DDA) scan mode was used to acquire EADbased product ion spectra in the positive ion mode (standards only). Although EAD-based fragmentation is possible in the negative ion mode, it is relatively inefficient compared to the positive ion mode; consequently, the EAD-based analysis was performed in the positive ion mode. Because bile acids are anionic, the sodium adduct for each was was monitored and isolated for fragmentation. A summary of the MS instrument parameters is presented in Tables 2 and 3, and a comprehensive list of the compounds studied is shown in Table 4.


Instrument calibration
The first step in developing an untargeted metabolomics method is to ensure that the ZenoTOF 7600 system is operating at peak performance. Instrument performance depends on several factors but can be distilled down to 2 requirements: 1) the instrument must be correctly calibrated, and 2) it must be free from contamination. Below are steps that should be taken before any analytical experiments are performed.
- Open the MS Tuning tab
- Every 1-2 weeks, run EI Background Reduction to help clean the EAD cell, even if the EAD fragmentation function has not been used. The precursor ions travel through the EAD cell to get to the CID portion of Q2 and, subsequently, to the accelerator, TOF and detector. If the EAD cell is dirty, it may affect the sensitivity and resolution of the system in CID mode.
- Every day, run MS Quick Check for the polarity that will be used. When using the TwinSpray ion source, there is no need to change any source parameters from the default settings. However, if using the OptiFlow Turbo V ion source, the source temperature should be changed to 500°C. Important note: Changing this value in the box does not change the temperature setting in real time. To implement this change, proceed to Step 2-Achieve Stable Signal, change the value from 200°C to 500°C, then click in another of the setting boxes. Press Stop, click on Step 1, then click Next to proceed back to Step 2. The value will then be appropriately set to 500°C. The system might take a couple of minutes to equilibrate to the new temperature.
- During the MS Quick Check, observe the intensity of the MS/MS product ion when the Zeno trap is deactivated (m/z 520 in the negative ion mode or m/z 494 in the positive ion mode). Ideally, this signal must be above 1e5 counts per second (cps). If the Zeno trap is activated during this step, the signal will be variable because it depends on the MSlevel sensitivity as a function of different ion transmission control (ITC) values and therefore will not be consistent over time. Save the tuning reports to a dedicated folder so that the signal of this third ion can be tracked as a measure of overall instrument performance.
- If the mass accuracy calibration fails (for example, is >2 ppm) but is outside the tolerance range (for example, within 4 ppm), the system is likely suitable to use. The in-run calibration employs a mass tolerance range of 5 ppm.
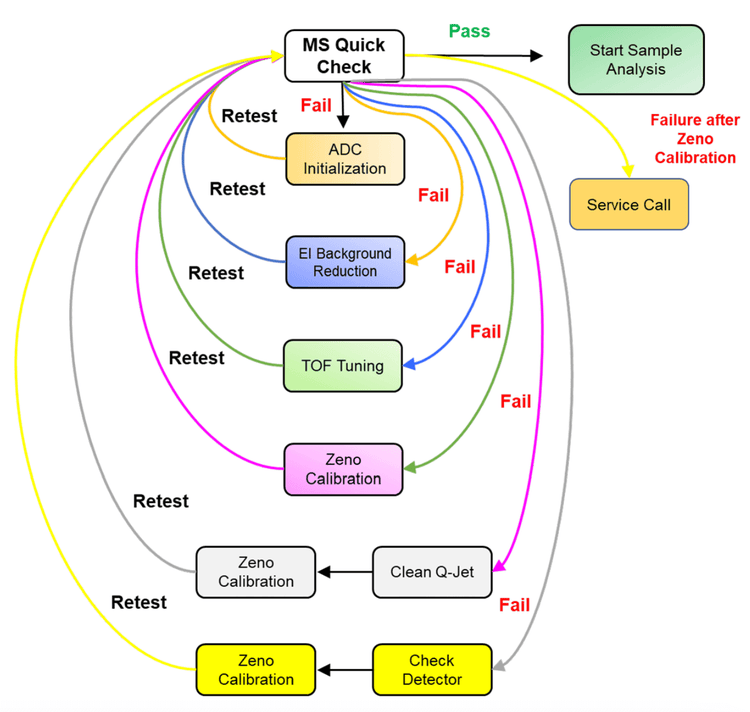
- If the sensitivity or resolution fails during calibration, perform the ADC Initialization and run EI Background Reduction, followed by TOF Tuning. These functions all appear in the MS Tuning tab. Below are the steps to take in response to failures during calibration. Note: If there is a need to proceed to steps (e) and (f), these steps can be performed in any order, depending on timing constraints and familiarity with venting and cleaning the QJet. A flow chart is presented in Figure 2 that summarizes these actions.
- a. ADC Initialization. ADC initialization re-establishes proper communication between the detector and the computer. Once reset, rerun MS Quick Check. If it passes, then start sample analysis. If it fails, proceed to step (b).
- b. EI Background Reduction. The Background Verification Level process will almost always fail the first time. Press next and perform the Background Reduction Scan. The signal should decrease significantly over the first few minutes. After 5-10 minutes, press Next to proceed to the final check. Save the tuning report, including the optional steps. Re-check MS Quick Check. If it passes, then start sample analysis. If it fails, proceed to step (c).
- c. TOF Tuning. Select TOF tuning and allow the process to proceed. Re-run MS Quick Check. If it passes, then start sample analysis. If it fails, proceed to step (d).
- d. Zeno Calibration. After TOF Tuning, the Zeno trap should be re-calibrated by clicking Zeno Calibration. Once this test is complete, run MS Quick Check again. If the instrument fails this last check, please clean the Qjet.
- e. QJet Cleaning. If the instrument sensitivity test still fails, vent the system and clean the curtain plate, the orifice plate and the QJet. SCIEX has an official QJet cleaning procedure and detergent, bags and brushes. Do not perform any cleaning or maintenance of the instrument beyond the QJet. Once vented, the QJet is cleaned and the instrument is reassembled, the system will need time (2 - 8 min) to re-achieve the suitable operating vacuum pressure in the TOF chamber. After restarting and allowing the pressure to stabilize, run ADC Initialization and run MS Quick Check.
- f. Detector Optimization. If the instrument fails the sensitivity test after re-running MS Quick Check, then run Detector Optimization. This test varies the voltage on the detector to ensure it is held at the correct voltage. As detectors age, the voltage required to maintain sensitivity increases. There is a voltage limit and the detector must be replaced when the limit is reached. In this situation, the analytical quadrupoles or other ion path components might also be contaminated and deep cleaning will need to be performed by a service engineer.
ZenoTOF 7600 system hardware configuration
The functions and mechanisms of several features on the ZenoTOF 7600 system will be explained here to better understand how specific parameter settings are set to optimally run untargeted metabolomics in a DDA experiment using the information-dependent acquisition (IDA) scan mode. Figure 3 shows the assembly of the primary ion rail components, through which the ions flow from left to right. As with all LC-ESI MS/MS instruments, ions are generated in the source, the ion beam is created and refined in the interface region, which comprises the QJet and Q0 region, and ions are selected for product ion analysis in Q1. In the ZenoTOF 7600 system, ions leave Q1 and enter the EAD cell, which can trap and fragment ions or transfer precursor ions to Q2 for CID-based fragmentation. In either case, fragment ions enter the Zeno trap, where they are collected and sent to the TOF accelerator in a mass-dependent manner. EADbased fragmentation will not be discussed in the context of untargeted metabolomics in this technical note.
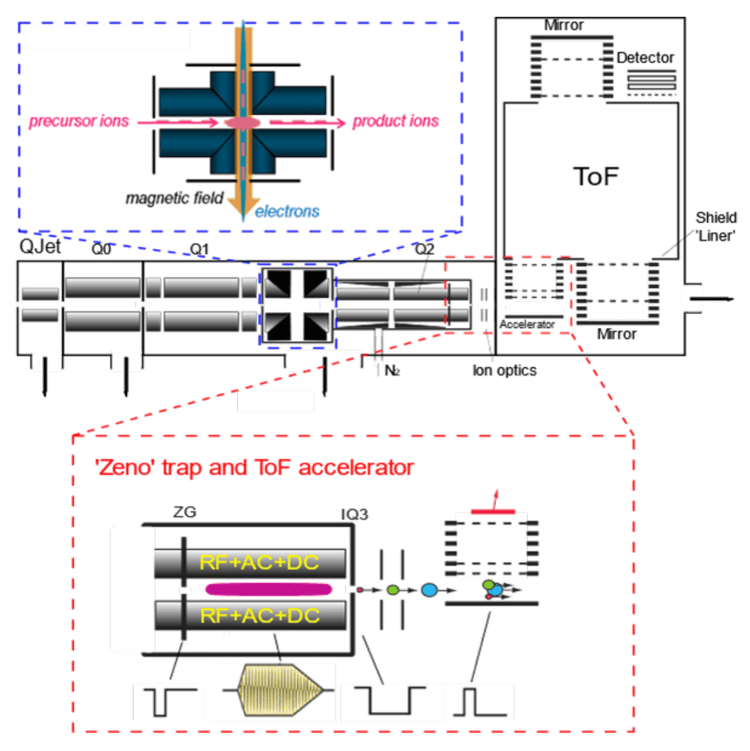
QJet and Q0 region, and ions are selected for product ion analysis in Q1. In the ZenoTOF 7600 system, ions leave Q1 and enter the EAD cell, which can trap and fragment ions or transfer precursor ions to Q2 for CID-based fragmentation. In either case, fragment ions enter the Zeno trap, where they are collected and sent to the TOF accelerator in a mass-dependent manner. EADbased fragmentation will not be discussed in the context of untargeted metabolomics in this technical note.
The Zeno trap functions by trapping ions generated by EAD- or CID-based fragmentation. The Zeno trap is not used during TOF MS scans because the ion current is already attenuated via ion transmission control (ITC) and the likelihood of detector saturation is high. Once the ions are trapped (t < 1 ms), they are sequentially scanned from the trap to the TOF accelerator in a mass-dependent manner. High molecular weight ions are scanned out first and are followed by lower molecular weight ions, such that they all arrive at the TOF accelerator at the same time. This eliminates the mass intensity bias that results in other instruments only taking a portion of the fragment ions. Once the ions are accelerated into the TOF, the Zeno trap fills and repeats the cycle. This process improves the instrument duty cycle and ~90-95% of all fragment ions hit the detector.
A key parameter to consider regarding the Zeno trap is the Zeno threshold, which is a measure of the precursor ion intensity. If the precursor ion intensity is below this value, the Zeno trap is used and fragment ions from that precursor ion are trapped and sent to the TOF accelerator. If the precursor ion intensity is above the threshold value, the Zeno trap is not used. In this case, the fragment ions that hit the detector without the Zeno trap activated are scaled according to the set Zeno calibration values. Therefore, the visualized data are corrected to what the intensity would have been if the Zeno trap had been used.
Parameter settings for DDA experiments
The parameter settings for untargeted metabolomics on the ZenoTOF 7600 system will differ from those used on other SCIEX instruments. The primary reason for this is that the ion path is different from other instruments due to the incorporation of the EAD cell and the Zeno trap. For example, the EAD cell and the Zeno trap occupy a portion of Q2 and therefore make the collision cell shorter. Consequently, the collision energy (CE) parameter setting should be higher than that used on other SCIEX instruments to compensate for the shorter collision cell dimensions.
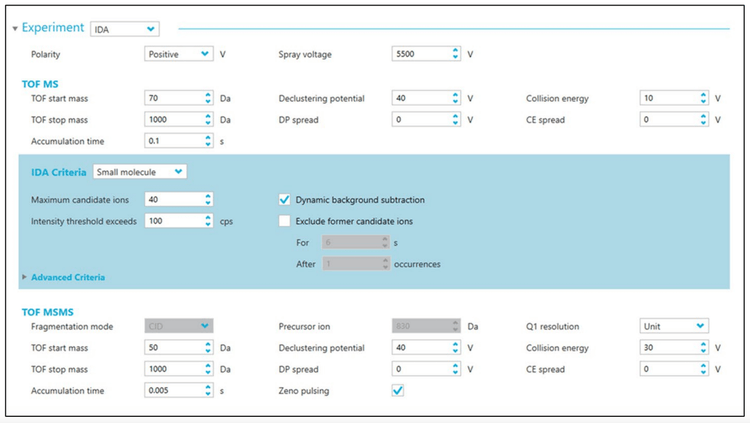
Figure 5 shows a screencap of the parameter settings that were optimized for untargeted metabolomics on the ZenoTOF 7600 system in the positive ion mode. For the experiments performed in the negative ion mode, the absolute value for each setting is the same and further discussion points are provided below. In the sections below, many of the critical parameters are discussed, starting with source parameters.
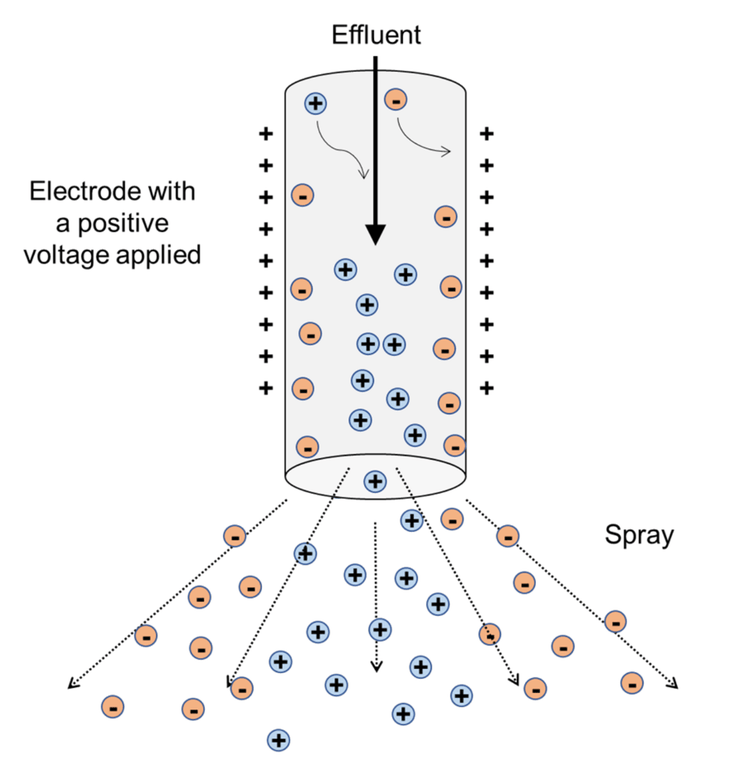
Spray voltage. Typically, the ESI voltage is set at or near its maximum. It is essential to recognize that during ionization, both positive and negative ions are produced (conservation of charge). If a positive voltage is applied (for example, in positive ion mode), positive ions will migrate toward the center of the effluent stream and negative ions will migrate toward the walls of the electrode (Figure 4). When the spray is created, the plume is not homogenous. Negative ions will be at the outside edges of the plume and positive ions will be at its center. This segregation of the ions makes it essential to always adjust the position of the probe on the ZenoTOF 7600 system. The position of the OptiFlow Turbo V ion source does not need to be adjusted, however, because its geometry is already optimized. Other key source parameters include the nebulizing gas (GS1), which affects droplet size, and the drying gas (GS2), which evaporates the solvent to generate gas-phase ions. Subtle changes in either or both parameters can affect instrument sensitivity. In samples with heavy matrix contamination, as is common in metabolomics experiments, one can slightly lower the ESI voltage to reduce the ionizing species that come from the matrix. With a high voltage setting, highly ionizable species in the matrix may crowd out the lower ionizable species and suppress the analyte signal.
Declustering potential. The declustering potential (DP) is the voltage potential between the orifice and the front of the QJet. It acts as the motive force to draw ions into the instrument and helps disrupt any solvent clusters surrounding the ions. If the DP setting is too high, it can lead to source fragmentation. For both the TOF MS and the dependent TOF MS/MS portions of the DDA experiment, the DP should be set to 40 V in untargeted metabolomics experiments. Ion intensity does not change significantly with changes to DP but a higher setting (~60 V) might be preferred for larger compounds. In contrast, small molecules such as amino acids, are better analyzed at a lower DP (~20 V). The 40 V setting is a middle ground and gives the best results for a diverse set of analytes. The parameters below affect the ion flow through and fragment generation by the ZenoTOF 7600 system. Differences between TOF MS and TOF MS/MS experiments are explained.
Collision energy. The collision energy (CE) setting affects the acceleration of ions through Q2. During CID, CE is responsible for imparting enough energy to the ions to fragment when they collide with nitrogen in the collision cell. However, CE also serves as a motive force for ions in non-MS/MS experiments. For the TOF MS survey scan in the DDA method, note that the CE is set to 10 V, even though no fragmentation is desired. As ions move along the ion path, they cool down. This is notable at the entrance to Q2, where nitrogen gas is present and collisional cooling is significant. By adding a small amount of CE voltage, the ions are pushed through Q2 without significant fragmentation and arrive at the TOF accelerator.
The CE voltage is set to 30 V for CID-based MS/MS analysis. This value gives similar MS/MS spectra to the SCIEX metabolomics library collected using SCIEX TripleTOF systems (4600, 5600 and 6600 series). These instruments were run at 35 V with a collision spread of 15-20 V. Note that on the ZenoTOF 7600 system, the CE spread is set to 0, meaning that all the spectra will be acquired at the designated 30 V. The main reason for this, compared to the instrument settings using the TripleTOF systems, is that it takes approximately 15-20 ms to enable the CE spread function. The ZenoTOF 7600 system significantly improves the instrument duty cycle, sensitivity and detection of low m/z fragments. It was more advantageous to shorten the accumulation time and decrease the cycle time to improve coverage, than it was to use a collision energy spread.
Accumulation time. For global metabolomics experiments, accumulation time is one of the most important parameters to consider. In general, increasing accumulation time will improve the signal-to-noise ratio (S/N), which improves the quality of the MS and MS/MS spectra. Higher-quality spectra generally have increased library hits. However, if the accumulation time is too long, the cycle time of the DDA experiment is extended and fewer MS/MS spectra are acquired. For the MS TOF experiments, it was empirically determined that the best balance is achieved using 0.100 s (100 ms) for untargeted metabolomics experiments. At the MS/MS level, it was determined that 5 ms is the best accumulation time. Although the latter setting might seem too small, the ZenoTOF 7600 system was designed to be fast (133 CID MS/MS per second, 133 Hz). The 8- to 10-fold improvement in the instrument duty cycle from the Zeno trap compensates and enables high-quality MS/MS spectra at highspeed acquisition rates. In general, with this instrument, faster accumulation times are better and there do not appear to be significant gains in spectral quality at accumulation times >10 ms.
Zeno pulsing. The function of the Zeno trap is explained above. By clicking the Zeno pulsing box, the Zeno trap will be activated, provided that the precursor ion intensity is below the set Zeno threshold. For untargeted metabolomics experiments, it is recommended that the Zeno threshold is set to 20,000 cps.
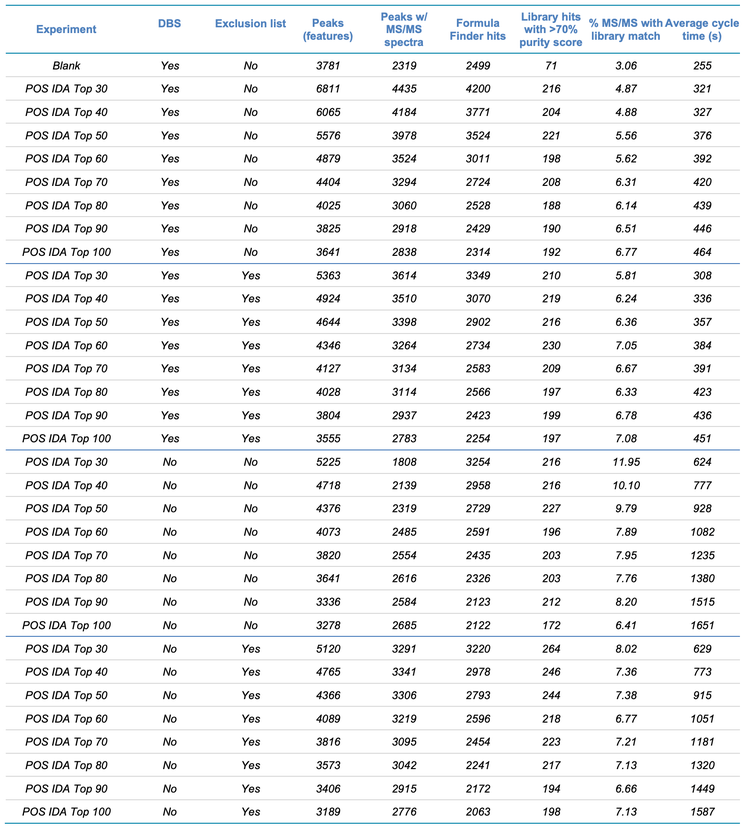
IDA criteria. One of the more challenging aspects of any DDA experiment is selecting the optimal settings that control which precursor ions are selected for subsequent MS/MS analysis. In SCIEX DDA experiments, this group of parameters is controlled by the IDA criteria panel (Figure 4, blue box). To determine the best IDA criteria parameter settings, a series of experiments was performed to vary the maximum number of candidate precursor ions per cycle (“maximum candidate ions”), whether DBS was used and whether exclusion criteria were enforced (Table 1). In all experiments, the TOF MS and TOF MS/MS instrument parameter settings were set, as shown in Figure 4.
The comprehensive dataset shown in Table 1 is separated into 4 sections, divided by the darker lines within the table. Each section shows 8 experiments that were performed in the positive ion mode, in which the maximum number of candidate ions was varied from the top 30 to 100 candidates. The 4 sections differ by whether DBS and/or exclusion criteria were applied. Each variable and its effects on the data are discussed below. For this type of experiment, no advanced IDA criteria parameters are used.
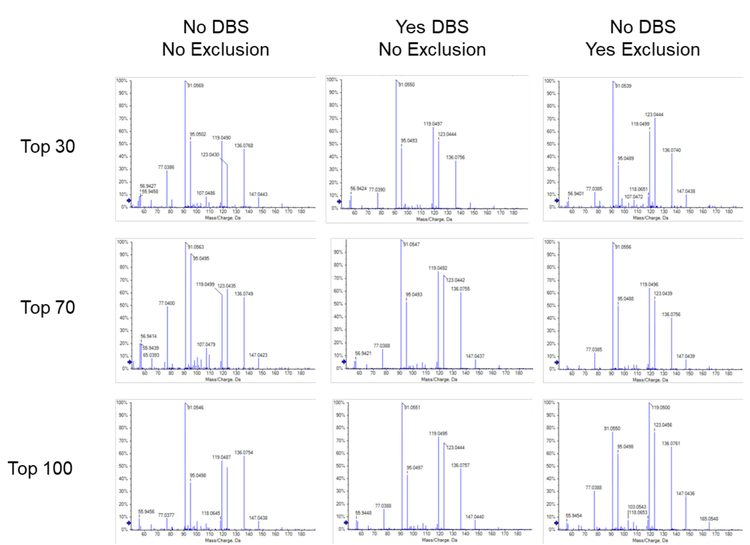
- Maximum candidate ions. Ideally, DDA experiments are designed to maximize the coverage of unknown molecules while still maintaining high MS/MS spectral quality. Balancing coverage and spectral quality are most affected by the number of candidate ions chosen. Table 1 shows the numbers of peaks (features) detected, peaks detected that generated MS/MS spectra, Library and Formula Finder hits and the average cycle time as a function of candidate ions. Figure 6 shows a comparison of the MS/MS spectral quality for tyrosine acquired with 30, 70 and 100 candidate ions selected. From these data, the best number of candidate ions was determined to be between 30 and 50. As the number of candidate ions increased above 50, the number of features identified decreased.
- Dynamic background subtraction. DBS is a function that improves the detection of precursor ions in a DDA experiment. The algorithm creates an extracted ion chromatogram (XIC) of the candidate ion over the preceding data points. It takes the first derivative of the curve and determines whether the candidate ion is at the apex of the first derivative. If it is at the apex, the MS/MS-dependent scan will be triggered. This algorithm is designed for small molecules and minimizes redundant MS/MS collection. Additionally, it reduces background contamination from triggering dependent MS/MS scans.
- Exclusion criteria. Exclusion criteria are parameters that limit redundant MS/MS spectra from individual precursor ions. At least 1 MS/MS scan should be triggered near or at the apex of the peak. If a product ion scan is triggered from a candidate ion, that precursor ion will be ignored for the exclusion period, which should be entered as half of the peak width in seconds. Typically, this exclusion is triggered after 1 or 2 triggered MS/MS scans. This feature works well for large- and small-molecule applications.
Conclusion
- Source parameters, including the probe position, drying and nebulizing gases and the electrospray voltage on the ZenoTOF 7600 system must be optimized for untargeted metabolomics experiments. The optimization of these parameters can be affected by the flow rate and the matrix composition of the sample.
- Due to the unique hardware configuration of the instrument, parameter settings, such as collision energy and accumulation, must be adjusted to accommodate diverse metabolites
- The ZenoTOF 7600 system is ideal for untargeted metabolomics due to its speed, sensitivity, and ability to perform complementary EAD experiments