Abstract
This technical note demonstrates the power and capability of the ZenoTOF 8600 system to sensitively detect, quantify, and structurally characterize the bile acid content in human plasma.
The analysis of bile acids in human samples has become increasingly important as insights into the prominent biological role of this class of molecules are discovered [1,2]. Analysis of bile acids by triple-quadrupole MS (TQMS) systems is challenging because of the high chemical background found in several precursor ions to precursor ion-based multiple-reaction monitoring (MRM) transitions used in current state-of-the-art assays (1-4). High-resolution mass spectrometry (HRMS) enables the extraction of fragment ions with a narrow mass-to-charge (m/z) window, which can reduce background chemical interferences and improve the signal-to-noise (S/N) of the assay as previously demonstrated [3].
The detection of individual bile acid isomers currently depends on chromatographic resolution because collision-induced dissociation (CID)-based fragmentation cannot distinguish these isomeric metabolites. However, a novel fragmentation method, electron-activated dissociation (EAD) can generate unique fragments, even among isomers that may help reduce the time required for analysis.
Here, the ZenoTOF 8600 system was used to quantify the bile acid content of human plasma sample extracts using both CID- and EAD-based fragmentation methods. EAD-based fragmentation was strategically used when isomeric pairs overlapped to provide specificity and enable faster analysis times.
Key features of bile acid analysis on the ZenoTOF 8600 system
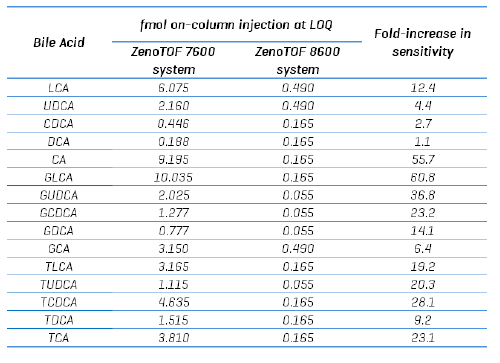
- The ZenoTOF 8600 system can detect and quantify bile acids with an approximately 12-fold better sensitivity than the ZenoTOF 7600 system
- The narrow fragment ion extraction window possible with HRMS improves assay sensitivity by reducing background chemical interferences and, consequently, increases the S/N of the assay
- EAD can generate diagnostic fragment ions to enable the distinction between bile acid isomers, which improves the overall specificity and speed of the analysis
Introduction
Bile acids are amphipathic steroidal molecules synthesized in the liver from cholesterol and play a crucial role in the digestion and absorption of dietary lipids [1]. Primary bile acids, such as cholic acid and chenodeoxycholic acid, are conjugated with glycine or taurine before being secreted into bile. Once released into the intestinal lumen, these acids undergo microbial transformation to form secondary bile acids like deoxycholic acid and lithocholic acid that are collectively termed microbially conjugated bile acids (MCBAs). Enterohepatic circulation maintains a dynamic balance of bile acid synthesis, secretion, reabsorption, and excretion. Beyond their digestive functions, bile acids are now recognized as signaling molecules involved in metabolic regulation and immune responses, acting through nuclear receptors such as FXR and membrane-bound G-protein coupled receptors [2].
Mass spectrometry (MS) has become the analytical method of choice for the quantitation and profiling of bile acids due to its sensitivity, specificity, and ability to differentiate structurally similar compounds. [3-5] The use of HPLC ESI-MS/MS allows for the simultaneous detection of multiple bile acid species, including conjugated and unconjugated forms, in biological matrices such as plasma, bile, and feces. Targeted MS approaches using multiple reaction monitoring (MRM) provide high-throughput and quantitative data essential for clinical and research applications in liver disease, metabolic disorders, and gut microbiome studies.
Recently, we reported the analysis of bile acids using the ZenoTOF 7600 system, which is a hybrid quadrupole time of flight instrument (QTOF) that measures compounds with high resolution (~35K) and mass accuracy (<2 ppm) [TN ref]. In the negative ion mode, bile acid analysis by nominal mass instruments is challenging due to solvent-based high chemical background noise. With accurate mass systems, this issue can be mitigated using narrow product ion extraction windows (XIC), which minimize noise and enable a similar calculated LOQ for the ZenoTOF 7600 system as with the highly sensitive triple quadrupole SCIEX 7500 system. Using the ZenoTOF 8600 system, these studies were extended to capitalize on the instrument’s improved sensitivity.
The ZenoTOF 8600 system has unique design features that make it particularly suited for targeted bile acid analysis. First, the instrument has a complementary fragmentation mode, EAD, that provides unparalleled structural characterization of small molecules [6-10]. Second, improved hardware, such as the front end with the Optiflow Pro source, a larger instrument orifice, and an advanced optical detector, enables higher sensitivity compared to the ZenoTOF 7600 system. Third, the instrument's front end is equipped with a DJET+ with Mass Guard, which has been shown to reduce instrument contamination on the SCIX 7500+ system (11), an important consideration for lipid and metabolite analysis, especially in the complex matrices common to bile acid analysis, including plasma, feces, and bile.
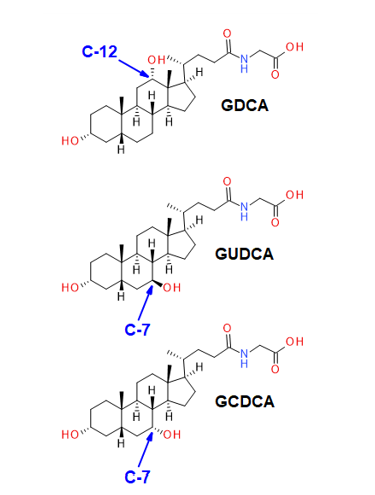
Bile acids are cholesterol-derived amphipathic molecules of saturated hydroxylated C-24 sterols. As shown in Figure 2, the location and stereochemistry of the hydroxyl functional groups define the different isomers within each sub-class. CID-based fragmentation of bile acids primarily yields product ions related to the bile acid head group, and relatively few fragments are generated from the ring structure; hence, CID alone does not generate diagnostically useful fragment ions for identification or quantitation purposes. Using chromatography to resolve bile acid isomers requires relatively long chromatographic gradients, which are not conducive to high-throughput analysis. An alternative to lengthy chromatographic gradients and CID-based fragmentation is EAD. EAD-based fragmentation provides ample fragments derived from the sterol ring structure, and it can distinguish the isomers of each bile acid subclass without extensive chromatographic method development.
In this technical note, the speed and sensitivity of the ZenoTOF 8600 system were leveraged to quantify bile acids in prepared plasma samples. To demonstrate the power of EAD to improve structural specificity during quantitative analysis, unique EAD-based fragments were identified for potentially co-eluting isomer pairs and used strategically in conjunction with CID-based fragmentation to enable a faster assay while maintaining quantitative specificity, accuracy, and precision.
Methods
Materials: Bile acid standard mixtures were purchased from Cambridge Isotopes Laboratories. The stable isotope-labeled bile acid mixes (unconjugated, cat# MSK-BA1; conjugated, MSK-BA2) were used as internal standards, and unlabeled bile acid mixes (unconjugated, cat# MSK-BA1-US; conjugated, MSK-BA2-US) were used as primary reference standards. All solvents were of LC-MS grade and obtained from Burdick and Jackson and Fisher Scientific.
Sample preparation: Human blood (research use only) was collected into tubes containing potassium ethylenediamine tetraacetic acid (K2EDTA) anti-coagulant following the procedure approved by the institutional review board (IRB) of BCM. The plasma was isolated from the red blood cell fraction by centrifugation. A 50 µL volume of each plasma sample was pipetted into individual 0.6 mL Eppendorf tubes, and a 200 µL volume of methanol was added to precipitate plasma proteins (primary DF=5-fold). All samples were vortex-mixed for 30 seconds and centrifuged at 17,000g for 5 minutes, and the supernatant for each clarified plasma extract sample was transferred into fresh vials. A 50 µL volume of each clarified plasma extract sample was transferred into fresh glass vials. A 450 µL volume of an internal standard solution (10 nM deuterated BAs) was added to each sample vial (DF=50-fold overall), and the vials were capped and vortex-mixed for 30 seconds. And prepared for analysis by HPLC ESI-MS/MS.


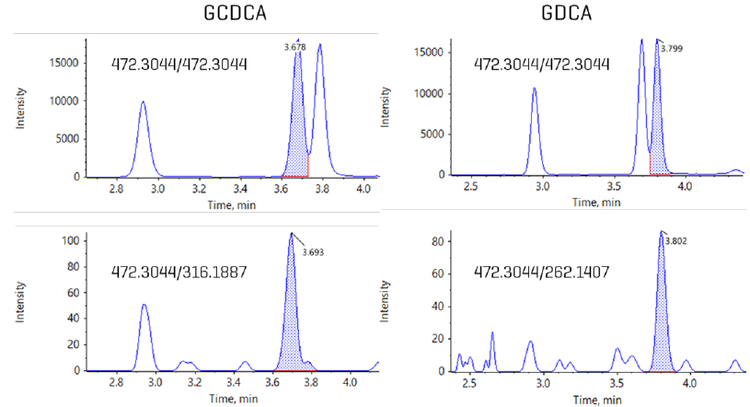
Chromatography: Extracted metabolites were resolved using a Nexera 40 Series UHPLC system equipped with a Restek Raptor C18 column (100 x 2.1 mm; 5.0 µm particle size). The autosampler sample bay was maintained at 10 °C , and a 5 µL sample volume was injected on column. The column oven temperature was kept at 50oC with a constant mobile phase flow rate of 0.3 mL/min for a total run time of 17 min. The mobile phase compositions were (A) 10 mM ammonium formate in water and (B) pure acetonitrile. Gradient details are shown in Table 1. Alternatively, the gradient was altered to enable a 10 min total run time (Table 2) in which EAD-based fragmentation was selectively employed to maintain compound specificity for co-eluting isomers that are not distinguishable using CID-based fragmentation, an example of which is shown in Figure 1.
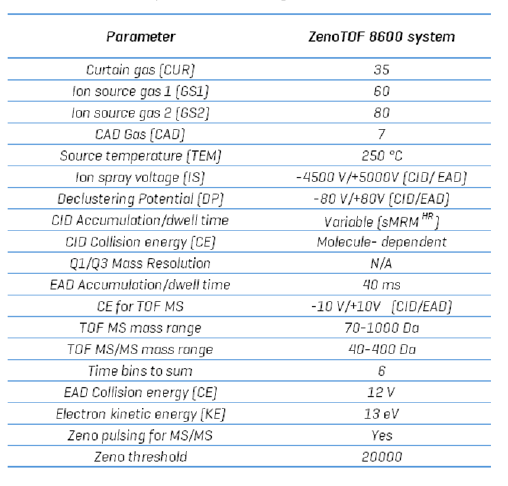
Mass spectrometry: Sample extracts were analyzed using the ZenoTOF 8600 system with an OptiFlow ProTurbo V ion source and a scheduled, high-resolution multiple reaction monitoring (sMRMHR) scan mode. CID-based fragmentation was used for the initial assessment of the system's performance using the 17-minute gradient. This experiment was repeated using EAD-based fragmentation. To speed up the experiment and reduce the total time to 10 min, an sMRMHr experiment was performed using mixed-mode fragmentation. For isomers that overlapped when the gradient was shortened, an EAD-based fragment that is diagnostic for the overlapping isomers was used. Otherwise, CID was used for analysis due to its greater sensitivity and shorter accumulation times. MS instrument parameters are presented in Table 3, and a comprehensive list of the compounds studied is shown in Table 4.

During sMRMHr analysis, a full product ion spectrum is acquired. To identify diagnostic, EAD-based fragments for co-eluting bile acid isomers such as GCDCA and GDCA,
The Analytics module within SCIEX OS software was used for quantitation, and the Explore module was used to structurally characterize bile acids from EAD-based MS/MS spectra. The limit of quantitation (LOQ) was determined from the lowest standard injected with the %CV value < 15 and an accuracy within 85% and 115% of the expected values for the internal standard curve.
Results and Discussion
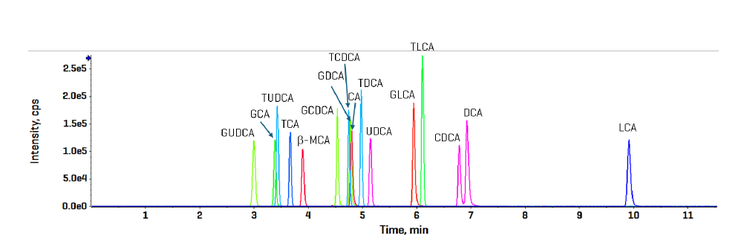
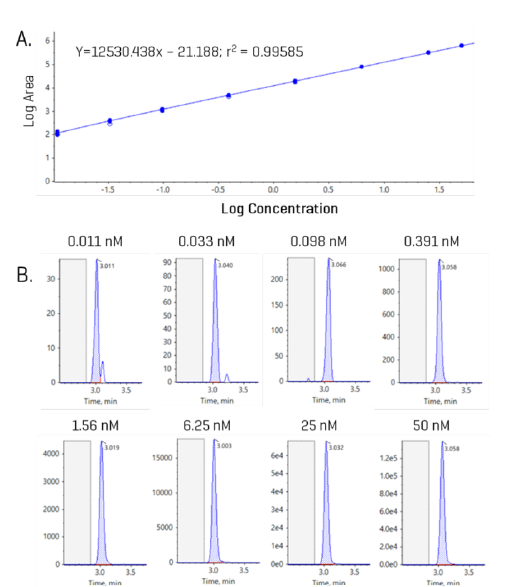
A bile acid standard curve was generated neat in solvent and analyzed on the ZenoTOF 8600 system. The parameter settings were optimized, as detailed in Tables 3 and 4, and the chromatographic gradient conditions resulted in the separation of each isomeric bile acid with baseline resolution (Figure 3). The concentrations within the internal standard curve ranged from 0.011 to 100 nM, covering a dynamic range of > 4 orders of magnitude. An example curve acquired for gylcoursodeoxycholic acid (GUDCA) is presented in Figure 4 (panel A), and the individual chromatograms for each injection of the standard curve from 0.011 to 50 nM GUDCA are shown (panel B). The associated quantitative statistics for GUDCA quantitation are shown in Table 5. The data derived from the internal standard curves were used to calculate the LOQ of each bile acid measured with the ZenoTOF 8600 system (Table 6). These values were determined as the lowest concentration standard injected that gave a %CV value <15% and an accuracy within the range of 85% to 115% of the expected value.


The EAD-based fragmentation functionality of the ZenoTOF 7600 system can provide significantly more structural details than that generated by CID-based fragmentation. Previously, we reported the identification of unique fragments for the bile acid isomers CDCA and DCA [TN BA].
These isomers elute very closely and are responsible, in part, for the relatively long analysis time so that they remain chromatographically resolved. It was hypothesized that using EAD-based fragmentation for these isomer pairs would allow for a truncated chromatographic gradient and enable faster sample analysis. Here, we extended these findings using the ZenoTOF 8600 system and leveraged the ~10-fold increase in sensitivity to strategically use EAD-based fragmentation for specific bile acids during sMRMHr analysis. Figure 6 shows a region of the EAD-derived product ion spectrum for GCDCA and GDCA acquired as neat standards; the spectrum for GCDCA is inverted so the differences in the spectra are more apparent. Fragment ions at m/z 262.1403 and 316.1888 were identified as unique, diagnostic ions for GDCA and GCDCA, respectively. Other apparently unique fragment ions for each bile acid isomer are indicated with red arrows. Having multiple unique fragment ions may help with quantitation, as fragment intensities can be added during quantitative processing in the Analytics module of SCIEX OS software
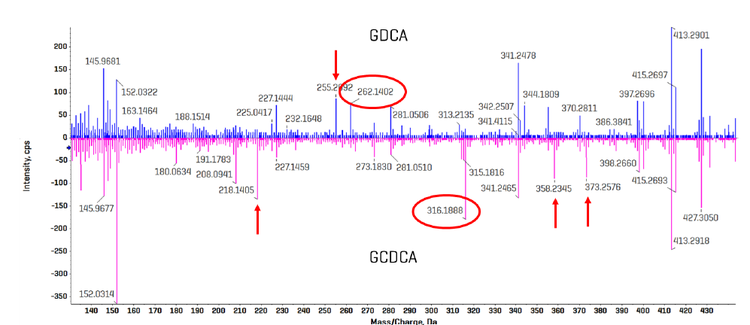
spectrum for GDCA overlaid and inverted. Multiple fragments were identified for each bile acid isomer that appear to be unique and could serve as a
selective fragment ion during analysis (red arrows). The fragment ions with m/z 262.1403 and 316.1888 were chosen for GDCA and GCDCA, respectively,
due to their relatively high abundances
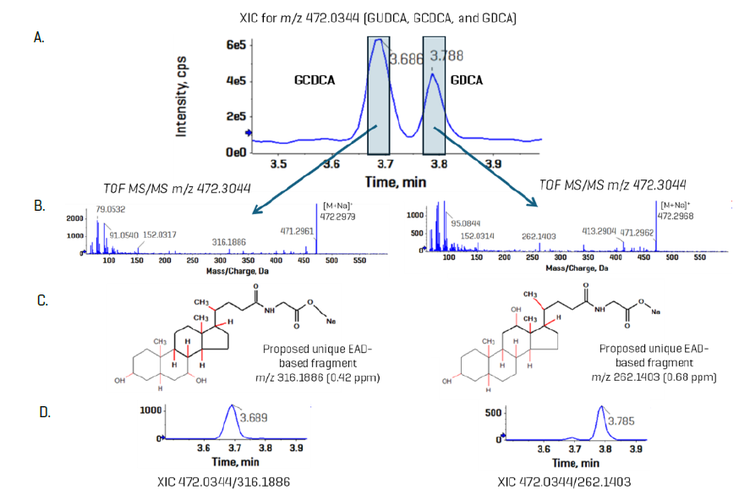
Using the faster, 10-min gradient, the bile acid standards were analyzed using EAD-based fragmentation. Figure 7, panel A, shows the elution profile of GCDCA and GDCA using neat standards, with the peak-to-peak retention time difference of ~12 s. The product ion spectra are shown in panel B, with the diagnostic ion for each apparent in its respective spectrum. The fragment panel app within the SCIEX OS Explore module proposed 2 possible structures of the fragments, as shown in Panel C. In Panel D, the XICs for GCDCA and GDCA show minimal to no interference when the EAD-specific fragments are used.
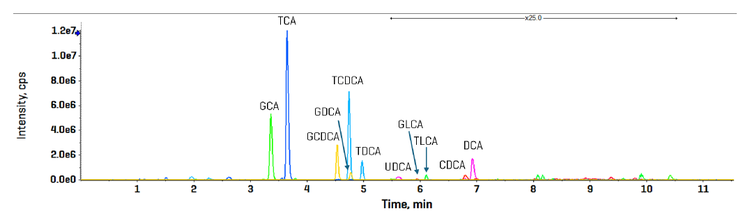
To test whether this technique can be used to measure bile acids in plasma, the same 10-minute, EAD-based method used for Figure 7 was applied to the analysis of human plasma extracts (Figure 1). In contrast to the results with neat standards, in the plasma matrix, the isomers GCDCA and GDCA are not baseline resolved when using a common fragment—in this case, the precursor-to-precursor MRMHr transition. However, when the data were processed using the unique EAD-based fragments, the individual bile acids were completely resolved, allowing for accurate quantitation.
In the data reported here, the ZenoTOF 8600 system was able to measure bile acids in human plasma with ~10-fold greater sensitivity than the ZenoTOF 7600 system using CID-based fragmentation. Of note, for this particular assay, a choice has to be made whether to maximize sensitivity and run the samples using the longer gradient in the negative ion mode with CID-based fragmentation, or to maximize speed and specificity by running the assay with the fast gradient using EAD-based fragmentation and sacrifice ~ 100-fold sensitivity compared to the longer assay. For the isomers in question here, GDCA, GCDCA, and GUDCA, the EAD-based method was appropriate for biological analysis. Currently, a study is underway to measure amino acid conjugates of bile acids. These molecules are measured in the positive ion mode and are amenable to a combined analysis of CID- and EAD-based analysis, using EAD only when needed to improve specificity.
Conclusion
- The ZenoTOF 8600 system is ~ 20-fold more sensitive for the analysis of bile acids compared to the ZenoTOF 7600 system narrow XIC window possible on HRMS systems enables the MS1-based collection of data without the inclusion of chemical background interferences
- EAD-based fragmentation provides structural characterization of molecules and may abrogate the need for extensive chromatographic separation of isomers to ensure specificity
References
1. Collins, S. L., Stine, J. G., Bisanz, J. E., Okafor, C. D., & Patterson, A. D. (2023). Bile acids and the gut microbiota: metabolic interactions and impacts on disease. Nature reviews. Microbiology, 21(4), 236–247. https://doi.org/10.1038/s41579-022-00805-x
2. Lin, S., Wang, S., Wang, P., Tang, C., Wang, Z., Chen, L., Luo, G., Chen, H., Liu, Y., Feng, B., Wu, D., Burrin, D. G., & Fang, Z. (2023). Bile acids and their receptors in regulation of gut health and diseases. Progress in lipid research, 89, 101210. https://doi.org/10.1016/j.plipres.2022.101210
3. Baker, PRS., Proos, R., Sefevoric, MD., and Horvath, TD. Quantitative analysis and structural characterization of bile acids using the ZenoTOF 7600 system. SCIEX technical note MKT-30747-B. https://sciex.com/tech-notes/life-science-research/metabolomics/quantitative-analysis-and-structural-characterization-of-bile-ac
4. Liu, D., Li, G., Liu, D., Shi, W., Wang, H., Zhang, Q., Shen, M., Huang, X., & Lin, H. (2023). Quantitative Detection of 15 Serum Bile Acid Metabolic Products by LC/MS/MS in the Diagnosis of Primary Biliary Cholangitis. Chemistry & biodiversity, 20(3), e202200720. https://doi.org/10.1002/cbdv.202200720
5. Gao, T., Hu, S., Xu, W., Wang, Z., Guo, T., Chen, F., Ma, Y., Zhu, L., Chen, F., Wang, X., Zhou, J., Lv, Z., & Lu, L. (2024). Targeted LC-MS/MS profiling of bile acids reveals primary/secondary bile acid ratio as a novel biomarker for necrotizing enterocolitis. Analytical and bioanalytical chemistry, 416(1), 287–297. https://doi.org/10.1007/s00216-023-05017-7
6. Yang, J., Lin, J., Wang, A., Yang, X., Wang, Y., Zhang, Y., Dong, H., Tian, Y., Zhang, Z., Wang, M., & Song, R. (2024). Study on the effect of calibration standards prepared with different matrix on the accuracy of bile acid quantification using LC-MS/MS. Journal of pharmaceutical and biomedical analysis, 237, 115785. https://doi.org/10.1016/j.jpba.2023.115785
7. Baba T, Campbell JL, Le Blanc JCY, Baker PRS, Hager JW, Thomson BA. Development of a Branched Radio-Frequency Ion Trap for Electron Based Dissociation and Related Applications. Mass Spectrom (Tokyo). 2017;6(1):A0058. doi: 10.5702/massspectrometry.A0058
8. Baba, T., Campbell, J. L., Le Blanc, J. C., & Baker, P. R. (2016). In-depth sphingomyelin characterization using electron impact excitation of ions from organics and mass spectrometry. Journal of lipid research, 57(5), 858–867. https://doi.org/10.1194/jlr.M067199
9. Baba, T., Campbell, J. L., Le Blanc, J. C., & Baker, P. R. (2016). Structural identification of triacylglycerol isomers using electron impact excitation of ions from organics (EIEIO). Journal of lipid research, 57(11), 2015–2027. https://doi.org/10.1194/jlr.M070177
10. Baba, T., Campbell, J. L., Le Blanc, J. C. Y., Baker, P. R. S., & Ikeda, K. (2018). Quantitative structural multiclass lipidomics using differential mobility: electron impact excitation of ions from organics (EIEIO) mass spectrometry. Journal of lipid research, 59(5), 910–919. https://doi.org/10.1194/jlr.D083261
11. Baba T, Campbell JL, Le Blanc JCY, Baker PRS. Distinguishing Cis and Trans Isomers in Intact Complex Lipids Using Electron Impact Excitation of Ions from Organics Mass Spectrometry. Anal Chem. 2017 Jul 18;89(14):7307-7315. https://doi: 10.1021/acs.analchem.6b04734
12. Selen, E., Baghla, R., Moore, I., Galermo, E., Zhang, Z., and Jones, E. Redefine bioanalysis with enhanced robustness on the SCIEX 7500+ system. SCIEX technical note MKT-31350-A. https://sciex.com/tech-notes/pharma/bioanalysis-pk/redefine-bioanalysis-with-enhanced-robustness-on-the-sciex-7500-plus-system