Abstract
This technical note demonstrates how Enhanced Sensitivity Mode (ESM) further extends the ZenoTOF 8600 system’s performance for low-input quantitative proteomics by refining instrument parameters and detector tuning to improve detection and amplification of low-level ions. Atsample loadings as low as 100 pg, ESM increases the number of detectable and quantifiable protein groups and precursors by as much as 40%, while improving quantitative reproducibility as much as 34%. By extending quantitative depth and confidence from picogram-level inputs, ESM helps proteomics researchers generate more reproducible measurements from limited material and unlocks new performance for high-sensitivity applications such as single-cell proteomics.
Key features of ZT Scan DIA 3.0 with Enhanced Sensitivity Mode on the ZenoTOF 8600 system
- Unlock up to 40% more quantifiable biology from just 100 pg of sample: With Enhanced Sensitivity Mode, the ZenoTOF 8600 system delivers up to 40% more quantifiable protein groups and precursors from low-input commercial human lysate digests, enabling deeper proteome coverage when every ion matters.
- See more. Quantify with greater confidence: Enhanced Sensitivity Mode improves spectral quality while increasing peptide peak areas and quantitative precision, providing greater confidence in peptide identification and quantitation— especially for low-abundance signals that can define biological discovery.
Introduction
For low-input and single-cell proteomics, biological insight is often limited not by sample complexity alone, but by whether low-abundance peptide ions can be detected, confidently assigned, and reproducibly quantified across injections. ESM on the ZenoTOF 8600 system is designed to address this challenge by refining detector tuning and instrument parameters to improve detection and amplification of low-level ions, with the greatest impact expected for picogram-to-low-nanogram sample loads. By combining ESM’s enhanced low-level ion detection with ZT Scan DIA 3.0’s Zeno trap–enabled MS/MS and scanning quadrupole isolation, the platform improves sensitivity, precursor selectivity, and MS/MS data quality to deliver deeper, more reproducible quantitative proteomics from limited material while maintaining DIA’s broad sampling advantages. This technical note evaluates performance using a commercial Human lysate digest and a hybrid Human/Yeast/E.coli proteome mixture. The results demonstrate increased numbers of detectable and quantifiable protein groups and precursors, improved quantitative reproducibility, and greater confidence in low-abundance peptide identification and quantitation.
Methods
Sample preparation: Human K562 and Yeast lysate tryptic digests were purchased from Promega. E.coli lysate tryptic digests were purchased from Waters. Lysate digest dilutions were prepared in buffer containing 0.1% formic acid/0.01% N-dodecyl β-D-maltoside detergent in water. For the Human/Yeast/E.coli (HYE) mixtures, lysates were mixed in 3 different percentage weight ratios as previously described (4,5). All samples were loaded onto Evotips (Evosep, Denmark) at the indicated amounts according to Evotip preparation instructions provided by Evosep.
Chromatography: All separations were performed using the Evosep Eno system (Evosep, Denmark) using the Whisper Zoom 40 SPD method. An IonOpticks Aurora Elite XS C18 nanoflow column (15 cm x 0.075 mm) was used, heated to 55 ºC. All samples were analyzed in triplicate.
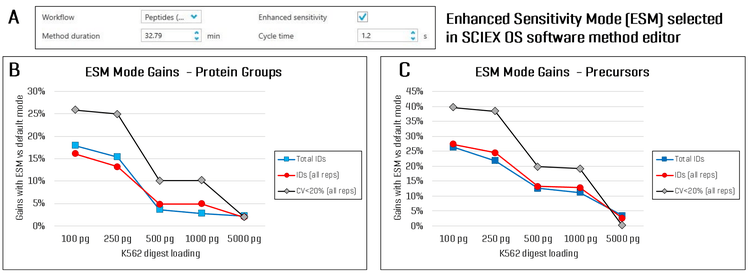
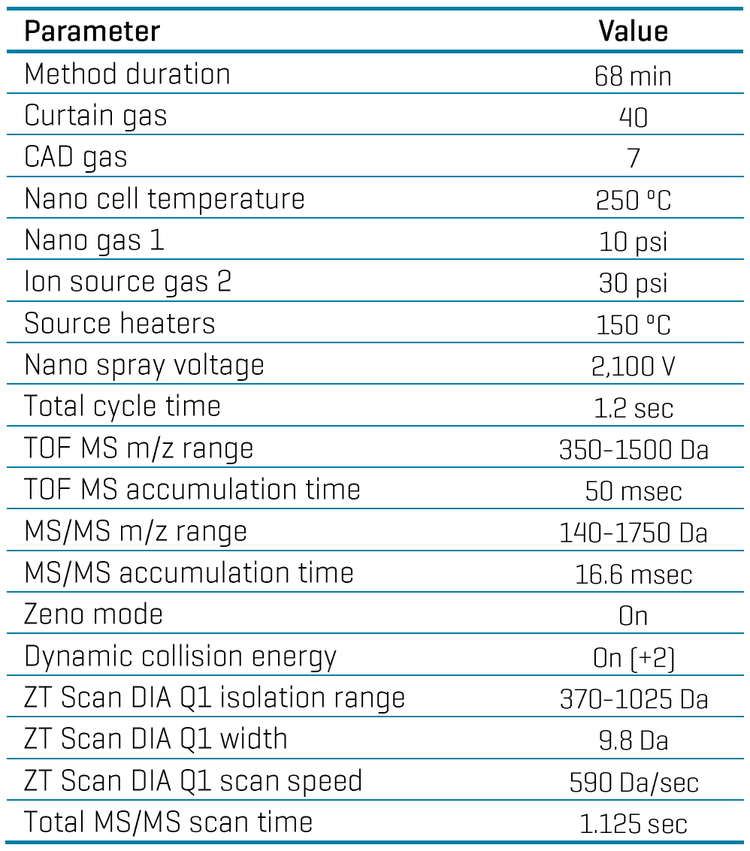
Mass spectrometry: All samples were analyzed using the ZenoTOF 8600 system, with the horizontal nanoflow probe. Ion source and ZT Scan DIA method parameters are described in Table 1. ZT Scan DIA methods had “Enhanced sensi tivity” either checked (ESM) or unchecked (default mode) (see Figure 1A).
Enhanced Sensitivity Mode drives progressively larger gains as sample amounts decrease
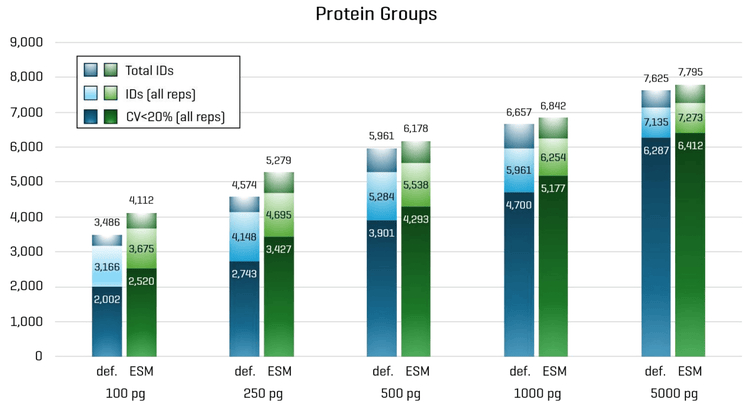
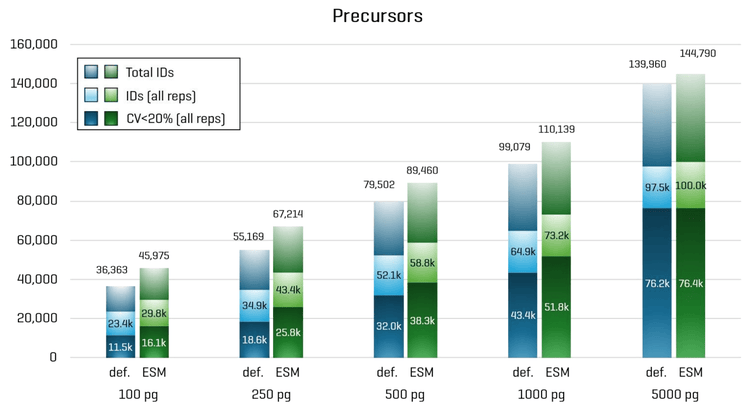
To evaluate the impact of ESM on low-input proteomics performance, a dilution series of K562 digest ranging from 5 ng to 100 pg—approximating single- cell-level sample loads—was analyzed on the ZenoTOF 8600 system using ZT Scan DIA 3.0 with a 9.8 Da Q1 window width. To maximize sensitivity, separations were performed using the Whisper Zoom 40 SPD method on the Evosep Eno system. Protein groups and precursors identified and quantified across the dilution series, including those consistently detected in all 3 replicates and quantified with CV <20%, are shown in Figures 2 and 3. A summary of the performance gains achieved with ESM is presented in Figure 1. Across the dilution series, ESM delivered clear improvements in proteome depth and quantitative performance, with the largest benefits observed at the lowest sample loads where sensitivity is most critical. As sample input decreased, the gains became progressively more pronounced, culminating in increases of up to 26% in quantified protein groups and up to 40% in quantified precursors at the lowest loading levels. These results demonstrate the ability of ESM to extend the quantitative reach of the ZenoTOF 8600 system into the picogram regime, enabling deeper and more reproducible characterization of sample-limited proteomes.
Enhanced low-level ion detection translates directly into stronger signals and improved quantitation
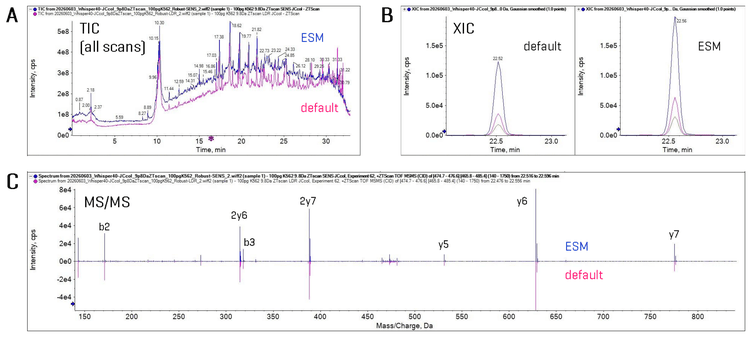
The improved identification and quantitation observed with ESM reflect enhanced detection and amplification of low-intensity ion signals, enabling stronger peptide- and fragment-level responses. This effect is illustrated in Figure 4 using the peptide AVFPSIVGR from the P0CG38|POTEI_HUMAN protein at a sample loading of 100 pg. Total ion chromatograms (TICs, Figure 4A), extracted ion chromatograms (XICs) for 3 representative fragment ions (Figure 4B), and the corresponding MS/MS spectra (Figure 4C) all show substantially stronger signal responses with ESM compared with default mode.
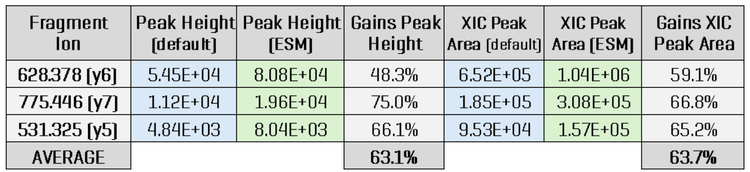
The magnitude of these improvements is summarized in Figure 5, where both XIC peak areas and fragment ion peak heights show average gains of 63% with ESM. By boosting signal intensity at the peptide and fragment-ion level, ESM increases confidence in peptide detection, identification, and quantitation, providing a powerful advantage for low-input and high-sensitivity proteomics workflows.
Enhanced Sensitivity Mode strengthens quantitative confidence in low-input proteomics
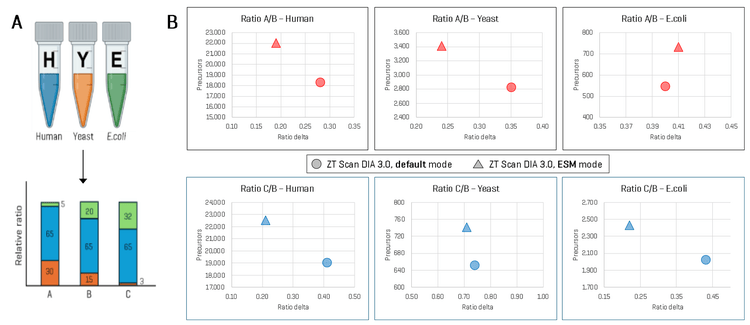
To evaluate the impact of ESM on LFQ performance, 3 HYE hybrid proteome mixtures were analyzed at a sample loading of 250 pg (Figure 6A). Samples were separated on the Evosep Eno system with the Whisper Zoom 40 SPD method and analyzed on the ZenoTOF 8600 system using ZT Scan DIA 3.0 with a 9.8 Da Q1 window width. Data were processed in PEAKS Studio version 13.5, and pairwise comparisons were performed (Sample A vs. Sample B and Sample C vs. Sample B) to assess both the number of precursors quantified across all replicates and the deviation from expected abundance ratios for each species represented in the HYE mixture.
The results, summarized in Figure 6B, demonstrate that ESM delivers measurable improvements in LFQ performance across all comparisons and species. Most notably, the number of precursors quantified in every replicate—eliminating missing values—is increased by approximately 20% with ESM relative to default mode. At the same time, the deviation from expected abundance ratios is reduced in virtually every comparison, indicating improved quantitative accuracy. These gains highlight the ability of ESM to recover and confidently quantify additional low-level signals while maintaining robust quantitative fidelity.
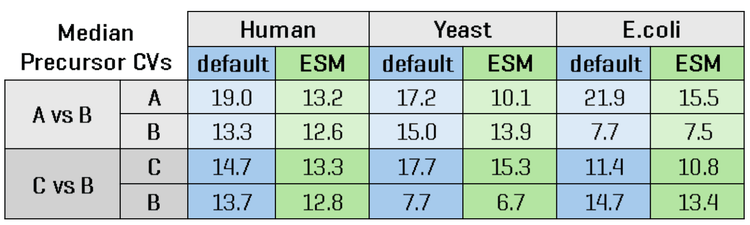
Beyond increasing quantitative coverage and accuracy, ESM also enhances analytical precision. Figure 7 summarizes precursor-level CV values across replicates for each sample and species. In every comparison, ESM produces lower CV values than default mode, with improvements of up to 34%, demonstrating substantially tighter quantitative reproducibility. Taken together, these results show that ESM delivers a powerful combination of deeper quantitative coverage, improved accuracy, and enhanced precision for low-input proteomics workflows. By increasing the number of confidently quantified precursors while simultaneously reducing quantitative variability, ESM enables higher-confidence biological interpretation from sample-limited analyses and further extends the performance of the ZenoTOF 8600 system for next-generation applications, including low-input and single-cell proteomics.
Conclusions
- Push deeper into the proteome at ultra-low sample loads: Using ESM on the ZenoTOF 8600 system, researchers can achieve up to 40% more quantifiable protein groups and precursors from commercial human digests at sample loadings as low as 100 picograms, extending proteome depth where sensitivity is most critical.
- Capture more of the ions that matter: ESM significantly enhances the detection and amplification of low-level ion signals, delivering up to 63% increases in peptide peak height and peak area, enabling stronger signals, improved data quality, and greater confidence in low-abundance measurements.
- Elevate quantitative performance for next-generation low-input proteomics: At sample loadings representative of single-cell workflows, ESM increases the number of quantifiable protein groups and precursors while improving label-free quantitation (LFQ) accuracy and precision, empowering more confident biological interpretation from limited material.
References
- Heymann, T., et al. (2026). Scanning DIA on the ZenoTOF 8600 system enables ultra-sensitive and quantitative proteomics from single cells to post-translational modifications in a compact platform. bioRxiv, https://doi.org/10.64898/2026.03.12.711261.
- ZT Scan DIA 3.0: A data-independent acquisition (DIA) method with high-resolution precursor selection improves protein identification and quantitation for proteomics research. SCIEX technical note, MKT-38093-A.
- Narrow-window scanning DIA for unbiased label-free quantitation: Improved protein group ratio accuracy with ZT Scan DIA 3.0 on the ZenoTOF 8600 system. SCIEX technical note, MKT-38229-A.
- Accurate label-free quantitative (LFQ) proteomics benchmarking using data-independent acquisition (DIA) on the ZenoTOF 8600 system. SCIEX technical note, MKT-38149-A.
- Van Puyvelde, B., et al. (2026). LFQ Benchmark Dataset-Generation Beta: Assessing Modern Proteomics Instruments and Acquisition Workflows with High Throughput LC Gradients. bioRxiv, https://doi.org/10.64898/2026.01.29.702266.
- Unlocking deeper data-independent acquisition (DIA) performance with empirical spectral libraries using ZT Scan DIA 3.0 on the ZenoTOF 8600 system. SCIEX technical note, MKT-39246-A.