Abstract
Quantitation of nitrosamine impurities in a metformin drug substance and drug product using the SCIEX X500 QTOF System.

Introduction
Metformin, a biguanide developed from galegine, is an oral antihyperglycemic agent most widely used in the treatment of type 2 diabetes. Chemically, it is a hydrophilic base which exists at physiological pH as the cationic species (>99.9%). It is freely soluble in water and is practically insoluble in acetone, ether, and chloroform. The pKa of metformin is 12.4, with the pH of a 1% aqueous solution of metformin hydrochloride is 6.68. The tablets are available under various brand names for oral administration containing 500 mg, 750 mg or 1000 mg of metformin hydrochloride.1
Nitrosamines, the chemical compounds containing nitroso functional group, are classified by the ICH M7(R1) Guideline as class one impurities, “known mutagenic carcinogens”, based on both rodent carcinogenicity and mutagenicity data. They are categorized by the International Agency for Cancer Research as 2A – probable carcinogens based on data of several species studied.2-3 Recently, the FDA has provided a testing method for 8 nitrosamines in a metformin drug substance and drug product.3
Additionally, the FDA has provided “guidance for industry” regarding “control of nitrosamine impurities in human drugs”.4 The EMA and Health Canada have also sensitized drug manufacturers for the possible presence of nitrosamines in their drug products.
Key features of the SCIEX solution to nitrosamine analysis in metformin
- A specific and robust method has been developed for the quantification of nine nitrosamine impurities in a metformin drug substance and drug product
- Optimized LC conditions provide resolution of all the nine nitrosamine impurities from the metformin and drug product excipients, ensuring optimum selectivity and sensitivity
- The SCIEX X500 QTOF System provides the sensitivity required for detection of all the nine nitrosamine impurities below the currently specified limits
- High levels of specificity for accurate measurement of nitrosamine levels, especially in drug products that contain DMF or other potential interfering substances
Methods
Sample preparation:
Drug substance: Metformin drug substance was weighed and diluted to a final concentration of 100 mg/mL in methanol. The sample was then shaken for 40 minutes using a mechanical wrist action shaker. After extraction, centrifuge the sample for 15 minutes at 4500 rpm. Filter the supernatant using a 0.22 μm PVDF syringe filter, discard the first 1 mL and transfer the filtered sample into a HPLC vial for analysis.
Drug product: Crush the appropriate number of tablet(s) to obtain a target concentration of 100 mg/mL of API in methanol, and transfer into a 15 mL glass centrifuge tube. Add the appropriate volume of methanol and mix for around a minute using a vortex mixer. Shake the sample for 40 minutes using a mechanical wrist action shaker. After extraction, centrifuge the sample for 15 minutes at 4500 rpm. Filter the supernatant using a 0.22 μm PVDF syringe filter, discard the first 1 mL and transfer the filtered sample into an HPLC vial for analysis.
Chromatography: Using the ExionLC™ System, the gradient was developed to separate all of the nitrosamine impurities in the panel from the metformin API and/or excipients used in drug product to prevent any ion suppression. The method also includes a divert step to prevent large amounts of the API from contaminating the mass spectrometer source.
Mass spectrometry: The SCIEX X500 QTOF System was operated in positive atmospheric pressure chemical ionization (APCI) mode. The compound dependent and source parameters were also optimized.
Data processing: Data was acquired and analyzed using SCIEX OS Software 1.7.
Method development
During the early stages of method development, both electrospray ionization (ESI) and atmospheric pressure chemical ionization (APCI) sources were investigated. APCI offered much higher signal intensities for all nitrosamine impurities and therefore was chosen over ESI. Starting conditions were selected based on previous work, relating to the quantification of nitrosamine impurities in ranitidine and losartan.5 As a starting point, several reversed-phase columns, such as Gemini NX-C18, Kinetex F5, InertSustain PFP, and Phenomenex Biphenyl columns were tested to achieve optimal selectivity, resolution, efficiency and signal-to-noise ratio.
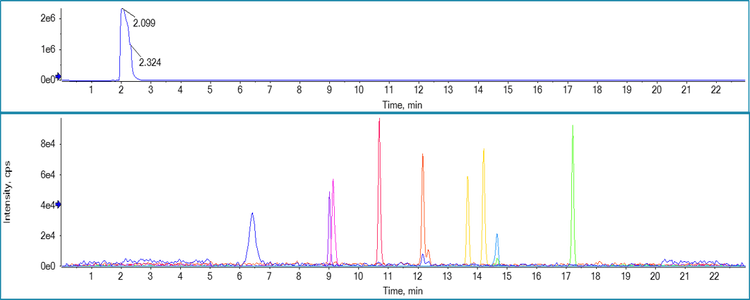
In this work, the Phenomenex Biphenyl column provided the desired separation necessary to both separate the impurities from each other but also from the drug product and drug substance (Figure 2). In addition, the column was able to provide separation between N-nitrosodimethylamine (NDMA) and dimethylformamide (DMF) which has been raised as a concern in a recent FDA paper.7 In addition, under the finalized gradient setup adequate resolution was achieved between N-Nitrosodi-n-propylamine (NDIPA) and N-nitroso-di-n-propylamine (NDPA) which are positional isomers and therefore can be difficult to separate.
Quantitative results
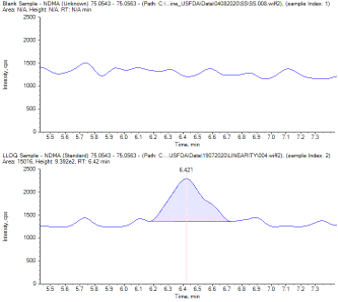
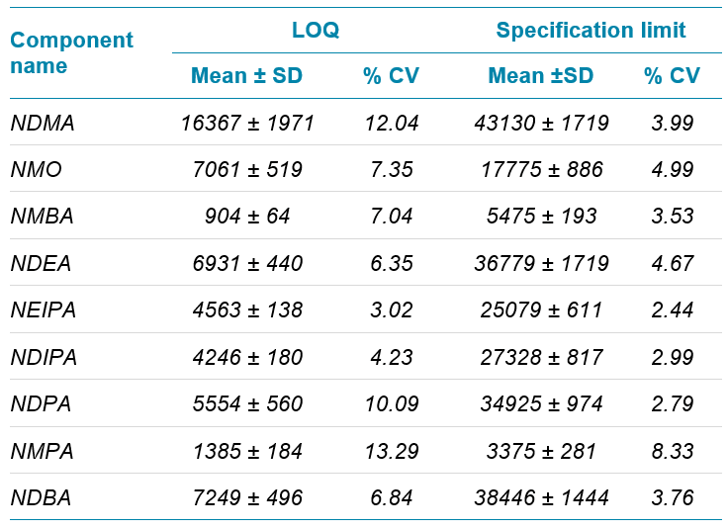
The selectivity of the method is well established as the area count observed in the diluent or blank samples at the retention time of all nitrosamine impurities was less than 10% of the LLOQ area count (Figure 3). The limit of detection (LOD), limit of quantification (LOQ) and linearity data are captured in Table 1.
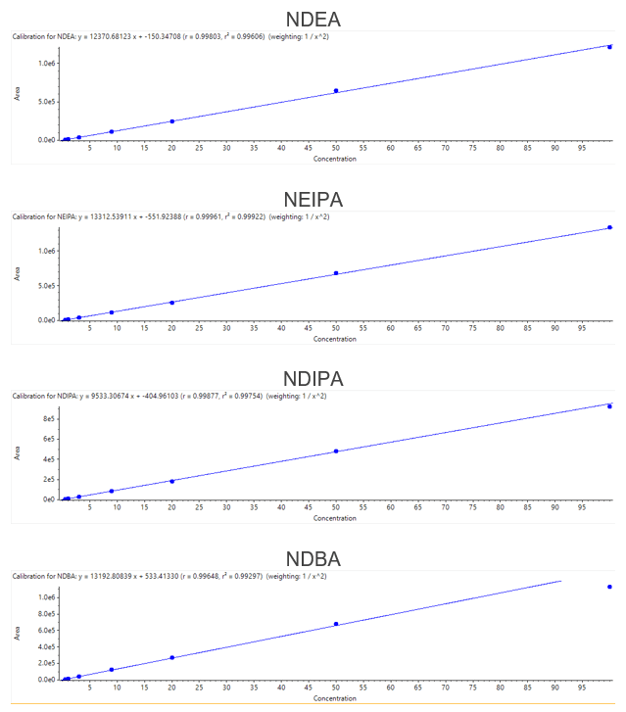
All nine nitrosamine impurities display linear responses throughout the concentration range, with r values greater than 0.99 (Figure 4). For all nine nitrosamine impurities, the reproducibility data for six replicates of samples is tabulated in Table 2. Reproducibility data showed that the %CV observed for LOQ and specification limits for all nitrosamine impurities was less than 15% and 10%, respectively.
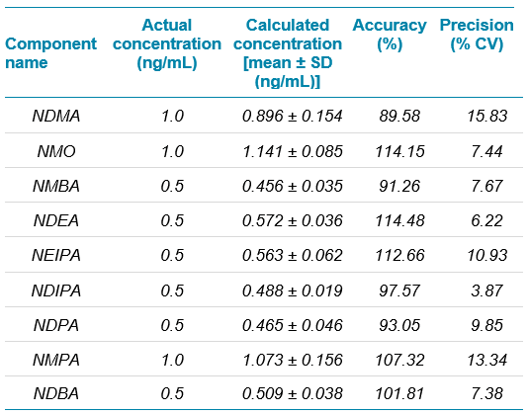
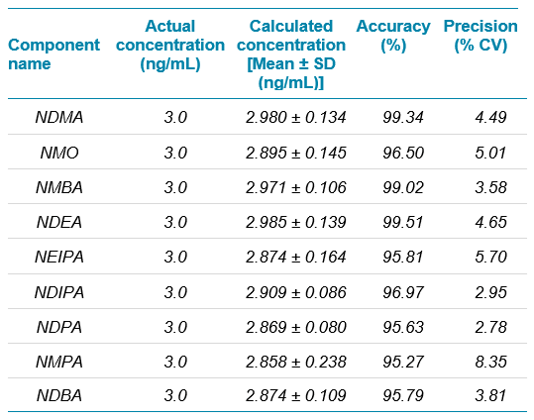
The precision and accuracy values obtained for six replicates at the LOQ is captured in Table 3 and at specification level is captured in Table 4.
The precision and accuracy values obtained were acceptable and within regulatory recommended criteria. Similarly, the % recovery observed at limit of quantification and specification limits were between 80% and 120% which is well within acceptable criteria for trace impurity analysis.

Specificity of NDMA and DMF
The EMA classifies N, N-dimethylformamide (DMF) as a class-II solvent which is commonly used in bulk chemical synthesis. It has been identified that DMF together with sodium nitrite, in the presence of an acid leads to the formation of N-nitrosamines during the manufacture of sartan APIs.6 Recently, the FDA released a paper documenting instances of DMF interference when performing NDMA quantification. Here two solutions to this problem have been provided, both chromatographically but also utilizing the high mass accuracy and fragmentation of the SCIEX X500 QTOF System.7
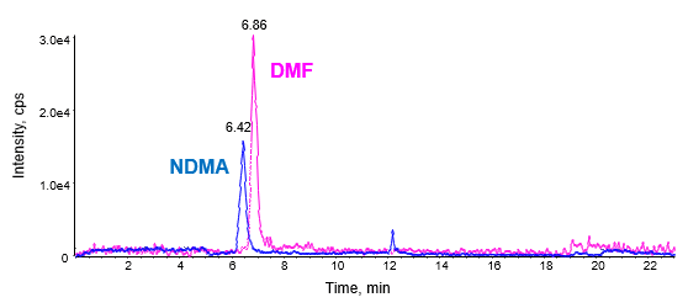
Chromatographic resolution
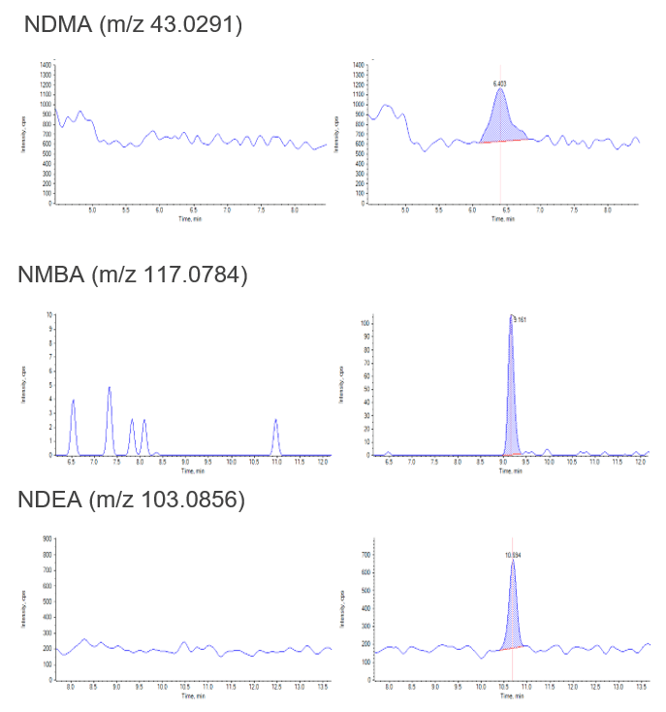
As a first line solution, NDMA and DMF were chromatographically resolved, thereby providing specificity for NDMA quantification (Figure 5).
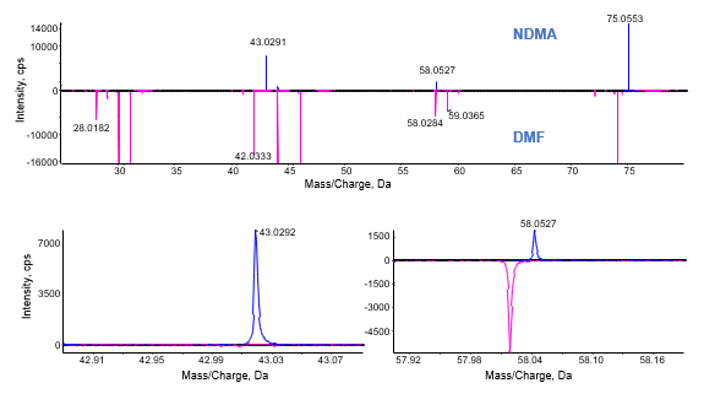
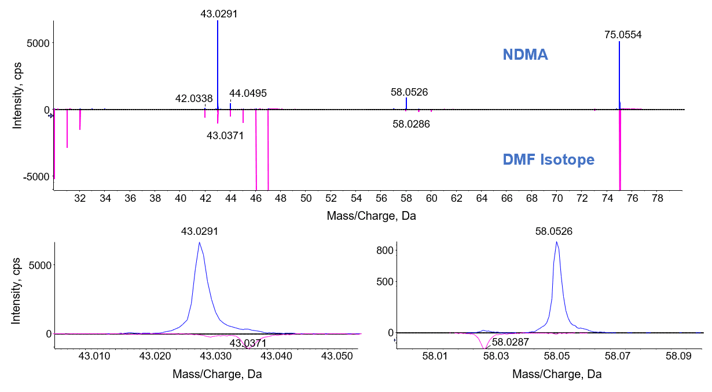
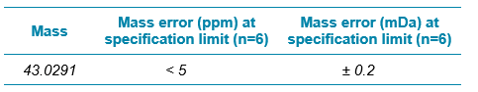
High mass accuracy for accurate and specific quantification
To ensure accurate quantification of NDMA in the presence of DMF without using chromatographic separation, high mass accuracy and consistent fragmentation is necessary to ensure that interference does not affect the result (Table 5). From studying the fragmentation pattern of NDMA (monoisotopic ion at m/z 75.0553) and DMF (monoisotopic ion at 74.0595) as well as isotopic ions of DMF (m/z 75.0556 and m/z 75.0634), it can be seen that the most intense NDMA fragment at m/z 43.0291 was not affected by the presence of DMF in the sample when using a 20 ppm width for quantification (Figure 6 and 7). Therefore the 43.0291 fragment can be used to assess the specificity of quantification while also enabling the use of the precursor ion for quantification as well. The fragment at 58.0527 can also be utilized for quantitation but shows less sensitivity when compared to the precursor and 43.0291 fragment and therefore has not been used for quantification in this instance.
Conclusions
- A method has been successfully developed for the quantification of nine nitrosamine impurities in a metformin drug substance and drug product
- Specificity of NDMA quantification in the presence of N,N-dimethyl formamide has been established
- Specificity for NDMA quantification in the presence of potential interfering substances can easily be achieved through chromatographic resolution and/or by quantifying using fragment ions of nitrosamine using MRMHR mode
- Precision, accuracy and % recovery observed is within the acceptable limits
- There is no ion suppression and/or enhancement observed for any of the nitrosamine impurities
References
- Highlights of Prescribing Information: GLUMETZA
- International Council for Harmonisation of Technical Requirements for Pharmaceuticals for Human Use; “ICH Harmonised Guideline - Assessment And Control Of DNA Reactive (Mutagenic) Impurities in Pharmaceuticals to Limit Potential Carcinogenic Risk, M7(R1)”; March 31, 2017.
- Liquid Chromatography-Electrospray Ionization-High Resolution Mass Spectrometry (LC-ESI-HRMS) Method for the Determination of Nitrosamine Impurities in Metformin Drug Substance and Drug Product - FDA white paper
- Control of nitrosamine impurities in human drugs – guidance for industry, FDA, September 2020.
- Analysis of Genotoxic Nitrosamines in Losartan and Ranitidine Active Pharmaceutical Ingredients. SCIEX technical note RUO-MKT-02-11183-A.
- Yang, et al. (2020) A Cautionary Tale: LC-HRMS Analytical Procedures for the Analysis of N-Nitrosodimethyamine in Metformin, The AAPS Journal 22: 89.