Enhanced biotherapeutic characterization with subunit and middle-down mass spectrometry workflows
Abstract
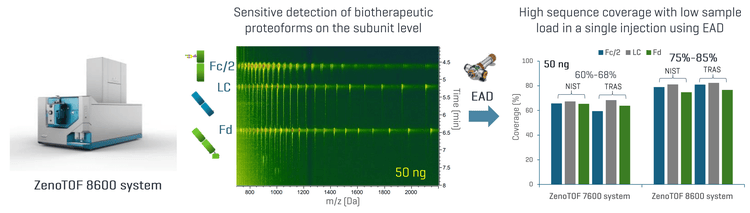
Sequence confirmation, post-translational modification (PTM) analysis and impurity assessment are essential components of biotherapeutic characterization to ensure drug quality, safety and efficacy. This technical note describes the benefits of MS sensitivity improvement offered by the ZenoTOF 8600 system for enhanced subunit and middle-down MS analysis of biotherapeutics using electron-activated dissociation (EAD) (Figure 1). Compared to the previous platform, the ZenoTOF 8600 system provided more sensitive (>3X) detection of low-abundant proteoforms and higher sequence coverage (75%-85% vs. 60%-68%) of subunits in a single injection with a low sample load of 50 ng.
Subunit and middle-down MS workflows offer accurate mass measurement, rapid sequence confirmation and PTM analysis of biotherapeutics while involving simple sample preparation and data analysis.1-3 Further improvement in MS sensitivity can enhance the ability of these workflows to detect and characterize low-abundant proteoforms or impurities, facilitating decision-making during biotherapeutic discovery and development. The advancements in the ion source, optics and detectors of the ZenoTOF 8600 system provided up to 10X increase in MS sensitivity, benefiting biotherapeutic analyses on the intact,4 subunit and peptide5 levels.
Key benefits of the enhanced subunit and middle MS workflows for biotherapeutic characterization
- High sensitivity: The improved hardware provides >3X gain in MS sensitivity, enabling superior analysis of proteoforms or impurities on the subunit level compared to the previous platform
- High sequence coverage: EAD-based middle-down MS workflow with improved MS sensitivity led to high sequence coverage (75%-85%) of subunits with a low sample load
- Labile PTM analysis: EAD preserves labile PTMs such as glycosylation for their accurate localization
- Streamlined: Subunit and middle-down MS workflows are streamlined from data acquisition to result interpretation, and can be easily implemented by scientists from discovery to quality control
Introduction
Sequence confirmation, impurity assessment, PTM analysis and comprehensive characterization are essential to ensuring the safety and efficacy of protein-based biotherapeutics with increasing complexity.6 Accomplishing these tasks requires a full suite of analytical workflows, including intact/native MS, subunit/middle-down MS and peptide mapping, that offer high sensitivity and various capabilities. The ZenoTOF 8600 system, equipped with the Zeno EAD and enhanced hardware components such as the OptiFlow Pro ion source, dual-frequency QJet ion guide and optical-based detector, serves as an ideal platform for comprehensive biotherapeutic characterization on the intact, subunit and peptide levels.
Subunit and middle-down MS offers a balanced approach for rapid biotherapeutic characterization with simple sample preparation and high sequence coverage of subunits. The EAD-based middle-down MS workflows have proven to be highly effective for confident sequence confirmation and disulfide bond mapping on the subunit level.1-3 In this work, the improved MS sensitivity offered by the ZenoTOF 8600 system was leveraged to enhance subunit and EAD-based middle-down MS analysis with reduced sample consumption.
Methods
Sample preparation: The stock solution (10 µg/µL) of NISTmAb, trastuzumab or infliximab was diluted to 1 µg/µL and incubated with 50 U/µL FabRICATOR (IdeS, Genovis) at 37°C for 2 hours. The subunits were denatured and fully reduced by incubating the solution with guanidine hydrochloride and dithiothreitol (DTT) at 60°C for 30 minutes. A 50 ng of the subunit sample was injected for LC-MS analysis.
RPLC separation: The subunits were separated using an ACQUITY UPLC Protein BEH C4 column (2.1 × 50 mm, 1.7 µm, 300 Å, Waters). The LC gradients used for the subunit separation are shown in Table 1. A flow rate of 250 µL/min was used for all LC runs. The column was kept at 60°C in the column oven of an ExionLC AD system (SCIEX). Mobile phase A was 0.1% formic acid in water, and mobile phase B was 0.1% formic acid in acetonitrile.
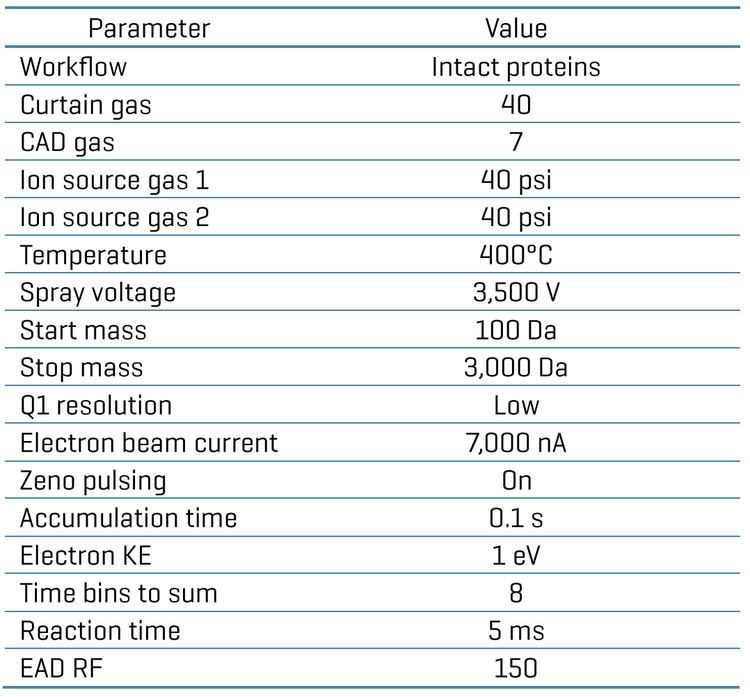
Mass spectrometry: MRMHR EAD experiments were performed for the fully reduced Fc/2 G0F, LC and Fd subunits in SCIEX OS software using a ZenoTOF 7600 system or 8600 system (SCIEX). Three charge states per subunit were targeted for EAD fragmentation. The key source and MRMHR EAD settings of the ZenoTOF 8600 system are listed in Table 2.
Data analysis: MRMHR data were analyzed using a top/middle-down protein sequencing workflow template in Biologics Explorer software. The G0F glycan was specified for the N61 residue of the Fc/2 subunit, and the N-terminal Gln->pyro-Glu modification was selected for the Fd subunit of NISTmAb.

Subunit mass analysis
The hardware improvements of the ZenoTOF 8600 system provide up to >3X gain in MS sensitivity for intact mass analysis compared to the ZenoTOF 7600 system, enhancing the detection of low-abundant species in biotherapeutics with reduced sample load.4,5 In this work, the benefits of MS sensitivity gain were evaluated for subunit mass analyses of NISTmAb, trastuzumab and infliximab.
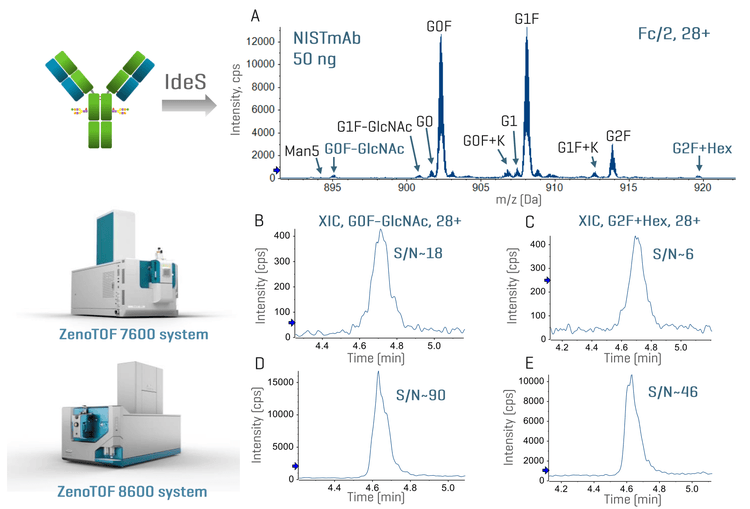
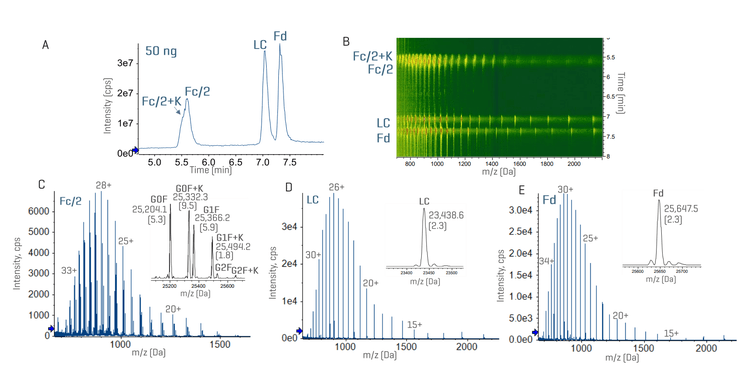
Figure 2 shows the representative subunit data of 50 ng NISTmAb analyzed using the ZenoTOF 7600 system or ZenoTOF 8600 system. An expanded view of the charge state 28+ of the Fc/2 subunit reveals the detection of low-abundant proteoforms, such as G0F-GlcNAc and G2F+Hex, at a low sample load of 50 ng NISTmAb using the ZenoTOF 8600 system (Figure 2A). The extracted ion chromatograms (XICs) of G0F-GlcNAc and G2F+Hex from the data acquired by the ZenoTOF 7600 system and ZenoTOF 8600 systems show >3X increase in the signal-to-noise (S/N) ratios using the new system compared to the previous platform (Figures 2B-2D). This significant gain in MS sensitivity offered by the ZenoTOF 8600 system enabled better detection of low-abundant proteoforms or impurities in biotherapeutics on the subunit level. It also enhances EAD-based middle-down MS analysis with reduced sample consumption.
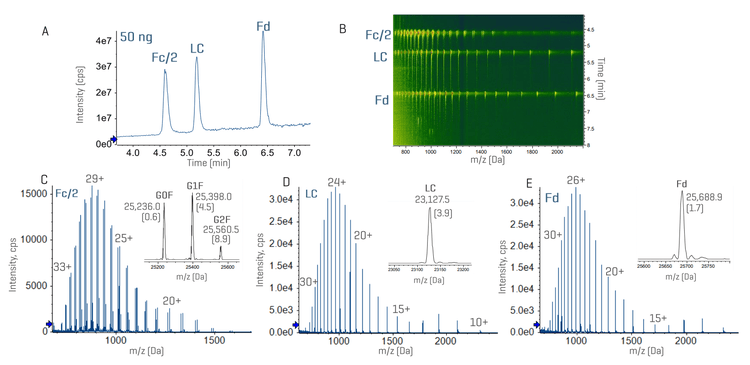
Figures 3 and 4 show the total ion chromatograms (TICs) and MS data of NISTmAb and infliximab subunits with a sample load of 50 ng. The result of trastuzumab resembled that of NISTmAb (data not shown). While a complete chromatographic separation was achieved between the Fc/2, LC and Fd subunits, the Fc/2 subunits of infliximab with or without the C-terminal Lys (K) residue were partially separated under the current chromatographic condition (Figures 3A and 4A). The presence of 3 subunits and their proteoforms can be nicely visualized using the ion map within the Biologics Explorer software (Figures 3B and 4B). Despite a low sample load of 50 ng, the ZenoTOF 8600 system provided an excellent MS signal of 3 subunits, leading to accurate mass measurement (<10 ppm) of the major glycoforms (Figures 3C-3E and 4C-4E), including the Lys variants of the infliximab Fc/2 subunit (Figure 4C).
Enhanced middle-down MS analysis with EAD
Previous technical notes have demonstrated the effectiveness of the EAD-based middle-down MS workflow for sequence confirmation, PTM localization and disulfide bond mapping.1-3 The increase in MS sensitivity with the ZenoTOF 8600 system, compared to the previous platform, enables improved middle-down analysis of biotherapeutic subunits with reduced sample consumption.
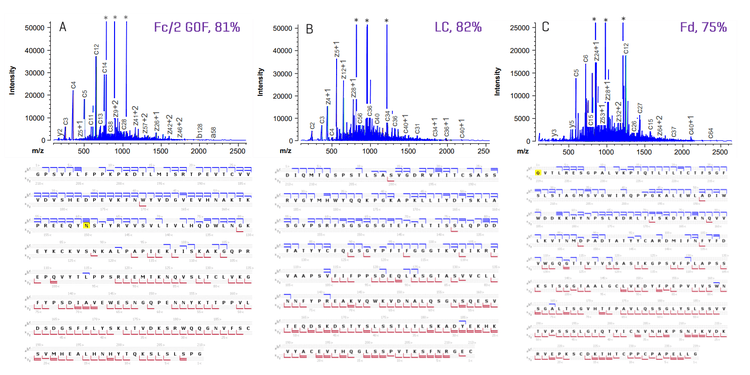
Figure 5 shows EAD spectra and sequence coverage of the Fc/2, LC and Fd subunits obtained from a 50 ng injection of NISTmAb using the ZenoTOF 8600 system. EAD led to a high sequence coverage of ³75% for the 3 NISTmAb subunits in a single injection, leading to the confirmation of the G0F glycan position in the Fc/2 subunit (Figure 5A) and the N-terminal Gln→pyro-Glu modification in the Fd subunit (Figure 5C). A high sequence coverage of 75%-85% was also obtained for trastuzumab and infliximab subunits in a single injection of 50 ng samples (data not shown).
Figure 6 shows the sequence coverage of the Fc/2, LC and Fd subunits obtained for 50 ng NISTmAb and trastuzumab using the EAD-based middle-down MS on the ZenoTOF 7600 system or ZenoTOF 8600 system. The MS sensitivity improvement provided by the ZenoTOF 8600 system, compared to the previous platform, led to an increase in the sequence coverage of the 3 subunits (75%-85% for the ZenoTOF 8600 system vs. 60-68% for the ZenoTOF 7600 system).
In summary, the improvements in the ion source, optics and detector of the ZenoTOF 8600 system led to superior subunit MS analyses of biotherapeutics and their proteoforms with reduced sample consumption compared to the previous platform. This sensitivity improvement enabled an enhanced middle-down MS analysis of biotherapeutic subunits using EAD, providing high sequence coverage of the subunits in a single injection with low sample loads. The enhanced subunit and EAD-based middle-down MS workflows are streamlined from data acquisition using SCIEX OS software to result interpretation using Biologics Explorer software. These workflows can be leveraged to sensitively detect and confidently characterize low-abundant proteoforms or impurities on the subunit level, facilitating rapid quality and impurity assessment of biotherapeutics for important decision-making during the discovery and development of biotherapeutics.

Conclusion
-
Subunit and middle-down MS provides a high sequence coverage of biotherapeutic subunits and accurate PTM localization, while involving simpler sample preparation and data analysis than traditional peptide mapping.
-
Enhanced MS sensitivity provided by the ZenoTOF 8600 system led to sensitive detection and confident mapping of biotherapeutic subunits with reduced sample consumption.
-
The ZenoTOF 8600 system provided ~75-85% sequence coverage of biotherapeutic subunits in a single injection of 50 ng. samples, compared to ~60-68% obtained for the same sample load using the ZenoTOF 7600 system.
-
The enhanced, streamlined subunit and EAD-based middle-down MS workflows can be implemented for rapid biotherapeutic characterization and impurity assessment by different levels of LC-MS scientists.
References
-
Obtaining high sequence coverage and confident post-translational modification (PTM) analysis of biotherapeutics using an electron activated dissociation (EAD)-based middle-down workflow. SCIEX technical note, MKT-27223-A.
-
Confident sequence analysis of a trispecific antibody using an electron-activated dissociation (EAD)-based middle-down workflow. SCIEX technical note, MKT-27784-A.
-
High-confidence disulfide bond mapping of biotherapeutics using an electron-activated dissociation (EAD)-based middle-down workflow. SCIEX technical note, MKT-28341-A.
-
Enhanced sensitivity of intact LC-MS approaches to expand the capability of biotherapeutic analysis. SCIEX technical note, MKT-35364-A.
-
A peptide mapping workflow with improved MS sensitivity for enhanced PQA characterization. SCIEX technical note, MKT-35361-A.
-
Anna Robotham and John Kelly. (2020) LC-MS characterization of antibody-based therapeutics: recent highlights and future prospects. Approaches to the Purification, Analysis and Characterization of Antibody-Based Therapeutics. Chapter 1: 1-33.