Abstract
The enhanced sensitivity of the SCIEX 7500 System will allow lower compound concentrations to be used in transporter assays, more closely align with the lower predicted systemic exposures for more potent drug candidates. Higher quality data will better guide compound rank ordering and selection in early stage drug development.

Introduction
In-vitro transporter assays are routinely run in mid-stage drug discovery to assess the impact of active transport activity on drug candidates’ ADME (absorption distribution metabolism excretion) behavior. Evaluation of transporter activity requires the analysis of many individual samples for a single compound, so to improve the efficiency of these assays, they are generally performed in a microtiter plate format. This dramatically improves sample handling but also serves to limit the sample size available for LC-MS/MS analysis of the collected samples. Because of the small available sample size and the need to be able to measure small percentages of the analyte at its initial concentration, high concentrations of analyte are typically tested. For potent compounds, these levels can be significantly higher than efficacious in-vivo concentrations, which makes prediction of in-vivo transporter activity from the in-vitro assays much more prone to error. In effect, the analytical technique can guide the assay concentration, as opposed to tailoring the assay around the more relevant predicted exposures.
Here, the use of the SCIEX Triple Quad 7500 LC-MS/MS System–QTRAP Ready is explored for the analysis of known compounds in OATP1B1 and OAT2 transporter assays, highlighting the sensitivity gains of this quantitative platform.
Key features for transporter activity analysis
- The combination of the OptiFlow® Pro Ion source, E Lens™ Technology and the D Jet™ Ion Guide on the SCIEX 7500 System provides increased sensitivity through the generation and transfer more ions into the mass spectrometer2
- Enhanced sensitivity of the SCIEX 7500 System enables lower level analyte detection providing greater flexibility in experimental design
- Ability to perform transporter assays with lower concentrations of analyte to better mimic biology
- Reduced failures, reduced repeat injections, improved efficiency in early stage compound selection
Methods
Sample preparation: Samples were prepared according to the following protocol. HEK293 wildtype, OATP1B1 and OAT2 cells were reconstituted in Dulbecco’s modified eagle medium (DMEM), counted and dispensed to Poly-D Lysine-coated 96-well plates. The plated cells were incubated for 72hrs at 37 ºC, 5% CO2 prior to the start of the experiment.
The uptake assay was programmed on a Beckman Biomek FX liquid handler. Cell plates were washed and preincubated for 5 minutes in HBSS prior to addition of test compound. Two minutes after addition of the test article, cells were washed and lysed with methanol containing internal standard (carbamazepine) and centrifuged for 5 minutes at 3,000 rpm. Supernatant was transferred to LC-MS sample plates, dried under nitrogen for 60 minutes, and reconstituted in 150 µL of 50:50 methanol/water prior to bioanalysis.
Chromatography: Samples for all four compounds were analyzed using the same generic, fast HPLC conditions on a Shimadzu Nexera Prominence LC, with the same method being used on both mass spectrometry platforms. The column used was a Phenomenex Kinetex XB-C18 30 x 2.1 mm, 2.6 µm, using a flow rate of 0.5 mL/min and an injection volume of 15 µL. The gradient conditions are described in Table 1.


Mass spectrometry: All four compounds in this study were monitored in positive MRM mode. The masses and voltages were identical for both the QTRAP 6500+ LC-MS/MS System and the SCIEX 7500 System, with the exception of a tunable declustering potential (DP) value, no longer required on the SCIEX 7500 System. Table 2 lists the MRM parameters, and the optimized source values for both platforms are listed in Table 3.
Data processing: For the SCIEX 7500 System data analysis, all data was acquired and processed using SCIEX OS Software. For the QTRAP 6500+ System, all data was acquired using Analyst® Software 1.7 and processed using the Analytics module in the SCIEX OS Software.

Measuring transporter activity
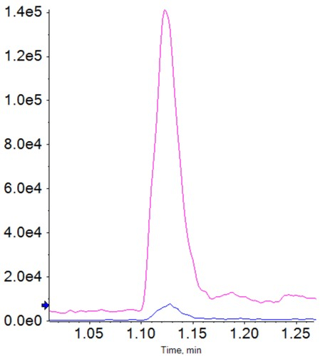
Transporter activity in this assay is evaluated by comparing the ratio of the response of an analyte in wild type cells to the response of the analyte in cells transfected to express the transporter in question. Detection of analyte in the wild type cells is crucial to reporting a result, because it is effectively the denominator of the ratio used to express relative activity. The wild type value represents passive diffusion of the compound across the cell membrane and is often quite low, which can become the limiting factor in being able to report data that allows compounds to be rank ordered for transporter activity. Improved instrument sensitivity and the ability to detect lower level passive diffusion will allow greater flexibility in how these assays are run, especially when selecting concentrations of compound to which to expose the cells.
Results
In this study, the selected compounds could be measured in all of the samples analyzed on both mass spectrometer platforms. But it should be noted that the original experimental design was based around the expected sensitivity of the QTRAP 6500+ System, so this was expected. Table 4 lists the peak areas for all four compounds in the wild type, OATP1B1 transfected cells lines and OAT2 transfected cells lines, run on both systems. The data clearly shows that both ganciclovir and penciclovir are OAT2 substrates and that rosuvastatin and valsartan are OATP1B1 substrates.
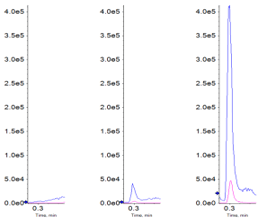
From the data table, it can be extrapolated that if the cells were exposed to a lower concentration of analyte, for example 10% for ganciclovir, that reliable data for the wild type might be difficult to obtain on the previous generation of instrumentation. Figure 2 illustrates the overlaid data from the two platforms.

Conclusions
As pharmaceutical companies continue efforts to develop more potent and efficacious drugs, and explore chemistries outside of the Lipinski Rule of Five, the data requirements from platform assays require increasingly sensitive instrumentation to provide relevant information to aid in early stage compound selection. The enhanced sensitivity of the SCIEX Triple Quad 7500 LC-MS/MS System – QTRAP Ready will allow lower compound concentrations to be used in transporter assays, so that compound levels can more closely align with the lower predicted systemic exposures for more potent drug candidates. This higher quality data will enable greater confidence when it is used to guide compound rank ordering and selection in early stage drug development.
References
- Varma MV, et al. (2015) Predicting Clearance Mechanism in Drug Discovery: Extended Clearance Classification System (ECCS). Pharm Res 32: 3785-3802.
- Enabling new levels of quantification. SCIEX technical note RUO-MKT-02-1186-A