Abstract
Since the discovery of genotoxic nistrosamines in pharmaceutical products in 2018, sensitive and selective methods for quantification of these contaminants has become critical. The method presented here provides good chromatographic separation of the six analyzed nitrosamine compounds from the losartan API. Good linearity over the concentration range monitored was observed and the lower limits of quantification for each compound translate to daily intake limits significantly lower than those currently specified by the FDA and EMA.

Introduction
The US Food and Drug Administration (FDA) and the European Medicines Agency (EMA) continue to closely monitor nitrosamine levels in pharmaceutical products since the initial discovery of N-nitrosodimethylamine (NDMA) in valsartan in 2018 prompted recalls of the drug. Later in 2018, N-nitrosodiethylamine (NDEA) was also found in some lots of valsartan, prompting further recalls. In 2019, several lots of losartan were recalled1 due to the presence of another nitrosamine contaminant, N-nitroso-N-methyl-4-amino butyric acid (NMBA). This was the first recall of an angiotensin receptor blocker (ARB) medicine due to NMBA contamination. These findings and recalls highlight the ongoing need for sensitive, selective methods for the analysis of multiple nitrosamines in pharmaceutical products prone to contamination by these potentially carcinogenic compounds.
The method presented here shows the utility of the highly sensitive SCIEX 7500 system for the analysis of six commonly monitored nitrosamines in losartan. Atmospheric pressure chemical ionization (APCI) is the preferred mode of ionization for nitrosamine assays, but a sensitivity comparison with the much more broadly used electrospray ionization (ESI) technique was performed to explore the sensitivity difference between these approaches. Lower limits of quantification (LLOQ’s) of between 0.01 ng/mL to 0.10 ng/mL, depending on the analyte, were reported for the nitrosamine compounds in this study.
Key features of the SCIEX 7500 system for nitrosamine monitoring
- E Lens probe and the D Jet ion guide 2 provide enhanced sensitivity through significant gains in the generation, capture and transmission of ions
- The OptiFlow Pro ion source provides flexibility and ease of use, with easily interchangeable ESI and APCI towers.
- SCIEX OS software is an easy-to-learn, easy-to-use platform for data acquisition and processing that is fully compliant with 21 CFR Part 11
Methods
Sample Preparation: Losartan API was weighed out and diluted to a final concentration of 20 mg/mL in 10% methanol in water.
Standards Preparation: Six nitrosamine compounds: NDMA, NDEA, NMBA, plus N-nitrosodibutylamine (NDBA), N-nitrosoethylisopropylamine (NEIPA) and N-nitrosodiisopropyl- amine (NDIPA), were obtained from Sigma Aldrich. The standards were dissolved and diluted in 10% methanol in water to calibration points covering a range of 0.01 to 100 ng/mL of each analyte. As described later, the high end of this calibration was not needed and not run.
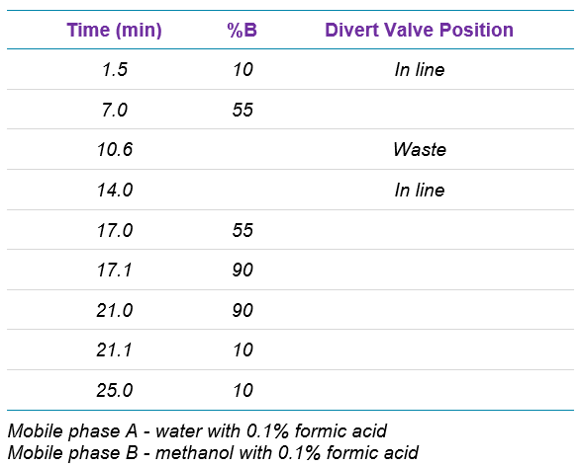
Chromatography: An ExionLC AD system with a Phenomenex Kinetex F5, 2.6µm 100 x 4.6 mm column (Phenomenex part # 00D-4723-E0) was used for separation. The column temperature was set at 40 °C. Combined mobile phase flow was set to 0.6 mL/min. A UV detector set to monitor 254nm was included in the system to verify the presence of losartan. An injection volume of 10 µL was used. Using the integrated divert valve on the MS system, the eluent was sent to waste during the elution of losartan to prevent the massive amount of that compound from entering the mass spectrometer. The timing of the gradient is shown in Table 1.
Mass spectrometry: Data was collected using the SCIEX 7500 system using the OptiFlow Pro ion source. As previously discussed, the compounds were analyzed by both APCI and ESI to compare sensitivities. Final data was collected using APCI. APCI parameters are listed in Table 2. The mass spectrometer was operated in positive polarity, using multiple reaction monitoring (MRM) mode, with the parameters shown in Table 3. The in-house nitrogen supply was replaced with UHP grade 5.0 nitrogen dewar to reduce the high baseline.
Data processing: All data was acquired and processed with SCIEX OS software 2.0.


Comparing ionization modes
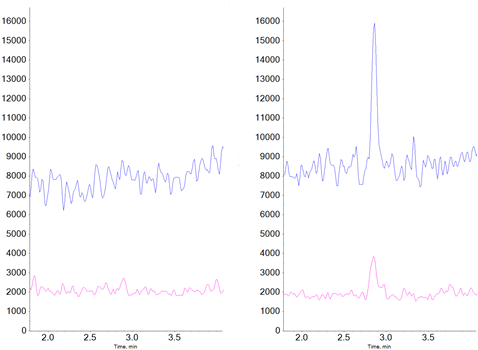
Electrospray ionization is by far the most common ionization technique used in LC-MS and LC-MS/MS analyses due to its generally good sensitivity and very broad compound coverage. However, ESI can be quite prone to ionization suppression due to matrix effects. For quantitative workflows, this makes it essential to prepare standards in a matrix approximating that of the samples an essential requirement to ensure consistent ionization efficiency between samples and standards. Some compounds do not ionize as efficiently by ESI as they do by APCI. For the compounds investigated in this study, the sensitivity and signal to noise ratios were greater by at least a factor of ten when using APCI versus ESI (Figure 2).
Quantification in matrix
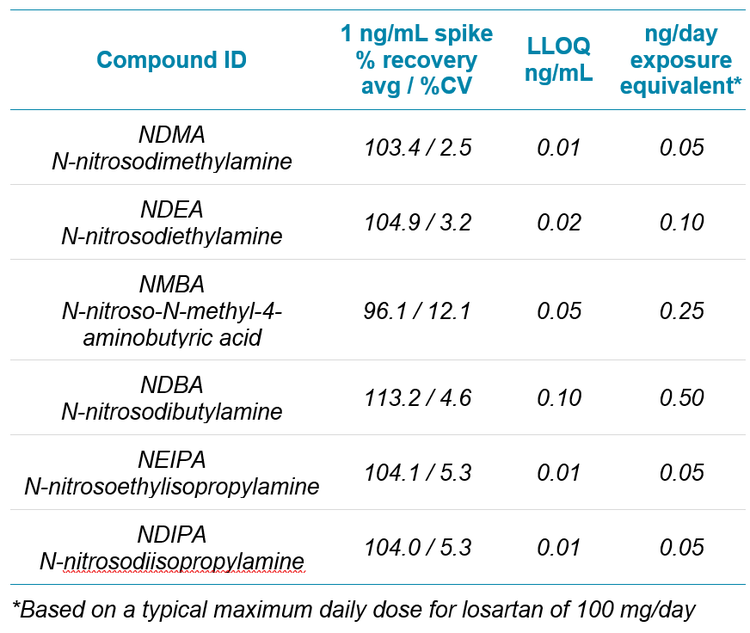
Due to a lack of an equivalent “blank” matrix to normalize matrix effects on ionization, spikes of each of the compounds were run, in replicate, at a concentration of 1 ng/mL in the extracted matrix. Consistent, accurate recoveries were seen for all compounds in the study, indicating minimal effect of the matrix itself on ionization of any of the target compounds. See Table 4 for a list of spike recoveries and individual LLOQs.
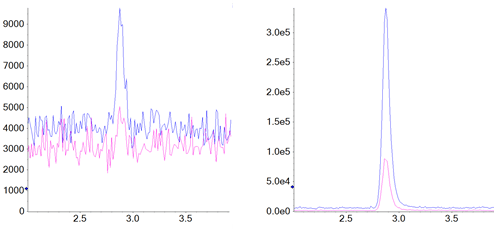
All six compounds showed a linear response from the LLOQ to the highest concentration, at 2.5 ng/mL. The upper limit of the assay was selected based on highest levels of analytes expected to be observed, and is not a reflection of the system capabilities The calibration of NDMA is shown as example in Figure 3. LLOQ chromatograms for all six compounds are shown in Figure 4.
Conclusions
The method presented demonstrated good chromatographic separation of the six analyzed nitrosamine compounds from the losartan API. It also showed good linearity over the concentration range monitored. The lower limits of quantification for each compound translate to daily intake limits significantly lower than those currently specified by the FDA and EMA. This ensures that the method will be suitable for lot release in the event of future increased restrictions around these important contaminants.
References
- US Food and Drug administration website.
- Enabling new Levels of quantification. SCIEX technical note RUO-MKT-02-11886-A.