Abstract
The class of sartans, like Irbesartan, Losartan, and Valsartan are angiotensin-II-receptor antagonists (ARB) that are used worldwide to lower blood pressure and improve blood flow and have recently been subject to large scale recalls due to with potential carcinogenic impurities. General Unknown Comparative Screening (GUCS)workflow is a simple and easy-to-use workflow that can greatly benefit pharma QC labs by enabling the streamlined detection of trace amounts of impurities to increase drug safety. Using SWATH acquisition on the X500R QTOF system, this workflow is demonstrated to show accurate impurity profiling and impurity monitoring as well as to detect and quantify trace amounts of potentially critical impurities.
Introduction
Valsartan is a prescription drug used to treat high blood pressure and heart failure. In 2012 the patent for the drug expired allowing many generic manufacturers to enter the market. Six years later on July 2018, regulatory agencies around the world issued voluntary recalls for many pharmaceutical products that contained Valsartan because N-nitrosodimethylamine (NDMA), a known carcinogen and genotoxin, had been found in the bulk ingredient.1,2 More recently N-nitrosodiethylamine (NDEA) was also identified. These impurities are now thought to originate from a change in synthesis that occurred back in 2012, even though no impurities were detected at the time and all regulatory agencies and supervisory authorities gave their approval for these changes.
The class of sartans, like Irbesartan, Losartan, and Valsartan are angiotensin-II-receptor antagonists (ARB) that are used worldwide to lower blood pressure and improve blood flow. The latest FDA recall now identifies over 1000 ARB product lots for their contamination with potential carcinogenic impurities.3 These recalls have profound effectson loss of business, loss of reputation, and loss of trust - not only for the pharmaceutical companies themselves but also for the regulatory agencies that oversee operations.
New analytical techniques and workflows could be of great benefit to pharma QC labs as the tests that had been in use were insufficient to immediately and decisively detect these impurities. This technical note demonstrates the use of an LC-MS/MS General Unknown Comparative Screening (GUCS) workflow that can increase drug safety through quantitative detection of impurities, allow batch-to-batch monitoring for comparison, and is easy to learn and implement in QC labs.
Key features of pharma QC analysis on the SCIEX X500R QTOF LC-MS/MS System
- The X500R QTOF LC-MS/MS System is a high resolution accurate mass system for non-targeted screening, suspected screening, and targeted analysis in a benchtop instrument
- The GUCS workflow using SWATH® Acquisition and SCIEX OS Software 1.5 allows easy, accurate, and fast impurity and QC analysis of batch-produced active pharmaceutical substances versus a reference standard
- MarkerView™ Software enables statistical analysis to highlight potential impurities that may be originating from shared production sites for generic medical products
Methods
Sample preparation: After weighting and grinding, 10% by weight of the Valsartan tablets was transferred into 1.5 mL centrifuge tubes, 500 µL methanol added, and the tubes shaken vigorously for 5 minutes, followed by sonication for 5 minutes. Next, 500 µL MilliQ-water was added, the tubes shaken for 5 minutes, and sonicated for 5 minutes. The samples were then centrifuged at 10,000 rpm at 4 °C for 35 minutes. Finally, the supernatants were transferred directly into brown glass vials.
Chromatography: Two LC methods were used with the SCIEX ExionLC™ AD System. In both cases Buffer A = water + 0.1% FA and Buffer B = acetonitrile + 0.1% FA.
- Optimized LC conditions for NDMA and related impurities: 10 µL sample was injected onto a Phenomenex Synergi Polar 100x4.6; 2.5 µm column. A flow rate of 900 µL/min was used with the gradient outlined in Table 1.
- Generic impurity profiling conditions: 3 µL sample was injected onto a Phenomenex Luna Omega Polar 100x2; 1.6 µm column. A flow rate of 600 µL/min was used with the gradient outlined in Table 1.

Mass spectrometry:Two different acquisition methods were used with the SCIEX X500R QTOF LC-MS/MS System:
- Optimized MS conditions for NDMA and related impurities: Positive ion mode atmospheric pressure chemical ionization (APCI) was used as it is known to have the best ionization efficiency to detect NDMA and related impurities. Information dependent acquisition (IDA) was used for monitoring the top 10 candidates using smart dynamic exclusion. TOF MS: 65-400 amu, 100 ms accumulation time. TOF MS/MS: 50-400 amu, 60 ms accumulation time. Total cycle time 0.9 s, Collision energy 40 V with spread of +/- 20 V, source temperature 480 °C, nebulizer current 5 µA, DP 60 V, CUR 30 psi, CAD 7, GS1 65 psi.
- Generic impurity profiling conditions: As the majority of polar and semi-polar compounds can be easily ionized using electrospray ionization (ESI) it was used in positive and negative ion mode for general screening and statistical analysis using SWATH Acquisition. TOF MS: 70-750 amu, 100 ms accumulation time. TOF MS/MS: SWATH acquisition using 12 variable windows at 60 ms accumulation time per window. TOF MS/MS mass range 50-750 amu. Total cycle time 2 s. Collision energy 40 V with spread of +/- 20 V source temperature 540 °C, IS 5500, DP 80 V, CUR 30 psi, CAD 7, GS1 65 psi, GS2 75 psi.
Data processing:SCIEX OS Software 1.5 was used for data acquisition and data processing. The GUCS workflow was accomplished using the non-targeted data processing method within the Analytics portion of the software and an internally developed library (which is user selectable). MarkerView Software was used for statistical analysis.
GUCS workflow for impurity analysis
The classic workflow using LC-MS/MS for unknown screening suffers from information overload: thousands of features, which are typically detected within a real sample make it nearly impossible to detect a single, important, unwanted and possibly low abundant impurity within an appropriate timeframe. In contrast, GUCS workflow employed by the SCIEX X500R QTOF System and SCIEX OS Software 1.5 allows the automated comparison of a reference sample or standard against one or more samples and focuses on the relevant features which are not present in the reference. The GUCS workflow is ideal for impurity profiling and pharma QC where the safety profile of pharmaceutical products can be more accurately assessed without investing considerable additional time.
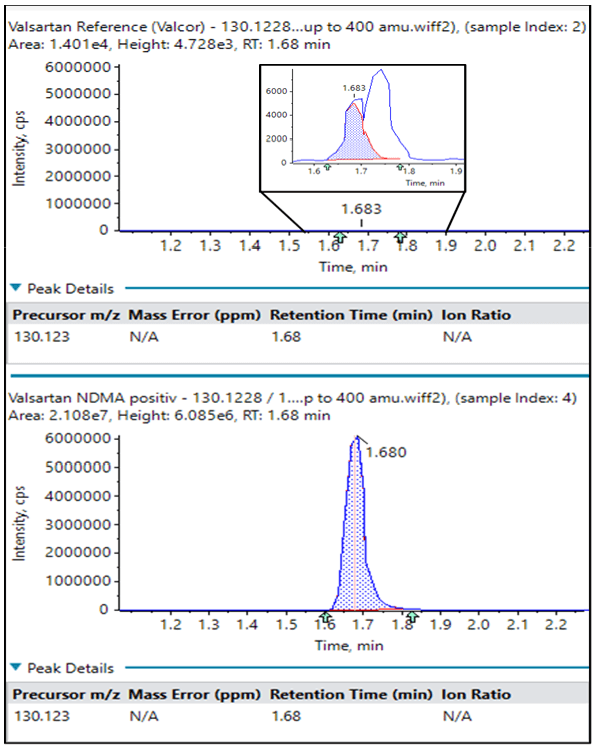
Because NDMA was known to be a contaminant in many Valsartan products, the first part of this study was to develop an optimized LC-MS/MS method for detection of NDMA and related compounds using the GUCS workflow (Method 1 for chromatography and mass spectrometry).
Table 2 lists differentially detected peaks from a GUSC analysis of a generic Valsartan medicinal product (1A Pharma, HL6907) against a reference standard (Valsacor D60897). The GUSC workflow uses an algorithm to search for peaks in both the reference and the sample and then performs a library search on anything exceeding a threshold specified in the method. In this case, all compounds that were detected with an area ratio >7x sample:control are listed and sorted according to abundance. Twenty-four compounds were detected in the generic product that were not detected in the reference standard (or were significantly lower).

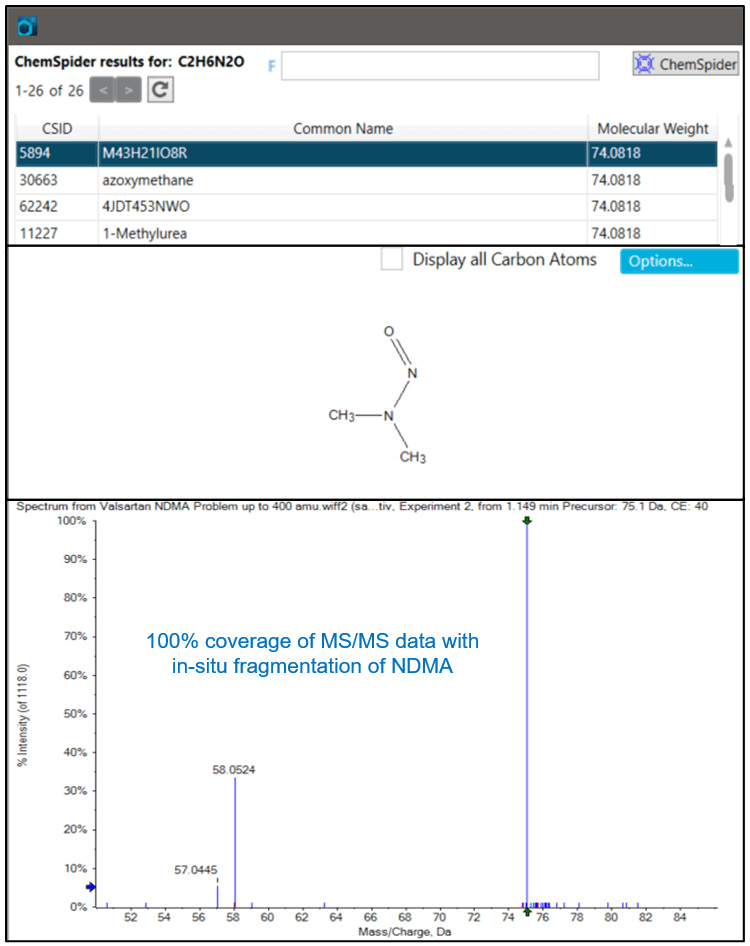
If a peak is not identified from the library search, the user has the option to initiate a ChemSpider search with a single click. ChemSpider will search for the best chemical formula that matches the accurate mass and isotopic ratio information from the MS data. Then using the structure file (.mol file) returned from ChemSpider, the AutoFrag tool will perform an in situ fragmentation and match it to the experimental MS/MS data.
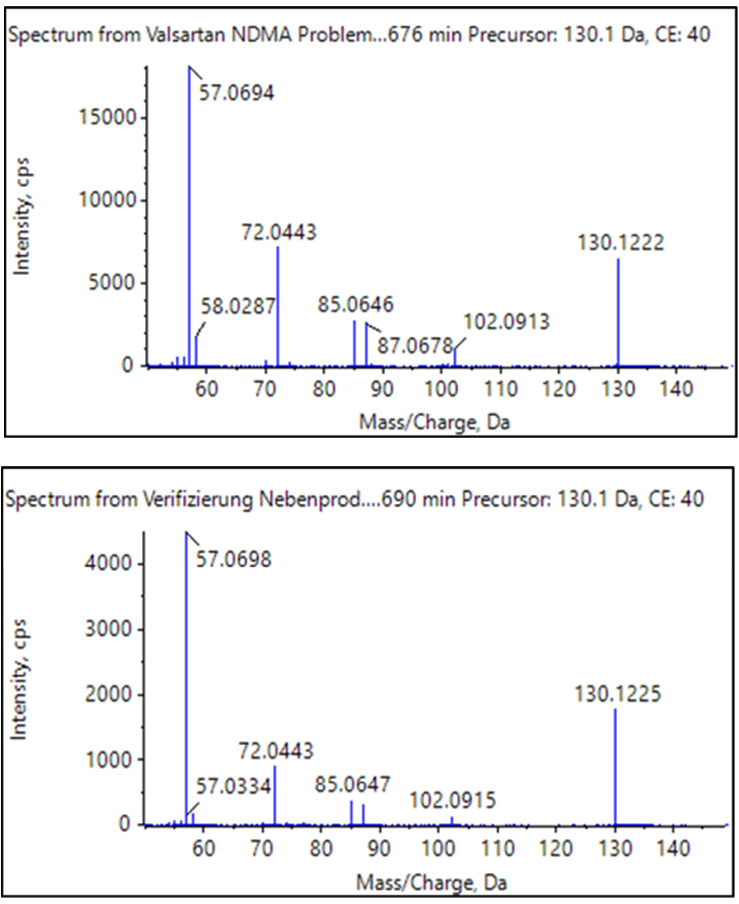
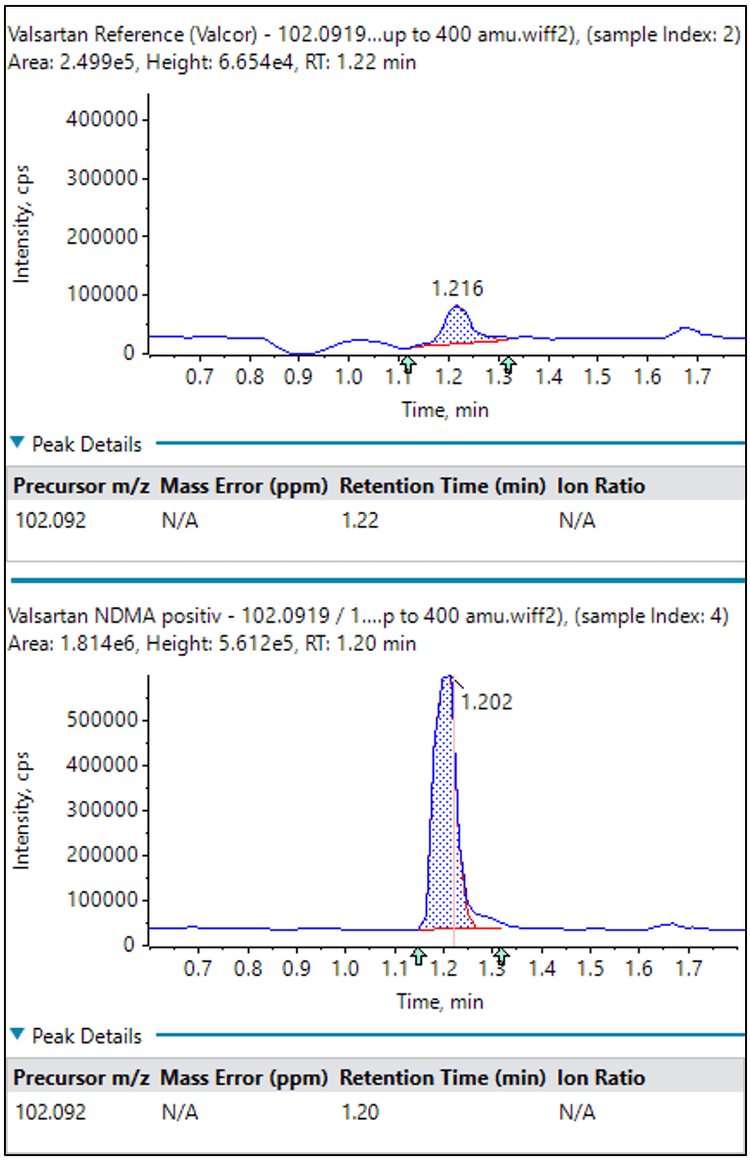
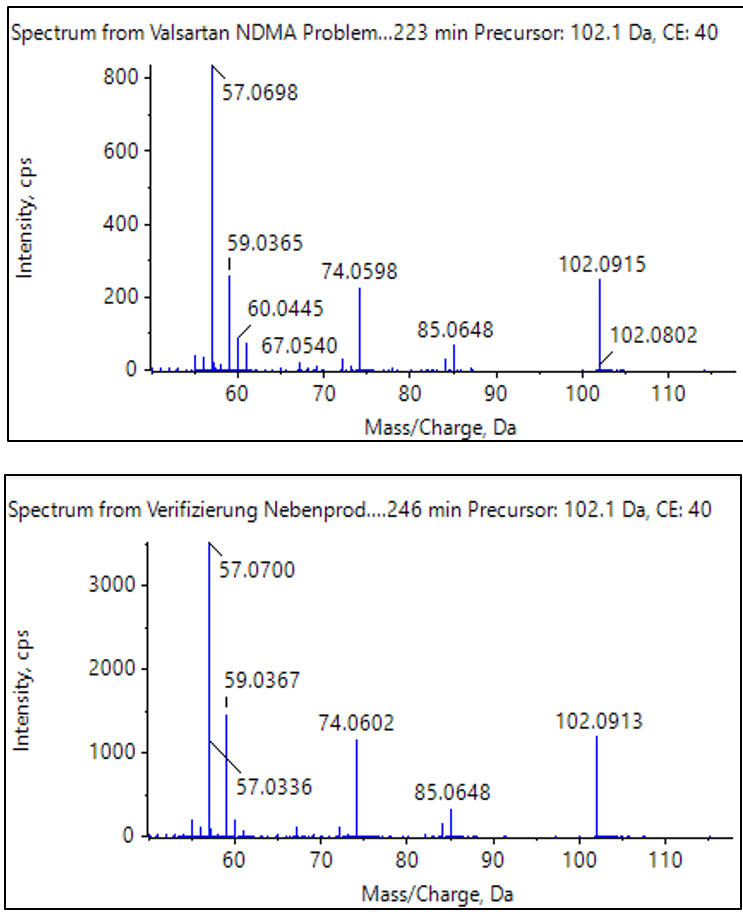
NDMA was identified to be the third most abundant impurity during the automated library searching. As shown in Table 2, NDMA was over 170x higher in abundance in the 1A Pharma product compared with the Valsacor reference standard.
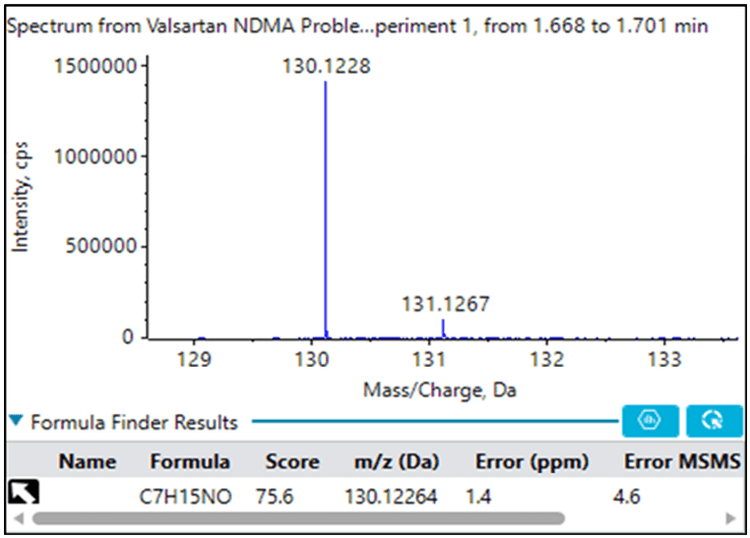
If NDMA had not been identified during the library search, Figure 2 demonstrates the ChemSpider and AutoFrag workflow. Using high resolution accurate mass and isotopic ratio information from the MS data, a formula of C2H6N2O is predicted for m/z 75.0559. Next, the ChemSpider search returns possible compounds that match this formula. The AutoFrag tool then performs an in-situ fragmentation of the ChemSpider structures and compares it to the actual measured MS/MS fingerprint. NDMA matches with high coverage and is clearly the correct identification.
As the majority of organic compounds can more easily be ionized using positive ion electrospray ionization (ESI), a more generic method for the GUCS workflow (as outlined in Method 2) was used for the second part of this study. Using ESI and SWATH acquisition, the number of differentially detected components significantly increased by about a factor of 24 using identical search criteria. Although this method is not optimized for NDMA, and is, instead, a more general approach for detecting all compounds, all three compounds previously discussed (NDMA, valeramide, and dimethylvaleramide) were detected above the 7x threshold.
The list of differentially detected compounds using the generic method is much larger with potentially many more unidentified peaks than the list generated using the NDMA optimized method. However, because the chemical reactants in the synthetic pathway are known, and the tablet matrix is known, this narrows down the universe of reasonable suggestions. Thus, the GUSC workflow is highly suitable to monitor batch-to-batch quality issues, identify active component synthesis issues and modifications, and even identify the origin of production – particularly with statistical analysis as shown next.
Statistical analysis for batch comparison
Another approach to identify potential problems is through the use of statistics. Nine different Valsartan samples from various manufacturers were analyzed using ESI SWATH acquisition (Method 2) and then the raw data were directly imported into MarkerView software. Each sample was run multiple times to account for any autosampler variability or slight chromatographic differences.
Figure 7 shows the unsupervised principal component analysis (PCA) within MarkerView Software. The PCA analysis is performed using m/z, intensity, and retention time for each peak in the data. All replicates group nicely for each Valsartan sample. In fact, PCA is an easy way to assess overall reproducibility since a high degree of reproducibility will be reflected by close clustering within one group. A reproducible LC-MS/MS method is key to detecting small differences between related groups, e.g. low abundant impurities from batch-to-batch production.
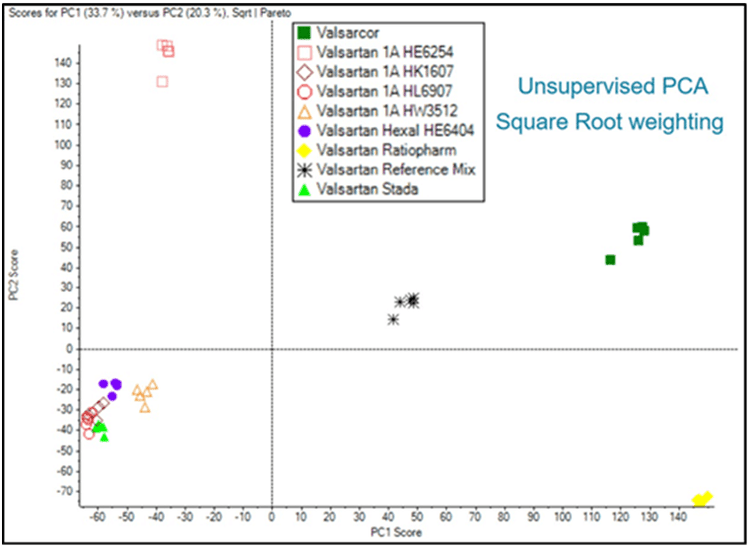
Valsartan Ratiopharm, yellow, lower right quadrant, Valsacor, green, upper right quadrant, and Valsartan 1A Pharma HE6254, red squares, upper left quadrant, are significantly different from the Valsartan products located in the lower left quadrant. In between the above discussed groups, the Valsartan Reference Mix, black asterisk, middle, reflects the average of all samples. This sample was created as a mixture of the other 8 samples and as such, shows commonality with all samples as a cluster in the middle.
Interestingly, the 1A Pharma HE6254 in the upper left quadrant is separated from other 1A Pharma batches in the lower left quadrant indicating there are significant differences between this batch and the other 1A Pharma batches.
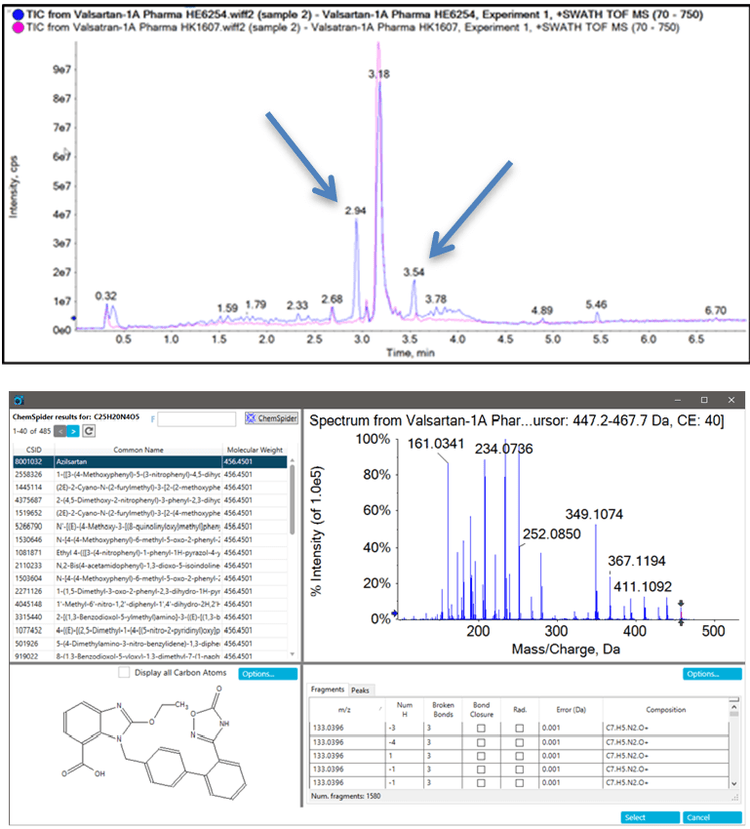
Overlaying the TIC data for HE6254 with one of the samples in the lower left quadrant (HK1607) shows two major peaks detected in HE6254, which were not detected in any other sample (Figure 8). Further analysis of the peak at RT 2.93 min with m/z 457.1498 indicates that it is azilsartan, while the peak with RT 3.53 min with m/z 569.1662 is azilsartan-medoxomil. Both of these compounds had been unknowingly spiked into the samples by one of our collaborators as a test of the workflow.
Conclusions
GUCS workflow is a simple and easy-to-use workflow that can greatly benefit pharma QC labs by enabling the streamlined detection of trace amounts of impurities. Because of the high resolution and mass accuracy of the X500R QTOF System, the workflow provides excellent selectivity for both qualitative and quantitative analysis even in complex formulations and matrices. This type of workflow is mandatory in order to ensure accurate impurity profiling and impurity monitoring as well as to detect and quantify trace amounts of potentially critical impurities. In combination with comprehensive SWATH Acquisition, relevant differences between a reference and one or more samples can easily be detected, verified, and identified from the MS/MS data.
Statistical analysis can provide further insight into impurity origins by highlighting inconsistencies on a larger batch-to-batch scale. Differences between batches and production sites can be discerned that can help pinpoint the origin of any impurities due to changes in synthetic route or other factors.
References
- Valsartan. German Federal Institute for Drugs and Medical Devices, BfArM, press release no. 5/18, 2018, July 4, 2018.
- Food and Drug Administration, FDA announces voluntary recall of several medicines containing Valsartan following detection of an impurity, July 13 2018.
- FDA ARB Recalls: UCM615703.pdf, November 2018, 27th.
Acknowledgements
This work was initiated and driven by the Group of Prof. Fritz Sörgel, Institute for Biomedical and Pharmaceutical Research, IBMP, Prof. Ulrike Holzgrabe, University of Würzburg, and Prof, Mona Tawab, Zentrallaboratorium Deutscher Apotheker e.V., and their teams, respectively. Thanks to Dr. Clemens Bidmon for coordinating and summarizing the status quo around the latest findings.