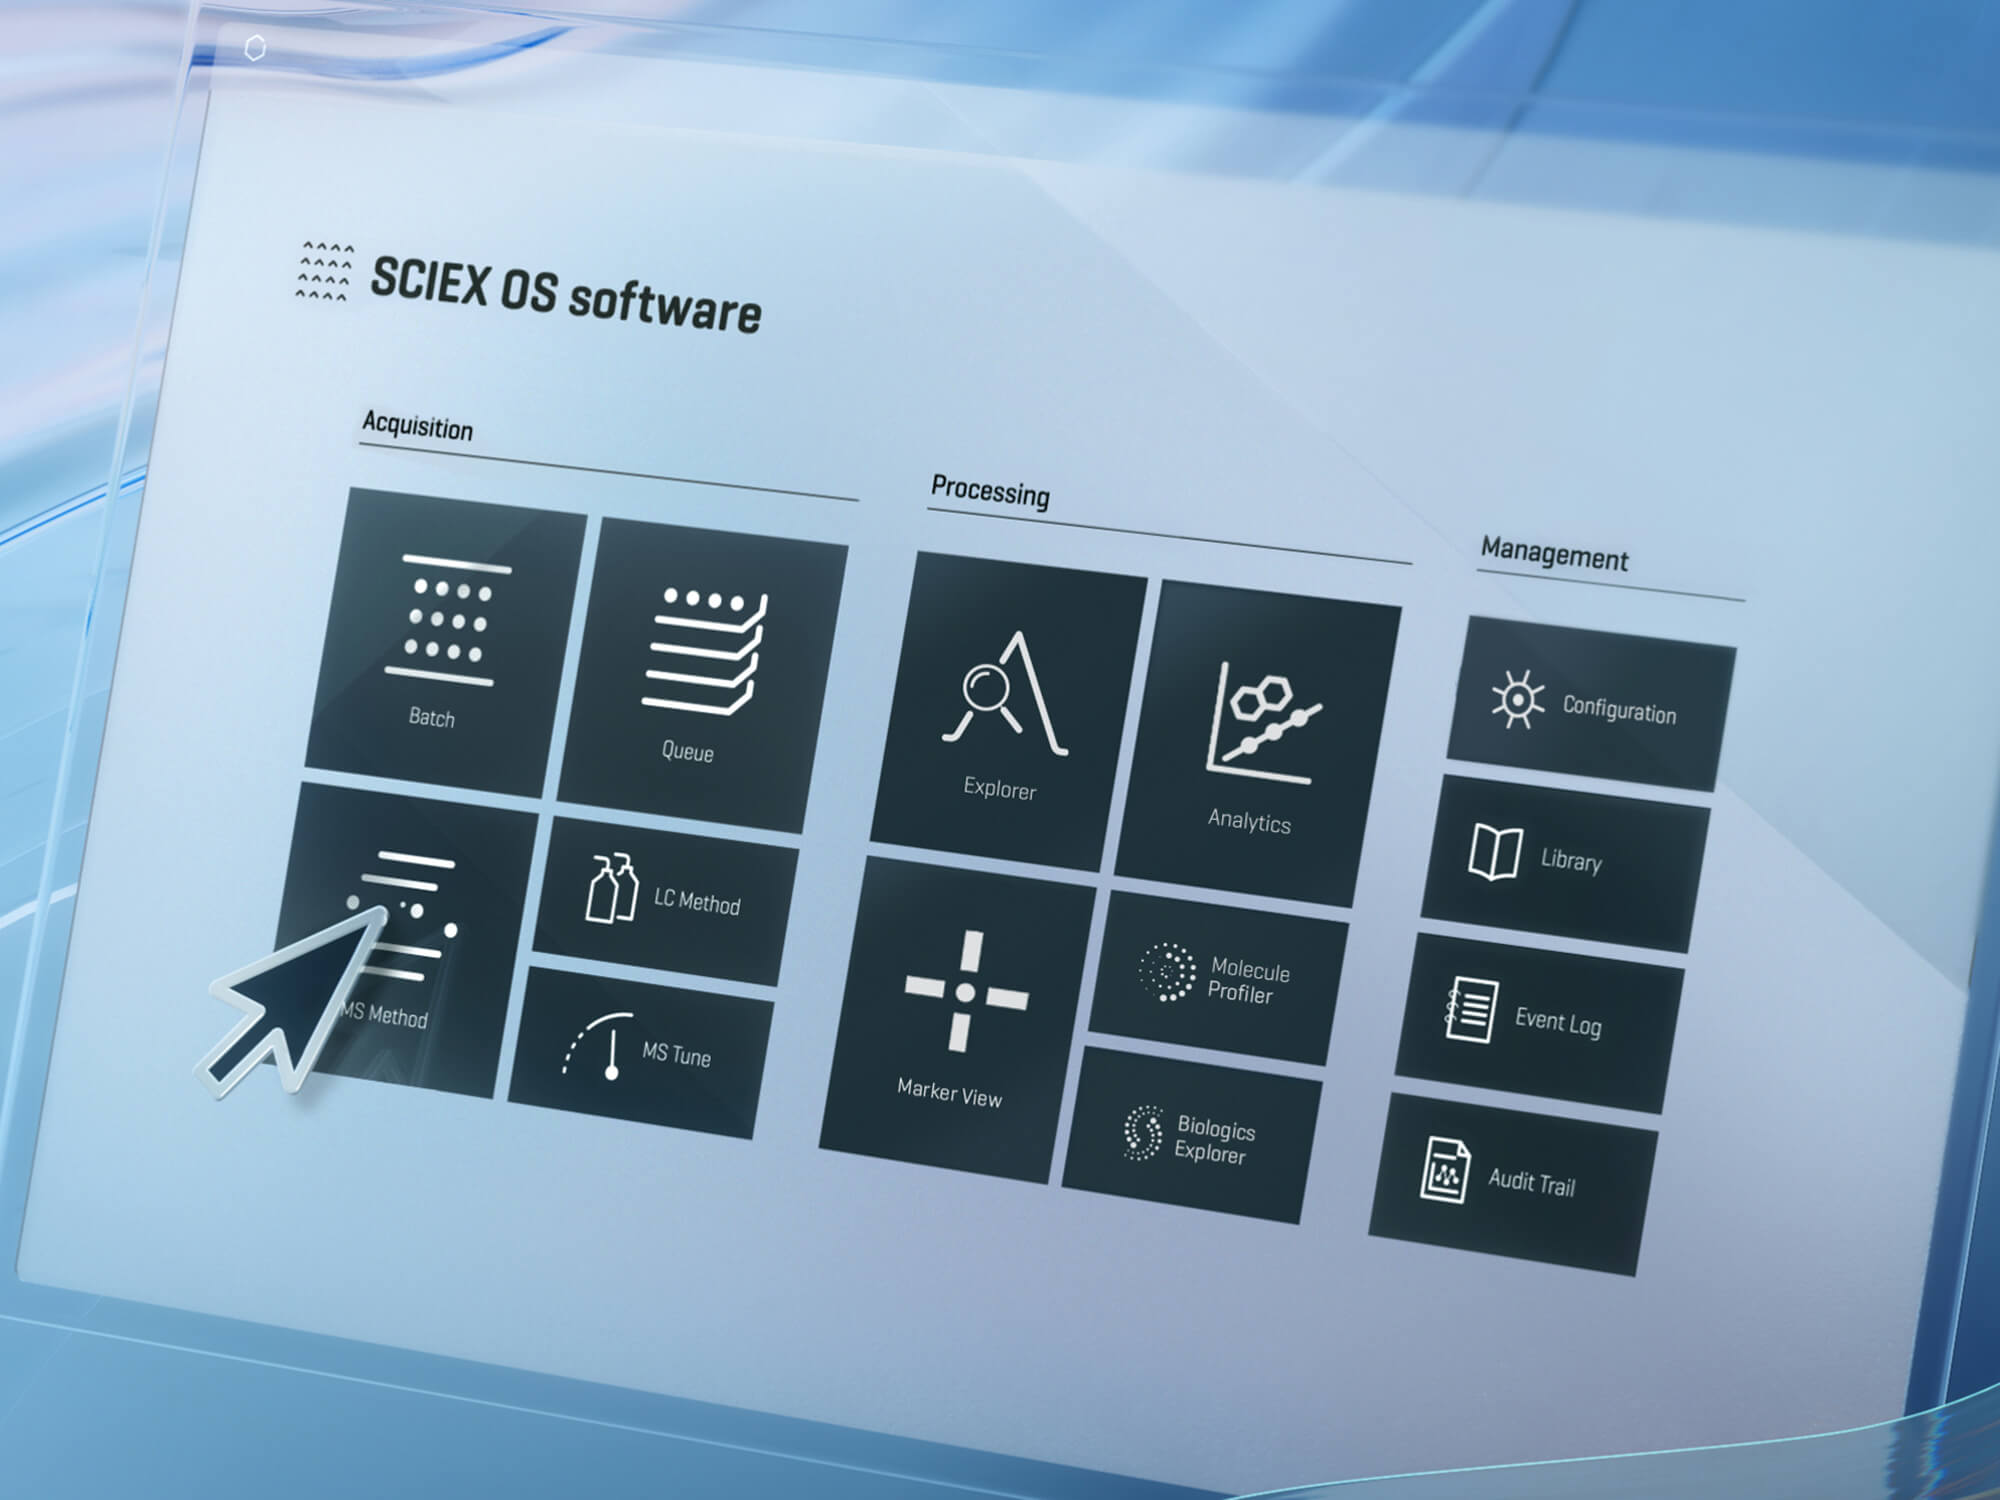
Designed with non-statisticians in mind and intuitively developed, MarkerView software does the heavy lifting so you can focus on high-value decisions like reviewing trends and differences in targeted or untargeted mass spec workflows. Distil complex datasets quickly, find statistically significant differences and reveal key insights faster. MarkerView software is now integrated into the SCIEX OS ecosystem. Learn more about what’s new in the latest version

Smarter, faster and simple statistical analysis software
MarkerView software - your statistical data analysis software
MarkerView software difference
Powerful
Interrogate your data with powerful statistical tools, such as principle components analysis (PCA), principle components variable grouping (PCVG) and T-tests.
Simple
| Find significant trends and differences to get to your biological answers easily. MarkerView software enables you to interpret your results through intuitive and interactive plots. |
Flexible
Directly import your processed results from Zeno SWATH DIA , LipidView software or SCIEX OS software into MarkerView software to generate
Go from data to results
Interpret complex lipidomics datasets more efficiently
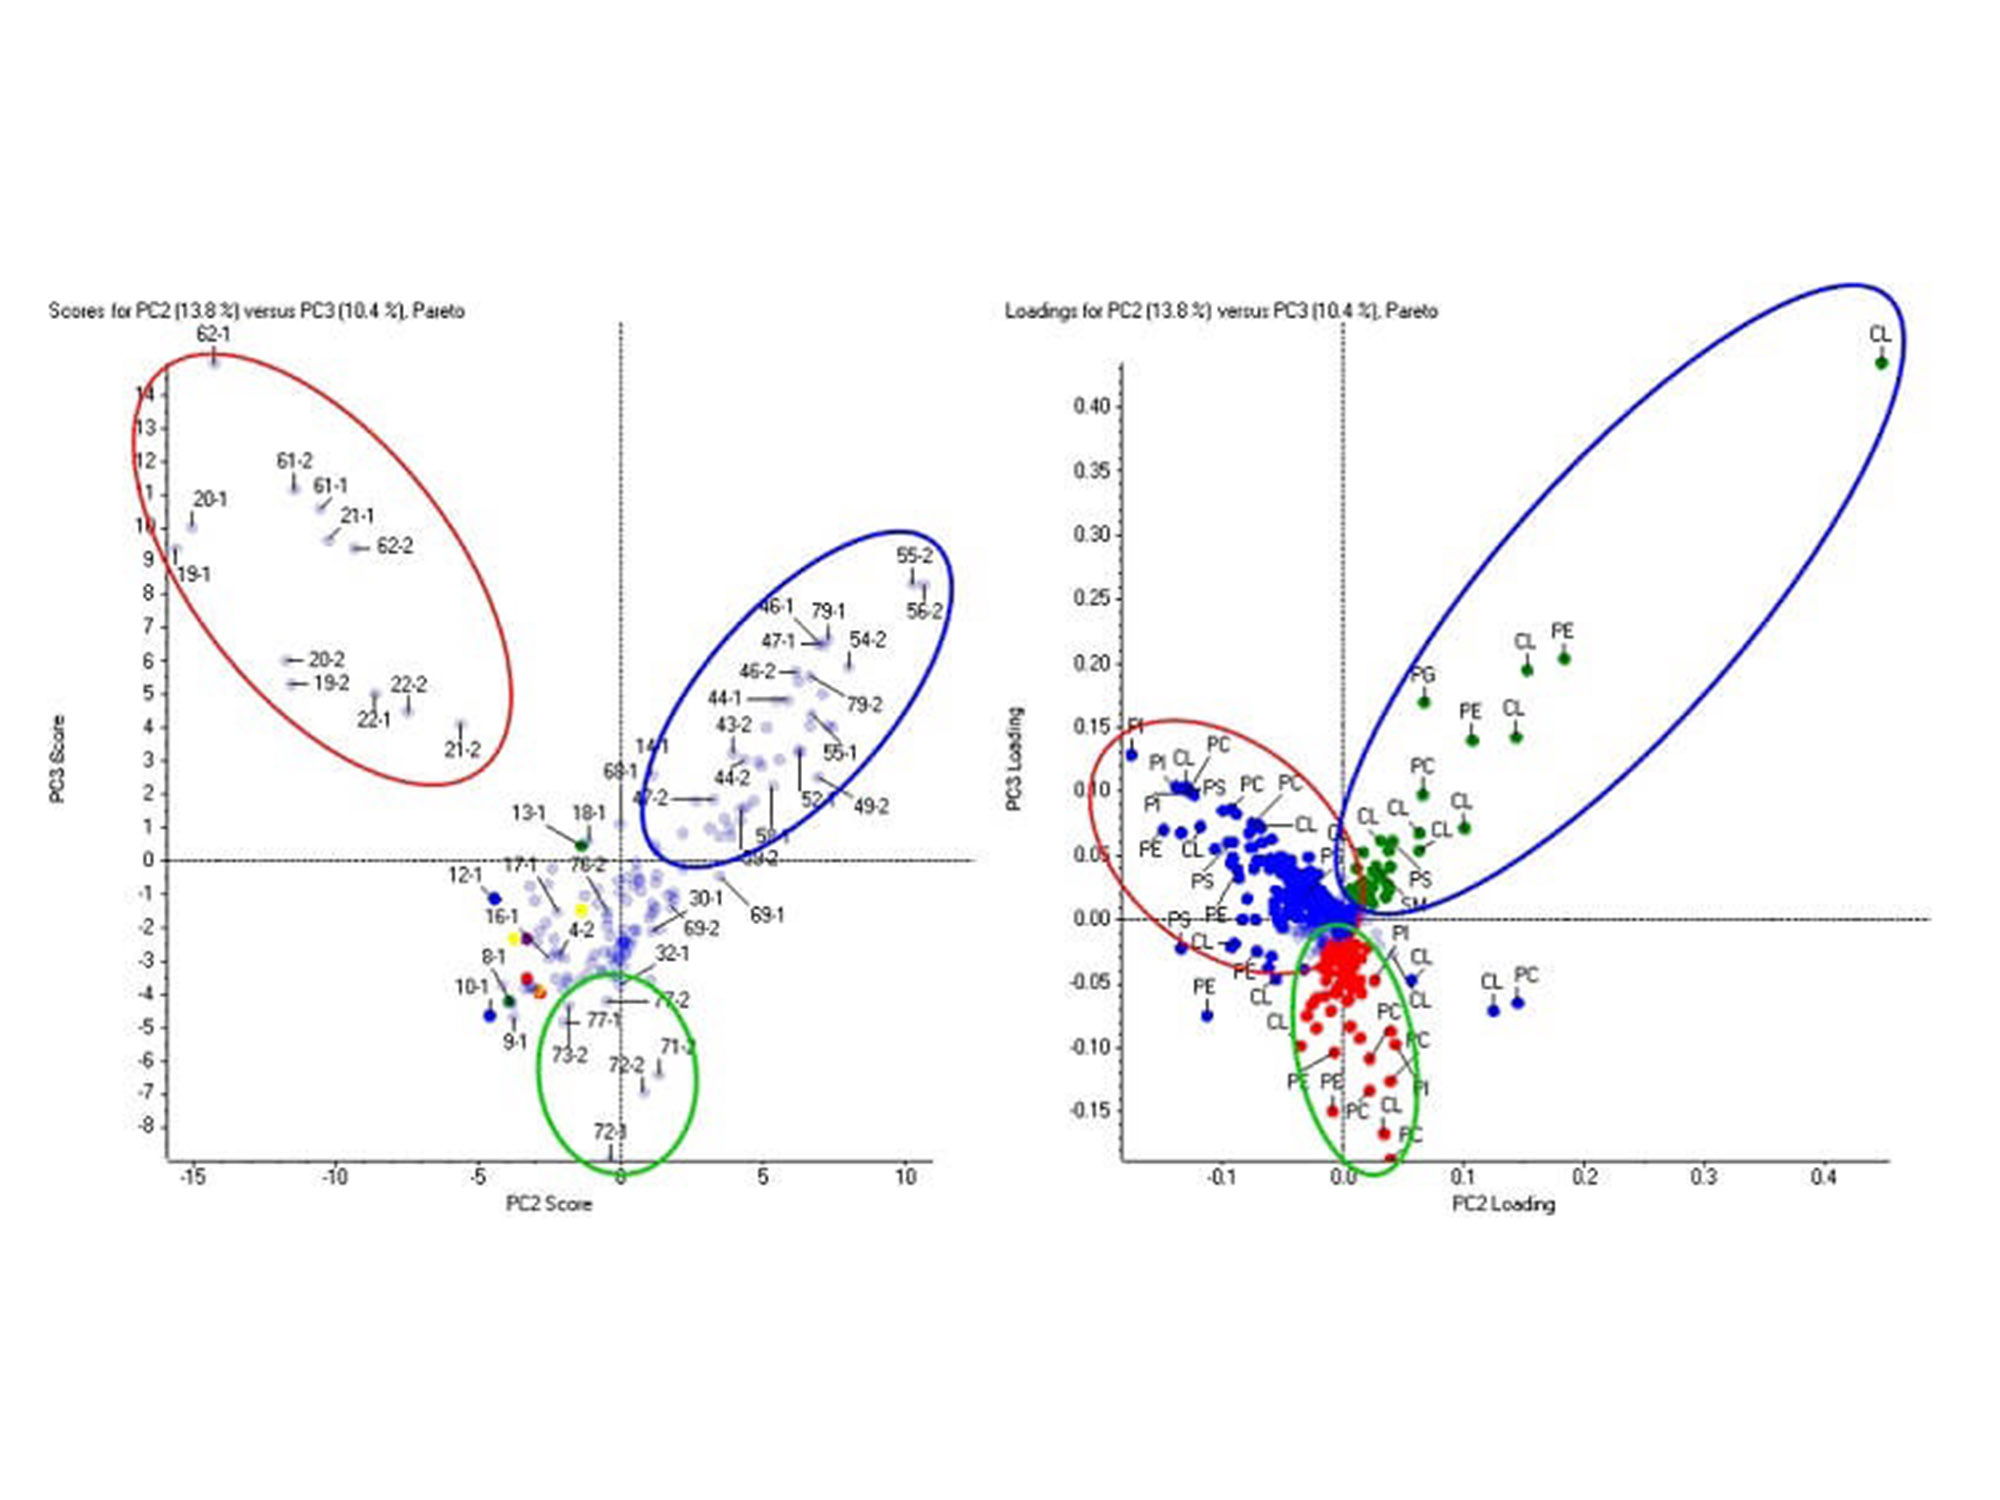
Lipids are efficiently identified and quantified in LipidView software. After which, lipid expression trends can be visualized across all biological samples using principal component analysis (PCA) in MarkerView software. The principal component variable grouping (PCVG) clusters lipids according to its similar quantitative profiles.
Comparative lipid profiling in MarkerView software. The phospholipids and cardiolipins (loadings plot, right) differentiate the three groups of samples (scores plot, left). This data was collected on the TripleTOF 6600 system from a lipidomics profiling study.
General unknown screenings workflow for food and environmental testing
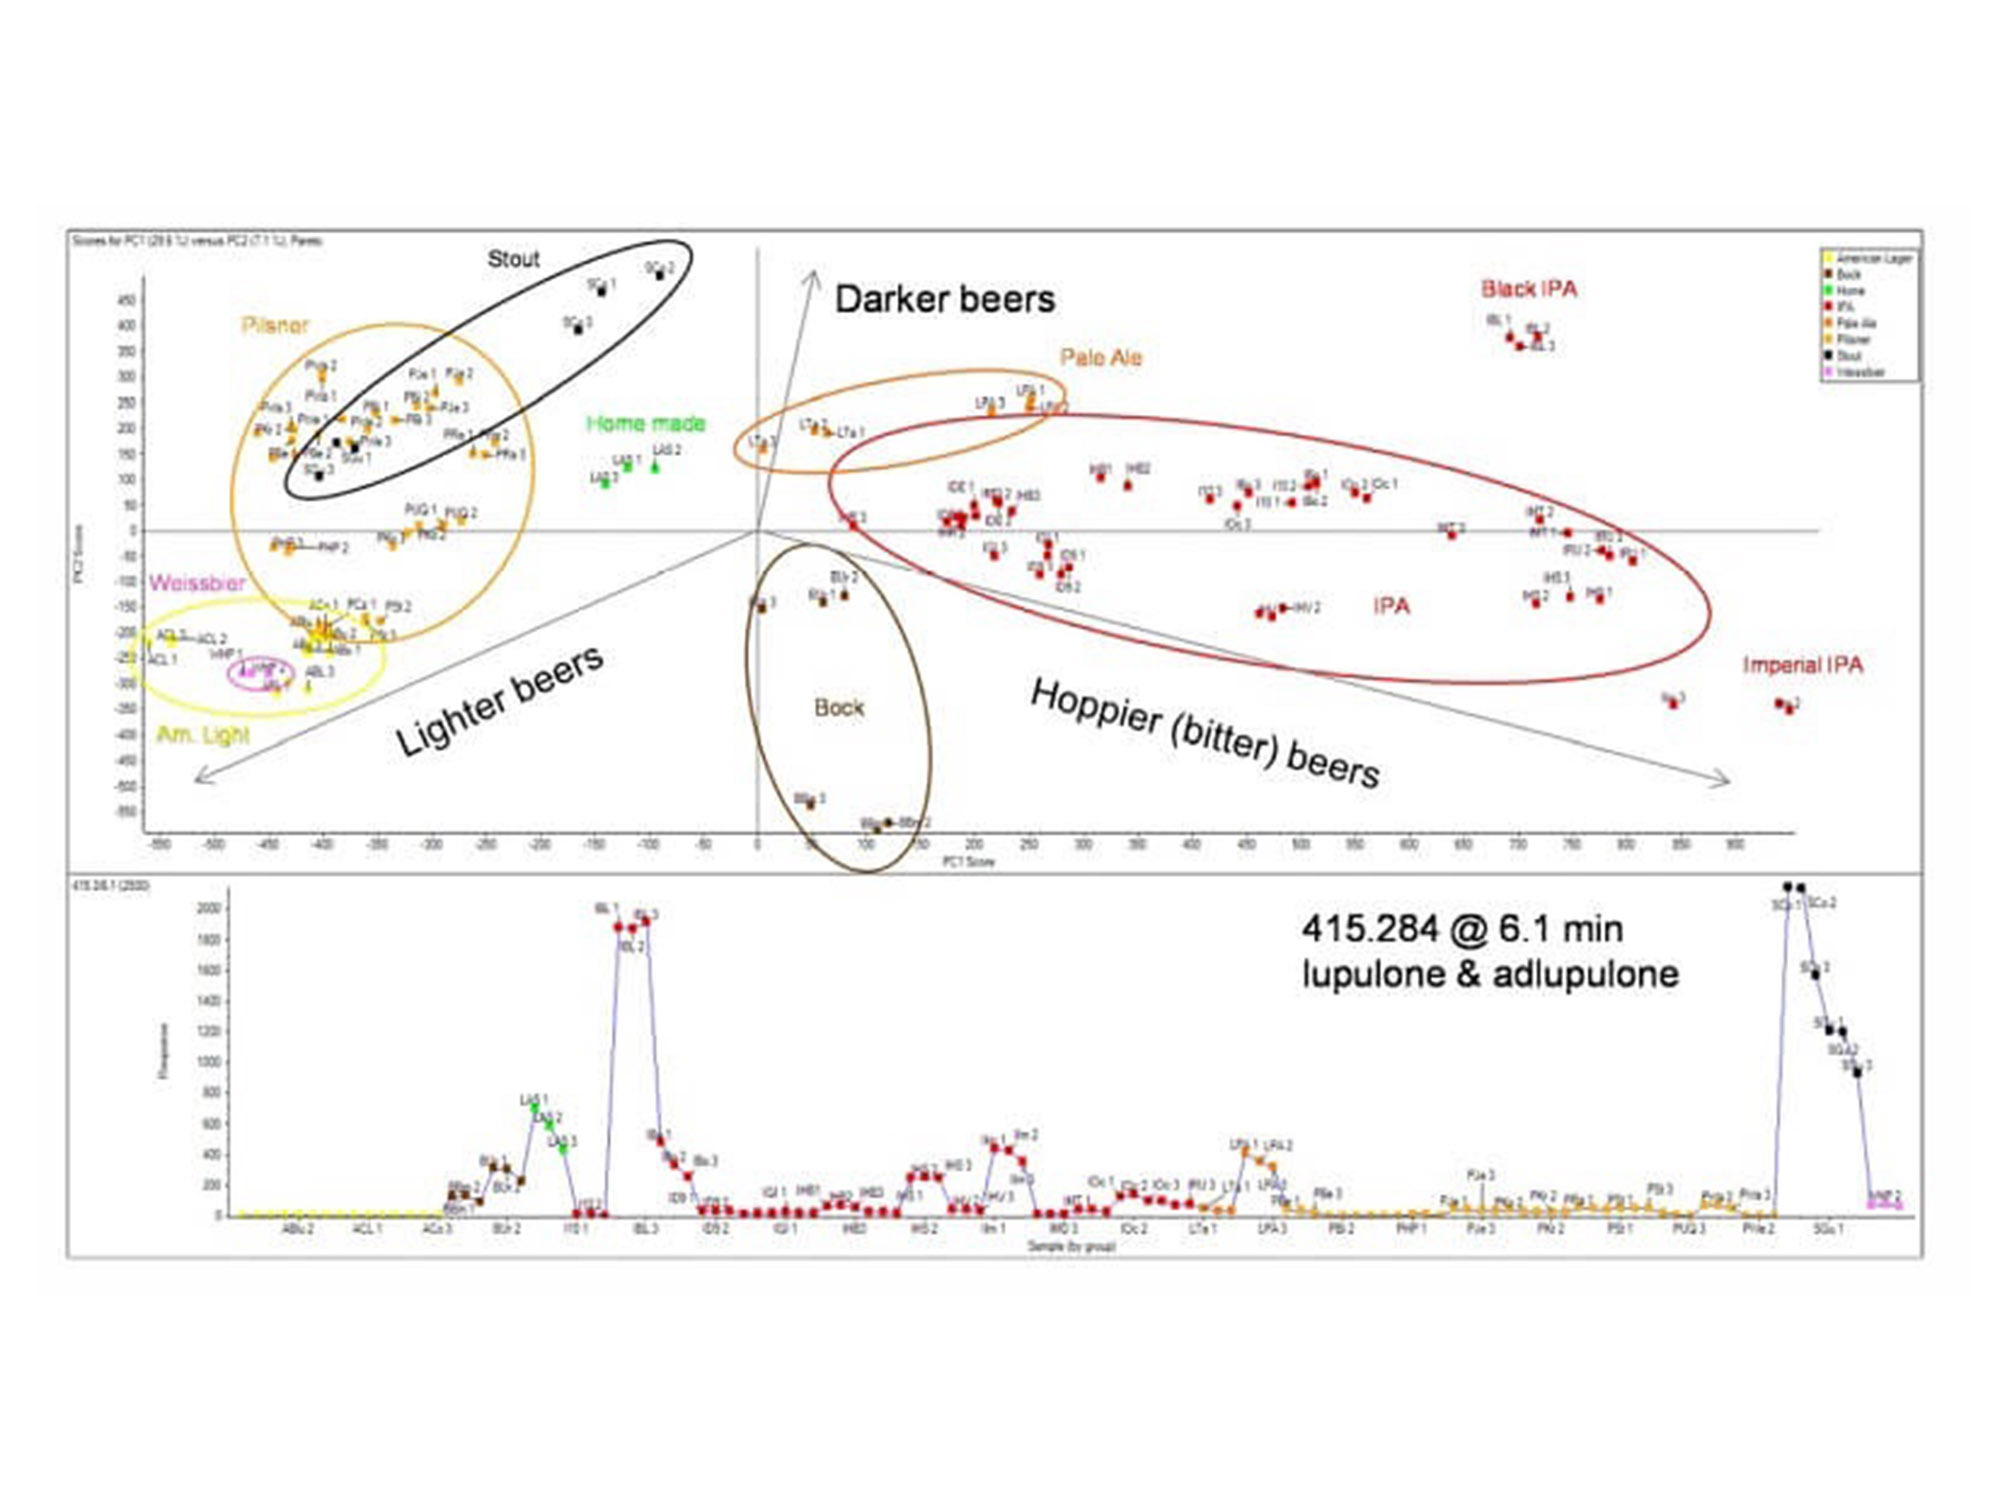
General unknown screening using an untargeted data dependent approach (IDA), allows researchers to profile large numbers of components across samples to characterize differences. This workflow was used to profile the differences between 40 commercially available beers.
Principal components analysis: The image above shows PCA scores plot beers of different styles clustering based on similarities in quantified features. Beers were differentiated from each other based on the hop content. The b-acids lupulone and adlupulone were found in higher concentrations in darker beers, such as stout and black IPA, as the profile plot (bottom trace). This data was collected on the X500R QTOF system.
Effectively find relationships in your metabolomics results
Use library searching to quickly identify metabolites first then perform principal component analysis on the known species to drive your biological interpretation faster. Easily employ t-test analysis and rank significantly differential metabolites by p-value.
The transition from MasterView software for statistical analysis. Metabolites are identified and quantitated using the accurate mass metabolomics spectral library in MasterView software. Three different phenotypes from the Zucker rat model were differentiated based on their metabolic profiles using a data independent technique known as SWATH Acquisition. This data was collected on the TripleTOF 5600+ system analyzing extracted plasma.
Find protein clusters rapidly from SWATH acquisition data
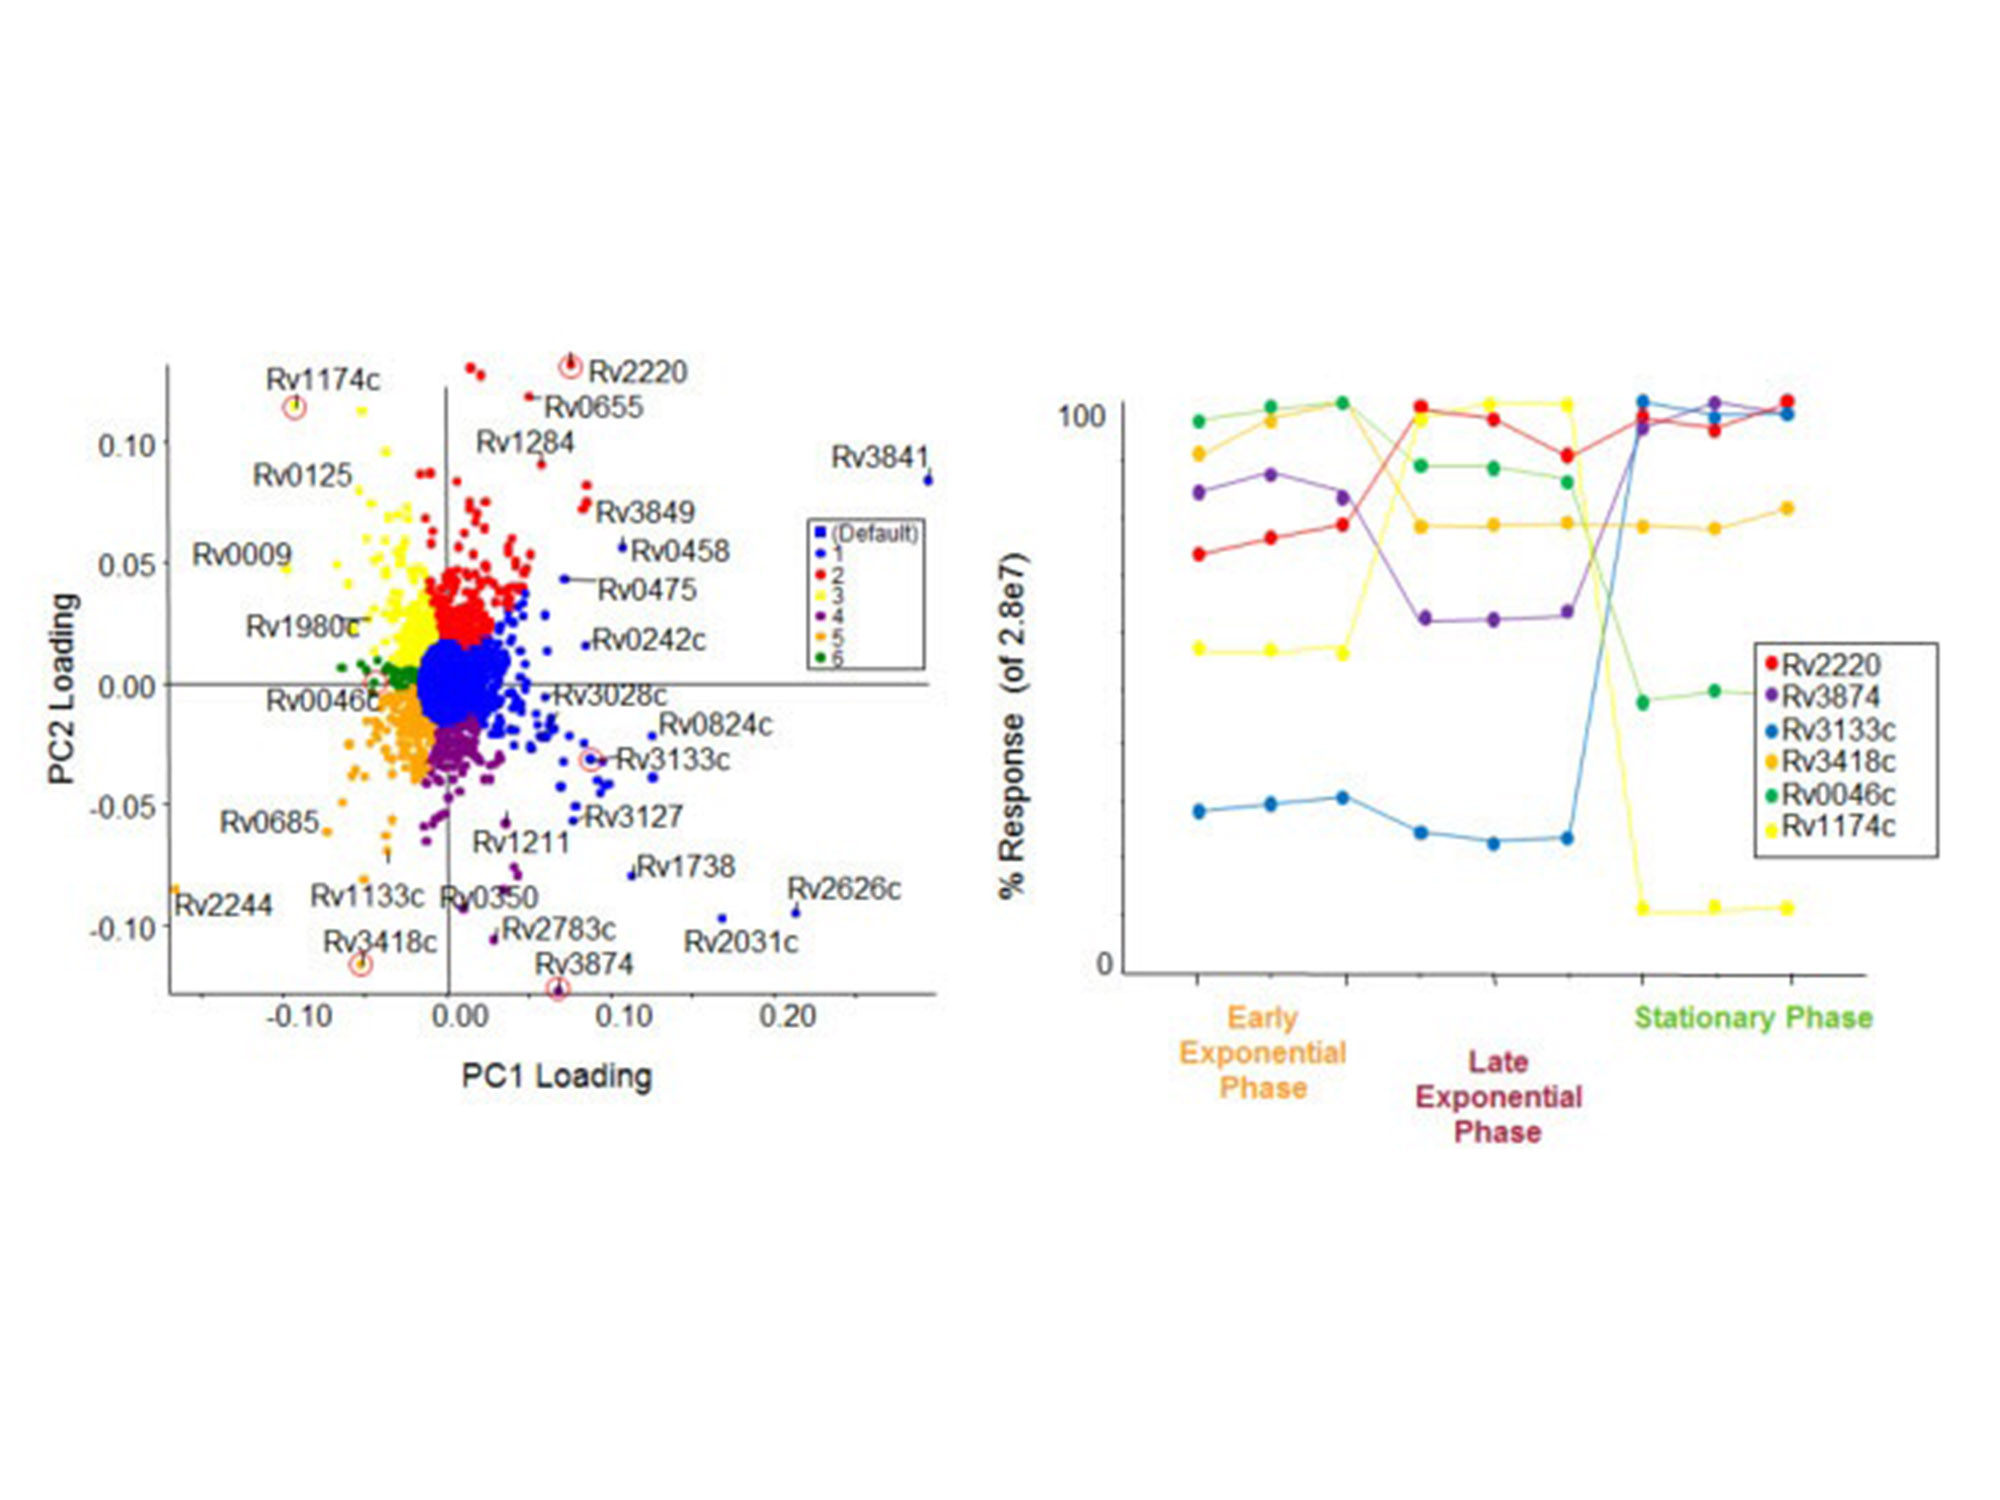
An in-depth analysis of SWATH proteomics data using SWATH acquisition 2.0 confirms and quantifies many proteins and peptides across many samples. This feature table is then directly exported to MarkerView software for statistical analysis, using visualizations like PCA/PCVG and T-tests.
Trend analysis from SWATH proteomics aata. Using MarkerView software, PCA analysis was used to determine the differences between proteins based on growth states of M. tuberculosis. PCVG was then performed to determine proteins with similar behavior, as shown by the colors on the loadings plot (left). Representative proteins (circled in red) from each PCVG group were selected, and the protein pattern was extracted to illustrate the protein expression changes (right). This data is collected on the TripleTOF 5600+ system on protein extracts from bacteria.
Compatible hardware and software
SCIEX mass spectrometers
The software is compatible with all SCIEX mass specs instruments and supports. wiff and *wiff2 formats and infusion MS/MSALL workflow.
Software
SCIEX OS software
Learn more