Abstract
This technical note demonstrates the unique capabilities of imaged capillary isoelectric focusing (icIEF)-UV/MS and electron activated dissociation (EAD)-based peptide mapping workflows for rapid charge heterogeneity analysis and comprehensive characterization of a GlyCLICK®-generated antibody-drug conjugate (ADC). These orthogonal, streamlined workflows provide multi-level information about product quality attributes (PQAs) of ADCs, facilitating important decision-making early in the development pipeline.
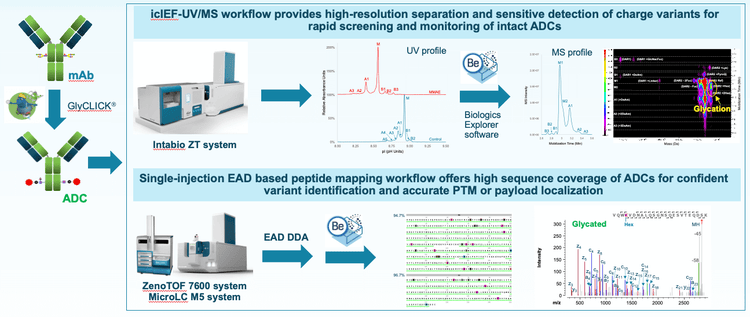
Charge heterogeneity, drug-to-antibody ratio (DAR) and posttranslational modifications (PTMs) are important PQAs of ADCs that need to be fully characterized and closely monitored to ensure the safety and efficacy of the drug molecules.1,2 Comprehensive PQA characterization typically involves multiple analytical assays using different instrument platforms and software packages. Streamlining resources with integrated and orthogonal technologies has the potential to reduce strain on resources and can facilitate method development and transfer throughout the development pipeline. These goals can be addressed by combining the power of orthogonal icIEF-UV/MS and EAD-based peptide mapping workflows for high-resolution separation and sensitive detection of charge variants, rapid DAR determination and accurate PTM or payload localization using a single MS platform and data processing software (Figure 1). These analytical techniques provide a level of characterization beyond traditional LC separation and CID based workflows to provide critical information to guide analytical strategies throughout development.
Key features of integrated workflows
- Rapid charge heterogeneity assessment: icIEF-UV/MS enables high-resolution separation and sensitive detection of charge variants.
- Confident proteoform identification: icIEF-UV/MS and LC-MS workflows provide confident identification and confirmation of proteoforms for each charge variant.
- PTM and Payload localization: EAD-based peptide mapping workflow offers high sequence coverage and accurate PTM or payload localization in a single injection.
Introduction
Antibody-based therapeutics, such as monoclonal antibodies (mAbs), multi-specific antibodies and ADCs, are highly heterogeneous due to the coexistence of various glycoforms, PTMs, degradation products, mis-paired species, aggregates and charge variants.1,2 These biotherapeutic PQAs need to be closely monitored and carefully controlled to ensure the safety and efficacy of the drug molecules.1,2
ADCs are new generation biotherapeutics consisting of an antibody conjugated with cytotoxic payloads via chemical linkers.3 The complexity and heterogeneity of ADCs pose an analytical challenge to scientists from discovery to process development. Comprehensive characterization of charge heterogeneity, PTMs and ADC payload typically requires multiple analytical assays using different instrument platforms. In addition, it is challenging to fully characterize various proteoforms within biotherapeutic charge variants and localize labile PTMs using traditional CE- and LC-MS approaches.4-8
The icIEF-UV/MS workflow―offered by the Intabio ZT system ―coupled with LC-MS workflows provides a single-MS solution on the ZenoTOF 7600 system to achieve high-resolution separation, sensitive detection, accurate relative quantitation and confident identification of charge variants. The powerful capabilities of EAD technology offered by the ZenoTOF 7600 system enable comprehensive PTM analysis, isomer differentiation and disulfide bond mapping for enhanced peptide mapping.9-14 It was demonstrated recently that the combined benefits of orthogonal cIEF, icIEF-UV/MS and LC-MS workflows provided an in-depth characterization of infliximab and its charge variants.8
In this work, the icIEF-UV/MS and EAD-based peptide mapping workflows were leveraged to characterize charge heterogeneity in trastuzumab (Tras) and its ADC conjugated with the monomethyl auristatin E (MMAE) payload.
Methods
Sample preparation:
Site-specific conjugation of Tras with the MMAE payload was performed using the GlyCLICK technology (Genovis).
icIEF-UV/MS: Unconjugated Tras and its ADC (Tras-MMAE) were desalted and then mixed with the master mix solution containing arginine, pharmalyte 5 to 8 (Cytiva), pharmalyte 8 to 10.5 and 6.0 µg/mL peptide pI markers. The solution was vortexed and degassed by centrifugation.
Peptide mapping: Tras and Tras-MMAE were enzymatically digested using the Trypsin/Lys-C protease (Promega).
Data acquisition:
icIEF-UV/MS: During icIEF-UV/MS analysis, the mAb and ADC samples were separated with an Intabio cartridge (SCIEX) installed on the Intabio ZT system (SCIEX). UV absorbances were measured at 1 Hz during the focusing and mobilization steps. The samples were introduced into the ZenoTOF 7600 system by a metered 3 µL/min flow of chemical mobilizer, followed by MS data acquisition.
Peptide mapping: Tryptic peptides were separated using a Kinetex 2.6 µm XB-C18 100 Å 150 x 0.3 mm LC column (Phenomenex) installed on the M5 MicroLC system (SCIEX). A flow rate of 5 µL/min was used for peptide separation. The peptide mapping data was acquired using an EAD DDA method. Key EAD DDA parameters are shown in Table 1.

Data analysis:
icIEF-UV/MS: UV traces and mass spectra from icIEF-UV/MS analysis were interpreted using Biologics Explorer software (SCIEX). Intact masses of the main peak and charge variants were determined from the deconvolution of the corresponding mass spectra.
Peptide mapping: EAD DDA data were interpreted using the peptide mapping workflow template within Biologics Explorer software. A custom modification of MMAE was created for payload localization.
ADC conjugation with GlyCLICK technology
GlyCLICK is a three-step, site-specific conjugation technology for IgG using Fc glycan remodeling and click-chemistry. The technology generates stable and homogeneous antibody conjugates for IgGs from several species and subclasses with preserved immunoreactivity. The GlyCLICK technology was utilized to generate the Tras-MMAE ADC for icIEF-UV/MS and peptide mapping analyses in this work.
High-resolution separation of charge variants
The advantages of the icIEF-UV/MS workflow for high-resolution separation, sensitive detection and confident identification of biotherapeutic charge variants in a single assay have been described in the previous technical notes.5-8 This powerful workflow can be employed for rapid assessment of charge heterogeneity profiles or in-depth characterization of unexpected charge variants. It was also demonstrated that the icIEF-UV/MS workflow is highly reproducible for separating and detecting intact biotherapeutics and their charge variants.5-7
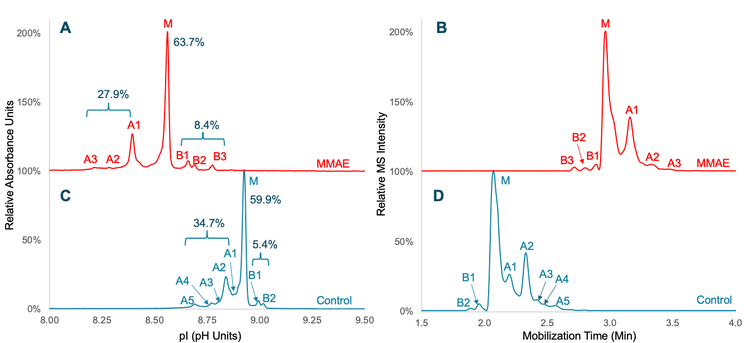
Figure 2 shows the icIEF-UV profiles and MS base peak electropherograms (BPEs) of Tras and Tras-MMAE obtained using the Intabio ZT system. The icIEF-UV profiles (Figure 2A and 2C) reveal a high-resolution separation of the main species (M) from the acidic and basic variants (A1-A5 and B1-B3). MMAE conjugation of Tras led to a significant shift of the icIEF-UV profile to a lower pI (more acidic) region (Figure 2A). All the variants detected in the icIEF-UV profiles (Figure 2A and 2C) were observed in the corresponding BPEs (Figure 2B and 2D), demonstrating that high-resolution separation is maintained after chemical mobilization. High-resolution icIEF separation of charge variants enables accurate peak integration and relative quantitation of these species for rapid charge heterogeneity assessment. For unconjugated Tras, the percent compositions of the main, acidic and basic species were calculated to be 59.9%, 34.7% and 5.4%, respectively (Figure 2C). A slightly lower percent composition of acidic species (27.9%) and higher level of basic variants (8.4%) were measured for Tras-MMAE (Figure 2A).
Accurate DAR determination
The icIEF-UV/MS workflow enables confident peak assignment and DAR determination for ADCs due to its ability to perform accurate mass measurement using the ZenoTOF 7600 system and automated data analysis with Biologics Explorer software.7
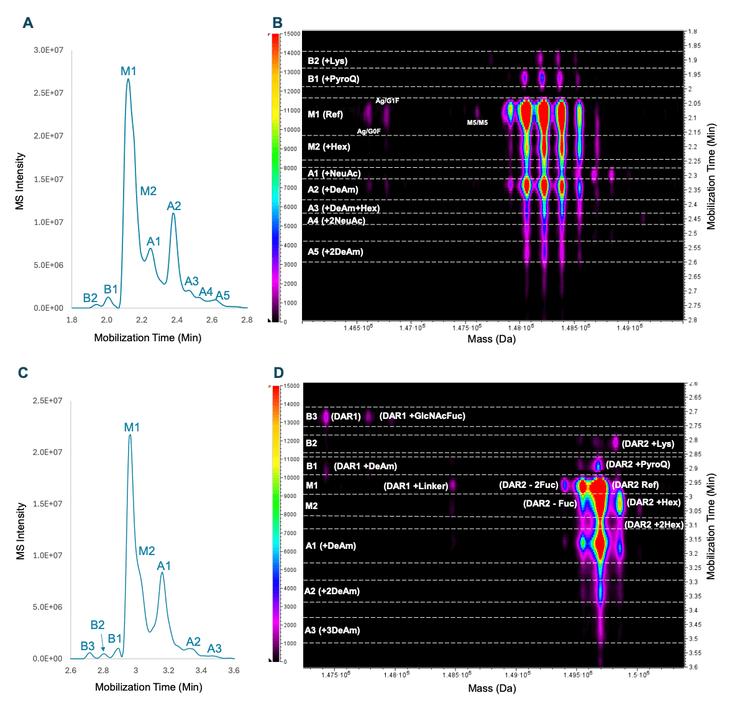
Figure 3 shows the BPEs and ion maps of Tras and Tras-MMAE. The species detected in BPEs (Figures 3A and 3C) were annotated in the ion maps from Biologics Explorer software (Figures 3B and 3D). The ion map provides an excellent visualization of the variant species detected at different deconvoluted masses (x-axis) and mobilization times (right y-axis) with the color scheme (left y-axis) indicating peak abundance. Intact mass measurement revealed that the main peak of Tras consists of 3 major glycoforms, including G0F/G0F, G0F/G1F and G1F/G1F, without the C-terminal Lys (Figure 3B).
Sensitive detection and confident identification of charge variants
The icIEF-UV/MS workflow provides sensitive detection and identification of acidic and basic species of Tras and Tras-MMAE. A detailed description of these charge variants will be published elsewhere. Selected charge variants will be highlighted in the following sections.
The major basic peaks identified for Tras and Tras-MMAE are the C-terminal Lys and N-terminal pyro-Q species (Figures 3B and 3D). Low-abundant DAR1 and DAR1+GlcNAcFuc species were also identified among the basic variants for Tras-MMAE (peak B3 in Figures 3C and 3D). The DAR1 species are formed from the native aglycosylated species (Ag/G0F and Ag/G1F) in Tras (Figure 3B). DAR1+GlcNAcFuc is a side product of payload conjugation. The percent composition of this species was measured to be ~0.5% in Tras-MMAE, demonstrating both the sensitive detection of low-abundant charge variants with the icIEF-UV/MS workflow and the high efficiency of payload conjugation using GlyCLICK.
The deamidated species are the dominant acidic variants detected in Tras and Tras-MMAE (Figures 3B and 3D). For Tras, the acidic variants containing sialic acids (NeuAc) were also observed (Figure 3B). By comparison, this species was absent in Tras-MMAE (Figure 3D), showing again the efficient removal of glycosylation when using GlyCLICK.
The icIEF-UV/MS workflow enables the detection and identification of singly and doubly glycated (Hex) species in the main and acidic regions of Tras and Tras-MMAE (Figure 3B and 3D).
The results described above demonstrate the powerful capabilities of icIEF-UV/MS for high-resolution separation, sensitive detection and confident peak assignment of charge variants. These capabilities can be leveraged for rapid charge heterogeneity analysis and product quality assessment. In the scenarios where detailed characterization of charge variants is required to verify unexpected species identified by icIEF-UV/MS, analyze labile PTMs and/or localize conjugation sites, orthogonal peptide mapping workflows can be deployed using the same MS instrument (ZenoTOF 7600 system).
Peptide mapping for sequence confirmation, PTM analysis and payload localization
Previous studies have demonstrated the capability, versatility and flexibility of the ZenoTOF 7600 system equipped with the Zeno trap and EAD cell to achieve unparalleled peptide mapping results for comprehensive biotherapeutic characterization.9-14 A 5- to 10-fold sensitivity increase in the detection of MS/MS fragments offered by the Zeno trap leads to high sequence coverage of biotherapeutics. The ability of EAD to preserve labile PTMs and differentiate amino acid isomers greatly enhances the capability of peptide mapping for biotherapeutic characterization. In addition, the flexibility to create DDA or MRMHR methods using CID, EAD or the combination of 2 fragmentation techniques in SCIEX OS software ensures that different needs for biotherapeutic development can be met. In this work, the EAD-based peptide mapping workflow was employed to further characterize the Tras-MMAE ADC. EAD data from selected peptides were highlighted to demonstrate the strengths of this workflow for the comprehensive characterization of biotherapeutic charge variants.
Figure 4 shows sequence coverage of light and heavy chains (LC and HC) from EAD DDA analysis of the tryptic digest of TrasMMAE in a single injection. >95% sequence coverage was obtained for both LC and HC, demonstrating the capability of EAD DDA as a single-injection platform method for routine peptide mapping analysis.
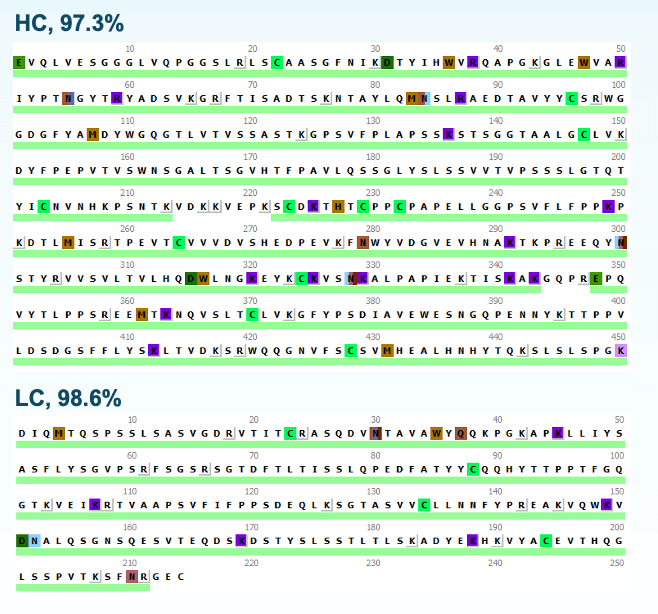
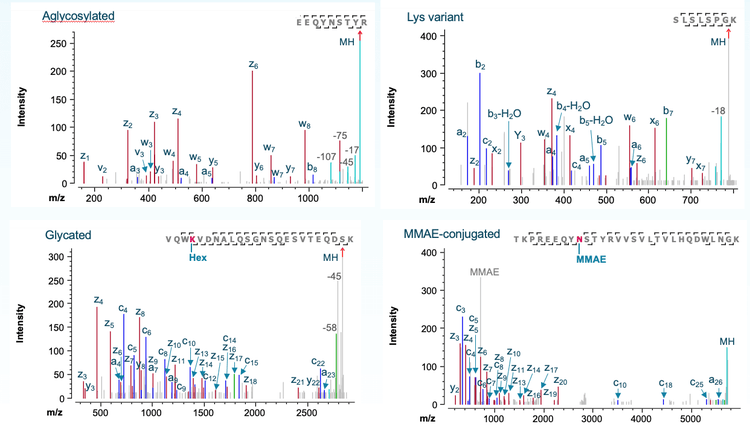
Figure 5 shows EAD spectra of selected Tras-MMAE peptides representing the aglycosylated, C-terminal Lys, glycated and MMAE-conjugated variants detected by icIEF-UV/MS (Figure 3D). EAD led to extensive fragmentation of these peptides, allowing for their confident identification (Figure 5). The identification of an aglycosylated peptide by the EAD-based peptide mapping workflow (Figure 5A) confirms the peak assignment for a DAR1 species detected in the icIEF-UV/MS experiment (Figure 3D). Additionally, EAD DDA confidently identified a GlcNAcFuc-linked peptide without the MMAE payload (data not shown), further confirming the assignment of the low-abundant DAR1+GlcNAcFuc peak by icIEF-UV/MS (Figure 3D). The ability of EAD to preserve labile PTMs enables accurate localization of glycation (Figure 5C) and MMAE conjugation (Figure 5D). For the MMAE-linked peptide, EAD produced a payload-specific fragment for the payload confirmation (Figure 5D). The advantages of EAD vs. CID for comprehensive ADC characterization were described in the previous technical note.14
The EAD-based peptide mapping workflow did not identify any glycosylated peptides (e.g. G0F and G1F), further demonstrating the highly efficient deglycosylation step of the GlyCLICK technology
Conclusion
- SCIEX offers a complete analytical solution for comprehensive characterization of biotherapeutics and their charge variants using a single MS platform.
- Orthogonal, streamlined icIEF-UV/MS and EAD-based peptide mapping workflows provide an in-depth charge heterogeneity analysis of ADCs, allowing confidence in assignments beyond traditional workflows such as fraction collection and CID-based peptide mapping.
- The icIEF-UV/MS workflow provides high-resolution separation, sensitive detection and confident identification of biotherapeutic charge variants.
- A 30-min sample analysis time offered by the icIEF-UV/MS workflow is faster than conventional cIEF and IEX workflows requiring fractionation for the subsequent identification.
- The EAD-based peptide mapping workflow leads to excellent peptide fragmentation, high sequence coverage and accurate PTM or payload localization in a single injection. By comparison, traditional CID MS/MS does not work effectively for labile PTMs, large peptides and amino acid isomers.
- Streamlined icIEF-UV/MS and EAD-based peptide mapping workflows can be easily adopted for routine biotherapeutic characterization throughout the development pipeline.
References
- Anna Robotham and John Kelly. (2020) LC-MS characterization of antibody-based therapeutics: recent highlights and future prospects. Approaches to the Purification, Analysis and Characterization of Antibody-Based Therapeutics. Chapter 1: 1-33.
- Yi Du et al. (2012) Chromatographic analysis of the acidic and basic species of recombinant monoclonal antibodies. MABS. 4(5):578- 585.
- Joshua Hurwitz et al. (2023) Antibody–drug conjugates: ushering in a new era of cancer therapy. Pharmaceutics. 15: 2017.
- Ostrowski M. Rapid multi-attribute characterization of intact bispecific antibodies by a microfluidic chip-based integrated icIEFMS technology. Electrophoresis. 2022 Oct;1-9.
- Direct and rapid multi-attribute monitoring of multiple intact monoclonal antibodies with a wide isoelectric-point range of 7.3 to 9.1. SCIEX technical note, MKT-26996-A.
- A comprehensive workflow to characterize deglycosylated NISTmAb using imaged capillary isoelectric focusing (icIEF)-UV/MS. SCIEX technical note, MKT-27945-A.
- Charge variant analysis of antibody-drug conjugates using an icIEFUV/MS workflow. SCIEX technical note, MKT-29837-A.
- Leverage orthogonal technologies: cIEF, icIEF-UV/MS and LC-MS to facilitate biotherapeutics development. SCIEX technical note, MKT31116-A.
- A single-injection workflow for enhanced peptide mapping using collision-induced dissociation (CID) and electron-activated dissociation (EAD). SCIEX technical note, MKT-28039-A.
- Comprehensive characterization of O-linked glycosylation in etanercept by electron activated dissociation (EAD). SCIEX technical note, RUO-MKT-02-14921-A.
- Monitoring and determining the cause of antibody discoloration using capillary isoelectric focusing (cIEF) and electron activated dissociation (EAD). SCIEX technical note, MKT-26819-A.
- Differentiation of leucine and isoleucine for enhanced sequence variant analysis using electron activated dissociation. SCIEX technical note, MKT-30799-A.
- Comprehensive mapping of disulfide linkages in etanercept using an electron activated dissociation (EAD) based LCMS/MS methodology. SCIEX technical note, RUO-MKT-02-15195-A.
- Comprehensive characterization of an antibody-drug conjugate (ADC) using electron activated dissociation (EAD). SCIEX technical note, MKT-28847-A