Abstract
This technical note highlights a streamlined solution that combines the power of cIEF to monitor antibody discoloration and an EAD-based MAM workflow to determine the cause of color change. The cIEF profiles of the time-course forced glycation samples of NISTmAb revealed a significant increase in acidic variants in the discolored samples. EAD-based MAM was employed to identify and quantify the acidic species to assess their role in the discoloration of protein therapeutics.
Introduction
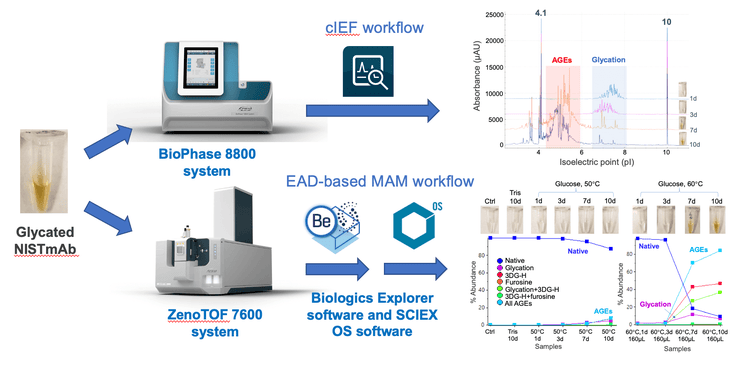
Color is a potential critical quality attribute of protein therapeutics.1 Undesirable color changes can lead to increased product heterogeneity and concerns about the safety and efficacy of a drug. Hence, the cause of color change in biotherapeutics must be fully understood and reported to regulatory agencies. Previous studies showed that advanced glycation end products (AGEs) are partially responsible for the discoloration of recombinant antibodies. 2,3 AGEs are often challenging to characterize using collision-based MS/MS approaches because they are ineffective for fragmenting these species. 3-5 In contrast, EAD-based MAM enabled confident identification and relative quantification of the glycated species and AGEs, providing molecular insights into the role of AGEs in the discoloration of protein therapeutics. 3-6 Here, the cIEF and EAD-based MAM workflows were leveraged together (Figure 1) to provide a streamlined solution from product quality tracking to cause investigation.
Key features of cIEF and EAD-based MAM workflows for product quality assessment
- Streamlined method: cIEF and EAD-based MAM workflows offer an integrated solution to monitor and provide molecular insights into product changes such as discoloration
- Comprehensive characterization: EAD provides excellent fragmentation of the peptide backbone and accurate localization of labile modifications
- Quantitatively reproducible: EAD-based MAM offers reproducible quantification results for product quality attributes
Methods
Sample preparation: A working standard solution was prepared by adding insulin degludec standard into 100 μL of rat plasma. Concentrated standard solution was further diluted to create an 8-point standard curve ranging between 25 and 50000 pg/mL. Insulin degludec was extracted from rat plasma using protein precipitation. A 600 μL aliquot of pre-chilled methanol/acetonitrile (1:1) was added to the samples and vortexed for 1 minute. Samples were incubated for 10 minutes at 4°C to induce protein precipitation. At the end of the incubation period, samples were centrifuged at 13,000 rpm for 10 mins at 4°C. A 650 μL aliquot of supernatant was transferred to a new tube and dried under nitrogen flow. Dried samples were reconstituted in 100 μL 10:2:88 (v/v/v) methanol/acetic acid/water and transferred to vials for analysis.
Chromatography: Chromatography was carried out on an Exion LC system using a Phenomenex Kinetex XB-C18 (2.1 × 100 mm, 2.6 µm) column. Mobile phase A was 0.1% formic acid in water and mobile phase B was 0.1% formic acid. The operating flow rate was 0.5 mL/min. Gradient conditions are summarized in Table 1. Column temperature was set at 40ºC. A 5 µL sample was injected for analysis. A 1:1:1:1 (v/v/v/v) methanol: acetonitrile: water: isopropanol mixture was used for needle wash.

Mass spectrometry: EAD data-dependent acquisition (DDA) experiments were performed using the ZenoTOF 7600 system and SCIEX OS software. The key TOF MS and MS/MS settings used are listed in Tables 2 and 3, respectively.
Data processing: EAD data were analyzed using the peptide mapping workflow templates in the Biologics Explorer software, as described in previous technical notes.4-6


Discoloration of protein therapeutics
Previous studies have shown that recombinant antibodies produced from Chinese hamster ovary cells can show visible yellow or brown color. 1-3 The discoloration of antibody-based therapeutics indicates the presence of fluorescent impurities, which can affect the safety and efficacy of a drug product.1-3 Therefore, it is critical to understand the cause of discoloration on the molecular level to fully assess the effect of color change on product quality.
It was demonstrated previously that the degree of AGE modification is a better indicator of color change than oxidation and glycation. 2 This notion was supported by a correlation between the discoloration and the relative level of AGEs measured using the EAD-based workflow. 6 In this work, the factors that affect the discoloration of NISTmAb were further investigated. The powerful capabilities of cIEF and EAD-based MAM workflows were leveraged to monitor the charge profile of NISTmAb and determine the cause of discoloration at the molecular level.
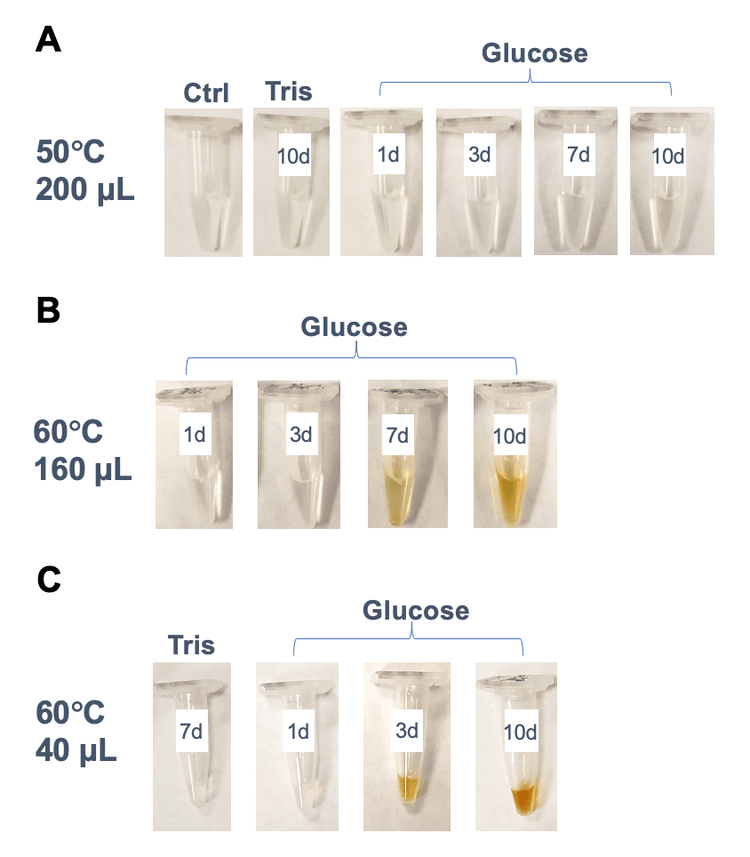
Figure 2 shows the color of different volumes (40 µL, 160 µL or 200 µL) of 5 µg/µL NISTmAb solutions incubated at different temperatures (50°C or 60°C). The 200 µL samples stressed at 50°C with or without glucose did not undergo visible color change during the 10 days of incubation (Figure 1A). In contrast, the discoloration became visible in the 160 µL samples incubated at 60°C by day 7 (Figure 1B), indicating that the color change was accelerated at higher temperatures. The onset of the color change was expedited when NISTmAb was incubated with glucose in a smaller volume of 40 µL. As displayed in Figure 1C, the yellow or brown color was visible in the 40 µL sample incubated at 60°C by day 3 and the color grew darker by day 6. These results indicate that the discoloration of protein therapeutics can be affected by factors including the presence of glucose, temperature, duration of incubation and sample volume.
Monitoring charge profiles of glycated NISTmAb by cIEF
It was demonstrated previously that the BioPhase 8800 system enabled the reproducible separation of protein therapeutics in either the non-reduced or reduced form.9 The cIEF technology employed by the BioPhase 8800 system enables rapid assessment and monitoring in stability or forced degradation studies of protein therapeutics. In this work, the BioPhase 8800 system was used to track the charge profiles of NISTmAb in the time-course forced glycation samples, including those displaying color change. The changes detected by cIEF were further elucidated using an EAD-based MAM workflow.
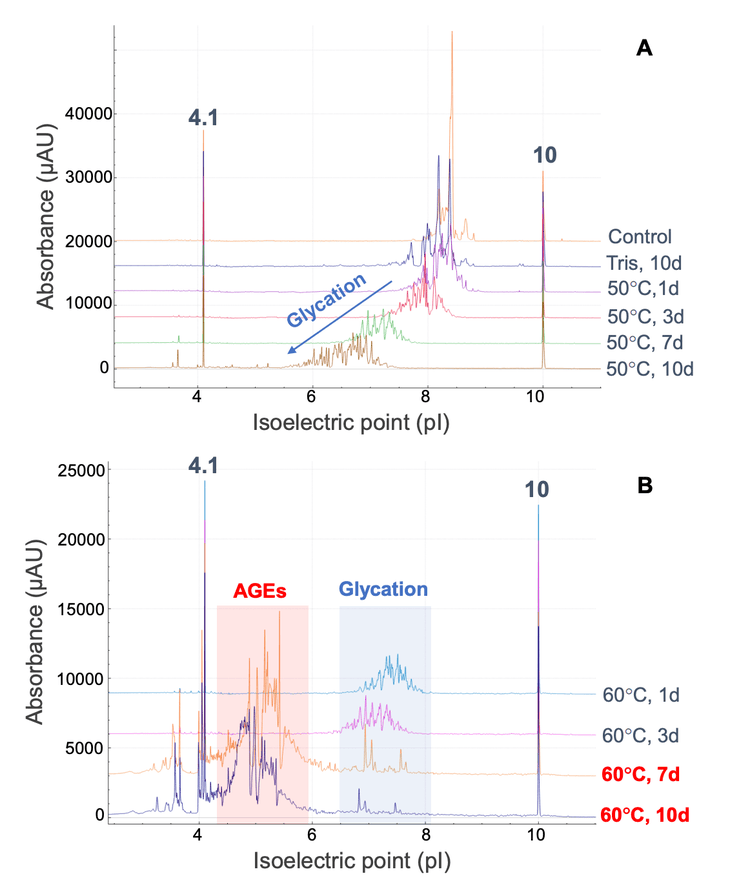
The aligned cIEF electropherograms of the control and stressed samples of NISTmAb are shown in Figure 3. Compared to the control sample, a significant increase in the number of acidic variants was detected in the NISTmAb solutions incubated at 50°C in the presence of glucose (Figure 3A). The charge profiles shifted gradually to lower pI regions while the profile distribution became broader with the increasing incubation duration. For instance, the charge profile of NISTmAb was centered at pI 8.0- 8.5 when incubated at 50°C for 1 day. When the sample was incubated at 50°C for 10 days, however, a broader distribution of peaks was detected in the pI range of 6-7 (Figure 3A). This pI shift was also observed between the samples incubated at different temperatures. A pI range of 8.0-8.5 was observed when the sample was incubated at 50°C for 1 day (Figure 3A), whereas a pI range of 7-8 was observed when the sample was incubated at 60°C for 1 day (Figure 3B). A drastic change in the charge profile was observed in the 2 samples incubated at 60°C that underwent color change at day 7 and day 10 (Figure 3B). In these samples, the acidic species were mostly detected in the pI range of 4-6, whereas these species were observed at pI 6-9 in the samples without discoloration.
EAD-based MAM for identification and quantification of glycation and AGEs
The EAD-based MAM workflow provides a streamlined approach for the identification and relative quantification of product quality attributes (PQAs), including challenging modifications such as glycation and AGEs.6 This workflow encompasses the impactful capabilities of EAD technology for the comprehensive characterization of protein therapeutics, the easy-to-use Biologics Explorer software for PQA identification and the industry-leading algorithms of SCIEX OS software for PQA quantification.
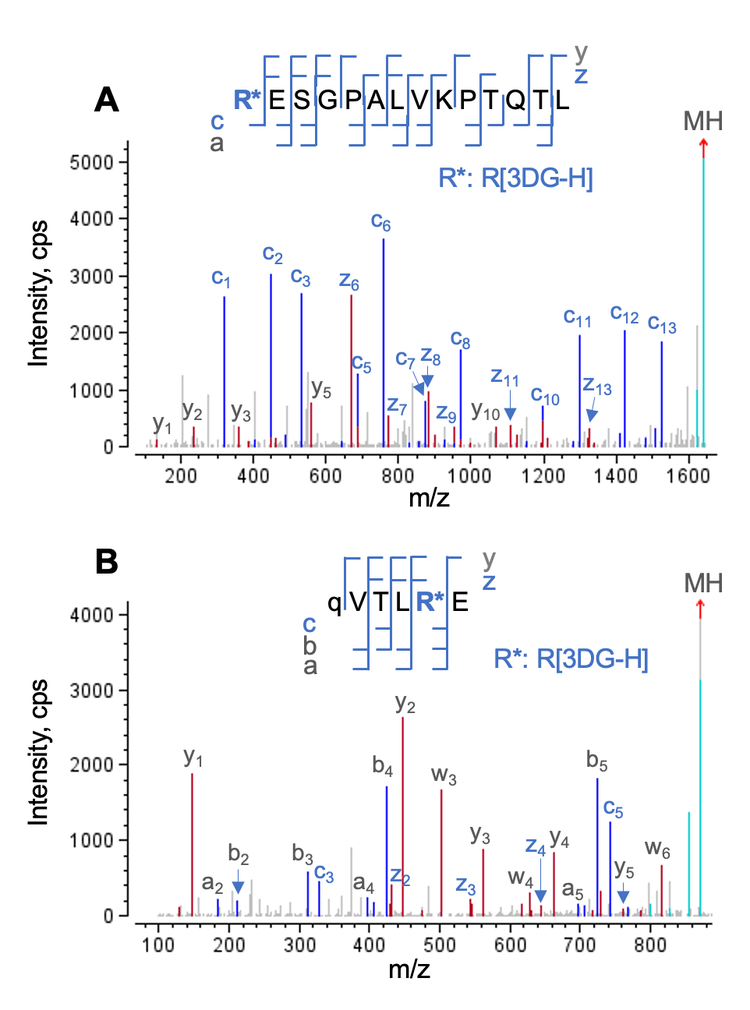
The characterization capabilities of EAD for the glycated and AGE species have been showcased in previous technical notes.4-6 The deisotoped EAD MS/MS spectra of 2 selected AGEs from Biologics Explorer software are displayed in Figure 4. These 2 AGEs identified from the trypsin/Lys-C and Glu-C digests contained a 3-deoxyglucosone hydroimidazolone (3DGH) modification on the same arginine (Arg) residue near the Nterminus of the heavy chain. EAD led to a complete fragmentation of these 2 AGEs, enabling confident identification and localization of the AGE moiety.
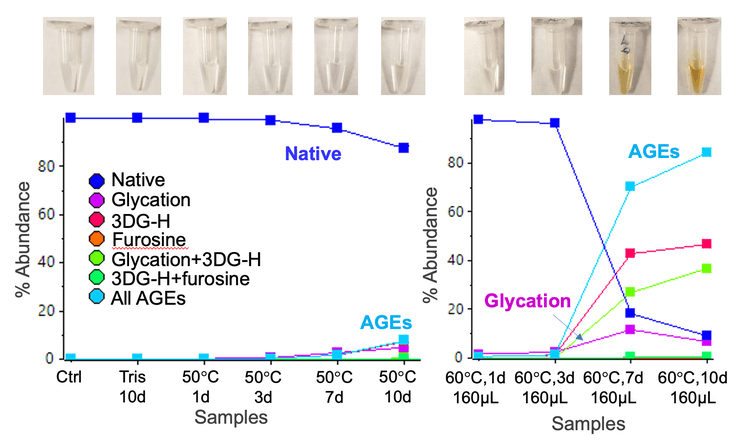
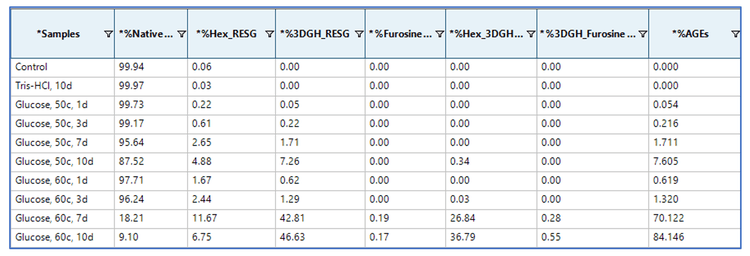
Relative quantification of glycated and AGE species in the tryptic peptide RESGPALVKPTQTL was performed using the Analytics module within SCIEX OS software. The quantification results were visualized using a metric plot (Figure 5) and a results table (Figure 6). The results showed that the relative abundances of the AGE modifications were significantly increased in the 2 discolored samples compared to the samples that did not undergo color change. For example, the percent abundance of all AGEs for the peptide RESGPALVKPTQTL was ~1.3% in the 160 µL sample that was incubated at 60°C for 3 days, whereas the abundance of AGEs was ~70.1% in the sample that was incubated at 60°C for 7 days (Figures 5 and 6). The LC-MS results indicated that AGEs were the main species observed at pI<6 in the cIEF data of the 2 discolored samples (Figure 3), while glycated species contribute more to peaks at pI 6-8. Together, the LC-MS and cIEF data indicated that the AGEs are partially responsible for the discoloration of antibody-based therapeutics.2
In summary, the data described in this technical note provide additional insight into the factors that govern the discoloration of protein therapeutics and the role of AGEs in color change. Additional studies will be necessary to determine the specific AGEs that might produce the characteristic yellow or brown color observed.
Conclusion
- The streamlined cIEF and EAD-based MAM workflows offer a useful solution to monitor the changes in charge profile associated with antibody discoloration and determine the cause of color change
- The color change of NISTmAb was affected by factors including the absence or presence of glucose, temperature, duration of incubation and sample volume
- The cIEF data revealed a shift of the charge profile to pI<6 in the samples that displayed the distinct yellow or brown color
- EAD-based MAM identified AGEs as the species that is likely responsible for the discoloration of antibody-based therapeutics
References
- Alexandre Ambrogelly. (2021) The different colors of mAbs in solution solution. Antibodies. 10(2): 21.
- Margaret Butko et al. (2014) Recombinant antibody color resulting from advanced glycation end product modifications. Anal. Chem. 86(19): 9816-9823.
- Anna Robotham and John Kelly. (2020) LC-MS characterization of antibody-based therapeutics: recent highlights and future prospects. Approaches to the Purification, Analysis and Characterization of AntibodyBased Therapeutics. Chapter 1: 1-33.
- Comprehensive characterization of glycation in protein therapeutics using electron activated dissociation (EAD). SCIEX technical note, RUO-MKT-02-15020-A.
- Comprehensive characterization of advanced glycation end products (AGEs) in protein therapeutics using electron activated dissociation (EAD). SCIEX technical note, RUOMKT-02-15088-A.
- Time-course study of glycation and advanced glycation end products (AGEs) in protein therapeutics using electron activated dissociation (EAD). SCIEX technical note, RUOMKT-02-15266-A.
- Capillary isoelectric focusing (cIEF) kit for BioPhase 8800 system application guide. RUO-IDV-05-8651-A.
- Abigail Turner and John Schiel. (2018) Qualification of NISTmAb charge heterogeneity control assays. Anal. Bioanal. Chem. 410(8): 2079-2093.
- CE-SDS analysis of etanercept using the BioPhase 8800 system. SCIEX technical note, RUO-MKT-02-14116-A.