Abstract
This technical note describes improvements in the identification and quantitation of proteins and peptides with high throughput liquid chromatography-mass spectrometry (LC-MS) analyses when using ZT Scan data-independent acquisition (DIA) on the ZenoTOF 7600+ system. ZT Scan DIA enhances proteomics performance compared to traditional discrete-window DIA methods such as Zeno SWATH DIA, particularly as sample loading and complexity increase. Using ZT Scan DIA, up to 70% gains were achieved in the identification and quantitation of proteins and precursors in highly complex lysate digest samples.
Key features of high throughput proteomics with ZT Scan DIA on the ZenoTOF 7600+ system
- Go deeper: Identify and quantify up to 70% more proteins and peptide precursors with ZT Scan DIA
- Go faster: The benefits of ZT Scan DIA increase as sample throughput increases, allowing confident detections and quantitation at throughputs as high as 500 SPD
- Get specific: Performance gains with fast LC gradients using ZT Scan DIA increase as sample loading and complexity increase due to the added specificity of the scanning quadrupole dimension
Introduction
DIA has become the cornerstone of MS-based proteomics analysis, enabling the identification and quantification of large numbers of proteins and peptides to enhance the understanding of the complex biological mechanisms of various diseases. A critical aspect of disease research is analyzing large sample cohorts to increase the statistical significance of observed trends and paint a broader picture of the disease mechanisms involved. As such, the ability to analyze large numbers of samples faster, with easy-to-implement methods and improved data quality, is of great value to researchers. The power of Zeno SWATH DIA for fast, high-quality quantitative proteomics has been repeatedly demonstrated1-3. ZT Scan is presented as the next step in the evolution of DIA4. Using a scanning quadrupole coupled to fast, sensitive, time-of-flight (TOF) analysis improves specificity over existing discrete-window DIA methods for accurately and precisely identifying and quantifying analytes across a given mass range.
This technical note highlights the benefits of ZT Scan DIA for identifying and quantitating proteins and peptides using high throughput LC-MS regimes. Using pre-defined methods requiring minimal optimization and parameter setup, performance improvements over Zeno SWATH DIA methods increase as sampling throughput increases and for samples of higher complexity and loadings. These results indicate that ZT Scan DIA is an ideal method for the high throughput analysis of high-complexity samples, ideally suited for large cohort biomarker research.
Methods
Sample preparation: Human K562 and yeast protein tryptic digest standards were purchased from Promega. Drosophila melanogaster protein lysate was purchased from enLysate. Human HEK 293, mouse 3T3, and Chinese hamster ovary (CHO) protein lysates were purchased from Innovative Research. Drosophila, HEK 293, mouse, and CHO protein lysates were digested with trypsin and purified using S-Traps (Protifi) according to the manufacturer’s instructions. Drosophila, HEK 293, yeast, mouse, and CHO digests were combined at equivalent nanogram amounts to create the lysate digest mixture. K562 and the lysate mixture were reconstituted to the indicated concentrations in a buffer containing 5% acetonitrile and 0.1% formic acid in water Human K562 and yeast protein tryptic digest standards were purchased from Promega. Drosophila melanogaster protein lysate was purchased from enLysate. Human HEK 293, mouse 3T3, and Chinese hamster ovary (CHO) protein lysates were purchased from Innovative Research. Drosophila, HEK 293, mouse, and CHO protein lysates were digested with trypsin and purified using S-Traps (Protifi) according to the manufacturer’s instructions. Drosophila, HEK 293, yeast, mouse, and CHO digests were combined at equivalent nanogram amounts to create the lysate digest mixture. K562 and the lysate mixture were reconstituted to the indicated concentrations in a buffer containing 5% acetonitrile and 0.1% formic acid in water.
Chromatography: High throughput microflow LC separations were performed using either the Waters M-Class UPLC system (in direct-inject LC mode) or the Evosep One system. Mobile phases consisted of 0.1% formic acid in water (A) and 0.1% formic acid in acetonitrile (B). Chromatographic separations with the Waters M-Class system were done with a Phenomenex XB-C1 analytical column (15 cm x 300 µm, 2.6 µm particle size), at a flow rate of µL/min. Throughput methods of 200, 160, 130, and 100 SPD were used, with respective 1-min, 3-min, 5- min, or 10-min active gradients (see Table 1). For chromatographic separations using the Evosep One system, throughput methods of 200, 300, and 500 SPD were used with the EV1107 analytical column (4 cm x 150 µm, 1.9 µm particle size) as previously described2.
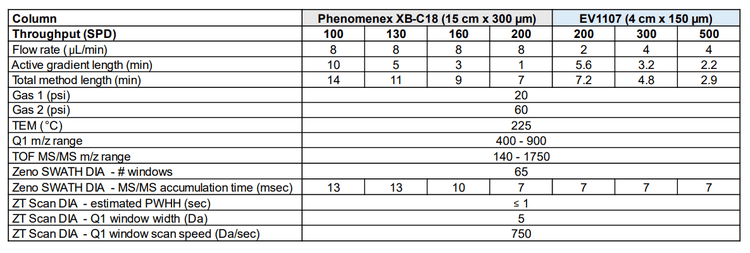
Mass spectrometry: Data-independent acquisition experiments were performed on a ZenoTOF 7600+ system using the OptiFlow Turbo V ion source with the microflow probe (1-10 µL/min electrode). Zeno SWATH DIA experiments used 65 variable-width windows spanning the TOF MS mass range 400-900 Da, MS/MS mass range 140- 1750 Da, and Zeno trap pulsing turned on. ZT Scan DIA experiments used an estimated peak width at half-height (PWHH) setting of ≤ 1 sec. Additional information about source parameters and MS/MS accumulation times for the various experiments are described in Table 1. All data was acquired in triplicate for all conditions.
Data processing: All data was processed using DIA-NN software version 1.8.15 . Human K562 data was processed against a spectral library previously described6. Data acquired on the lysate mixture was processed using a combined predicted spectral library comprising Homo sapiens, Saccharomyces cerevisiae, Mus musculus, Cricetulus griseus, and Drosophila melanogaster protein FASTA sequences downloaded from www.uniprot.org. Default DIA-NN software search settings were used with the following changes: Precursor m/z range was adjusted to 400-900, Fragment m/z range was adjusted to 140-1750, Mass accuracy was set to 20 ppm, MS1 accuracy set to 0 ppm, Scan window was set to 6, and MBR was checked. The --scanning-swath command option was used for ZT Scan DIA data processing. Searches were done individually, processing only triplicate data files from the same loading/gradient/method.
Unlock the power of ZT Scan DIA with easy-to-setup methods
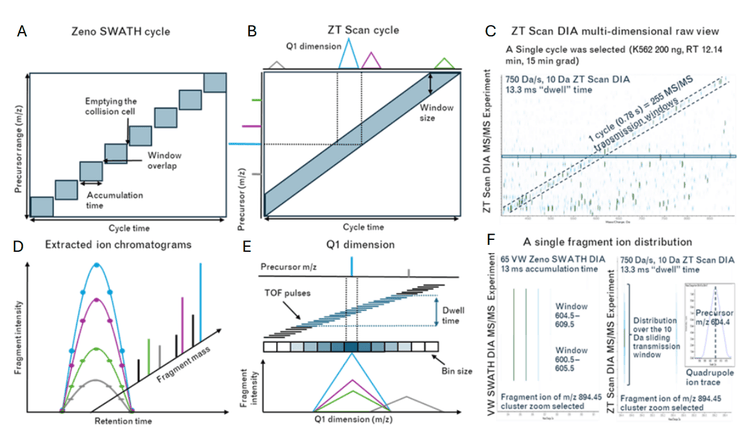
Traditional DIA techniques such as Zeno SWATH DIA divide the precursor mass range into discrete windows, with either fixed or variable widths across the Q1 range. Ideally, DIA window widths are kept as narrow as possible to maximize MS/MS selectivity, which necessitates using more DIA windows spanning the Q1 range. However, with DIA methods having many windows, maintaining a reasonable overall cycle time (based on LC peak width) requires sacrificing MS/MS scan times per window, potentially impacting overall data quality. Conversely, ZT Scan DIA utilizes a sliding quadrupole precursor isolation window scanning across the Q1 range (Figure 2). As precursor ions fall in and out of the sliding isolation window, they are fragmented in Q2, followed by Zeno trap pulsing into the TOF analyzer. MS/MS spectra are collected from TOF pulses and are binned according to the precursor m/z from the Q1 dimension. Fragment ions can be mapped to their precursor ion based on the correlation of the fragment ions' appearance and disappearance to the precursor ion's appearance and disappearance in the Q1 isolation window.

Benefits of ZT Scan DIA with analysis of up to 200 SPD using the Waters M-Class LC system and Phenomenex XB-C18 column (15 cm x 300 µm)
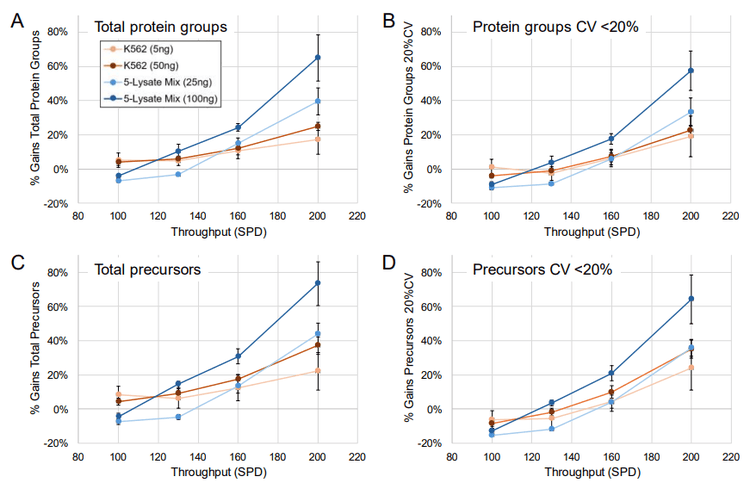
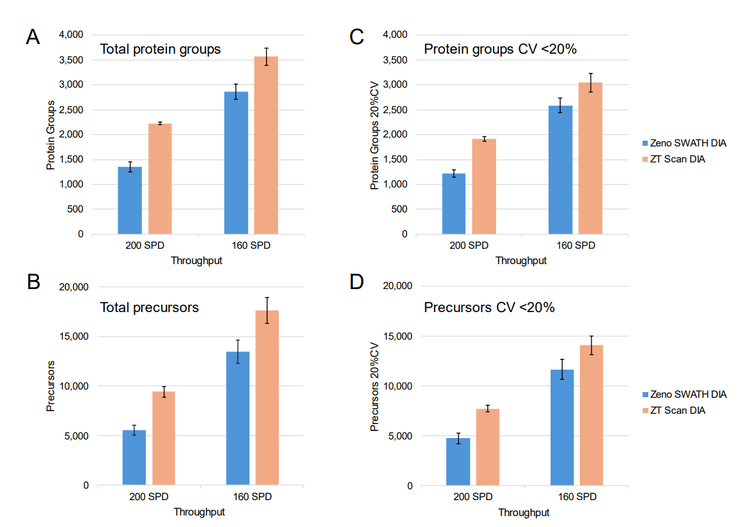
Active gradients of 1 minute (7-min total run time), 3 minutes (9-min total run time), 5 minutes (11-min total run time), and 10 minutes (14-min total run time) were used, equating to throughputs of 200, 160, 130 and 100 SPD, respectively. Two different sets of samples were analyzed, one consisting of commercial human K562 digest (5 ng and 50 ng on-column loadings), the other being a mixture of HEK 293, mouse, CHO, yeast, and Drosophila protein digests combined at equivalent nanogram amounts (oncolumn loadings of either 25 ng or 100 ng total protein digest). Samples were analyzed using ZT Scan DIA (PWHH ≤ 1 sec) or a 65 variable-window Zeno SWATH DIA method, with triplicate runs for all conditions. Comparisons were made between the ZT Scan DIA and Zeno SWATH DIA methods in terms of the resulting numbers of total protein group and precursor identifications, along with the numbers of protein groups and precursors identified with a coefficient of variation (CV) <20% representing the numbers of quantifiable protein groups and precursors. Figure 1 summarizes the gains in both total protein groups and protein groups with CV <20% using ZT Scan DIA for the different samples and on-column loadings tested at throughputs from 100 to 200 SPD. The figure shows that the gains improved as throughput increased, reaching 70% for 200 SPD. This was observed for both the identified and quantified protein groups, and this trend was also evident for the identified and quantified precursors. It was also observed that the gains increased as the sample complexity and loading increased, with the most significant improvements seen for the 100 ng loading of lysate mix, followed by 25 ng lysate mix, 50 ng K562, and 5 ng K562, respectively. This demonstrates that ZT Scan DIA is particularly effective for high-complexity analyte mixtures, especially when the chromatographic space is condensed with shorter gradients. Presumably, this is due to the higher degree of specificity afforded by ZT Scan DIA, in that fragment ions can be effectively mapped to their corresponding precursor ions across the Q1 dimension of the sliding isolation window. The corresponding numbers of protein groups and precursors (total number identified, along with the numbers identified with CV <20%) for the 100 ng lysate mixture at the 160 and 200 SPD throughput levels are shown in Figure 4. Although the absolute number of identifications was higher when using slower throughput LC methods, the highest proportion of gains were observed at 200 SPD, where ZT Scan DIA identified 2224 total protein groups (1919 with CV <20%) and 9 15 total precursors (7737 with CV <20%).
Benefits of ZT Scan DIA with analyses up to 500 SPD using the Evosep One system
The same set of samples was analyzed using the Evosep One system, which enables faster LC separations of up to 500 SPD, albeit using the shorter 4 cm x 150 µm EV1107 column (thereby limiting column capacity and chromatographic separation). Throughputs of 200, 300, and 500 SPD were tested with the same on-column loadings of K562 and lysate mixture described above, comparing ZT Scan DIA and the 65 variable-window Zeno SWATH DIA methods.
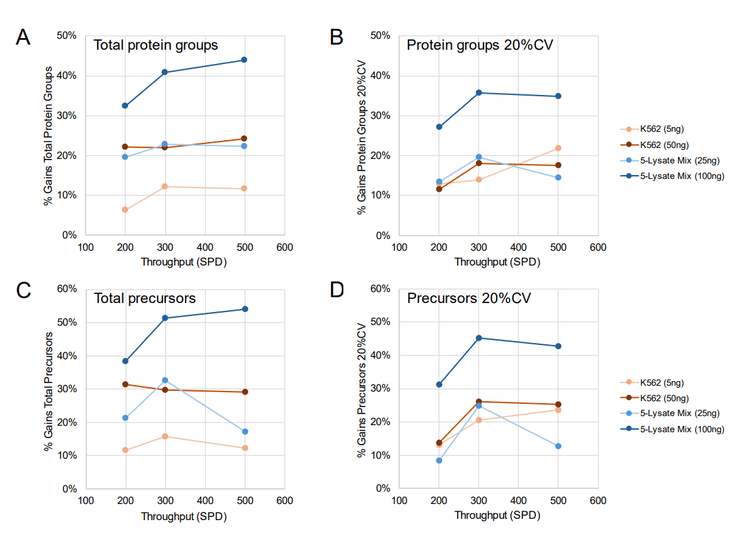
Figure 5 summarizes the gains achieved with ZT Scan DIA over Zeno SWATH DIA for these samples and throughput levels. As before, the gains for protein groups and precursors identified and quantified were most significant for the 100 ng loading of lysate mixture – up to 44% for identified protein groups, 35% for quantified protein groups, 54% for identified precursors, and 45% for quantifiable precursors.

Conclusion
- ZT Scan DIA improved the numbers of protein groups and precursors identified and quantified by up to 70% over Zeno SWATH DIA – these gains were highest as sample throughput increased
- The performance gains with ZT Scan DIA on the ZenoTOF 7600+ system also improved as sample complexity and on-column loading increased due to the added specificity of the Q1 dimension of ZT Scan DIA
- ZT Scan DIA methods are easy to set up, with minimal user optimization required, making the ZenoTOF 7600+ system ideally suited to the analysis of large sample cohort
References
- Quantifying 1000 protein groups per minute of microflow gradient using Zeno SWATH DIA on the ZenoTOF 7600 system. SCIEX technical note, RUO-MKT-02-15429-A.
- Flexibility, speed, and throughput for high proteome coverage using Zeno SWATH data-independent acquisition (DIA) coupled with the Evosep One system. SCIEX technical note, RUO-MKT-02-15461.
- Pushing the boundaries of sensitivity and depth-ofcoverage for nanoflow proteomics. SCIEX technical note, MKT-29730-A.
- Continuing the data independent acquisition (r)evolution: Introducing ZT Scan DIA for quantitative proteomics. SCIEX technical note, MKT-31731-A.
- Demichev V et al. (2019) DIA-NN: neural networks and interference correction enable deep proteome coverage in high throughput. Nature Methods, 17, 41-44.
- Large-scale protein identification using microflow chromatography on the ZenoTOF 7600 system. SCIEX technical note, RUO-MKT-02-14415-A.