Abstract
This technical note describes enhancements in protein sequence coverage and identification confidence using ZT Scan DIA on the ZenoTOF 7600+ system. The added selectivity of the scanning quadrupole dimension, coupled with high sensitivity MS/MS enabled by Zeno trap pulsing and fast acquisition rates of the time-of-flight mass analyzer, allow ZT Scan DIA to identify and quantify more peptides and proteins compared to conventional discrete-window DIA (Zeno SWATH DIA). Significant improvements in protein sequence coverage (as much as 7-fold) were observed, along with reduced false discovery rates for protein identification. These enhancements provide greater depth, confidence, and biological insight for proteomics research.
Key features of high-depth proteomics using ZT Scan DIA on the ZenoTOF 7600+ system
- Easy method setup: Minimal optimization is required for ZT Scan DIA setup, with pre-built methods designed for a range of desired chromatography regimes
- Increased coverage: Protein sequence coverage is improved by as much as 7-fold in highly complex digests using ZT Scan DIA, enabling users to gain deeper insight into their biological research
- Maximize specificity: ZT Scan DIA reduces the false discovery rate of protein identification through greater specificity achieved using the scanning quadrupole dimension
Introduction
Studying changes in the dynamic levels and function of proteins is integral to disease research. Mass spectrometry (MS)-based methods for identifying and quantifying proteins and peptides have evolved continuously, with data-independent acquisition (DIA) now widely used. To this end, maximizing the power and utility of DIA requires a delicate balance of MS sensitivity, selectivity, and analysis speed/throughput. Zeno SWATH DIA has been shown to successfully combine these attributes for proteomics research [1-3]. The next step in the evolution of DIA is ZT Scan DIA [4]. Unlike discrete-window DIA methods such as Zeno SWATH DIA, ZT Scan DIA uses a continuously scanning quadrupole to isolate precursor ions for fast, sensitive, time-of-flight (TOF) detection. The added specificity in the quadrupole dimension improves the identification and quantitation of peptides and proteins compared to Zeno SWATH DIA [5-6]. This technical note focuses on the benefits of this enhanced selectivity at the protein sequence coverage level, showing this is improved with ZT Scan DIA as much as 7-fold. Additionally, ZT Scan DIA is demonstrated to reduce the false discovery rate (FDR) for protein identification. This increased coverage depth and specificity enables researchers to gain deeper insight into the complex mechanisms of protein-based biological processes and diseases.
Methods
Sample preparation: Yeast protein extract tryptic digest standard was purchased from Promega. Drosophila melanogaster protein lysate was purchased from GenLysate. Human HEK 293, MCF7, mouse 3T3, and Chinese hamster ovary (CHO) protein lysates were purchased from Innovative Research. Drosophila, HEK 293, MCF7, mouse, and CHO protein lysates were digested with trypsin and purified using S-Traps (Protifi) according to the manufacturer’s instructions. Two lysate digest mixtures were prepared (Table 1), both containing equivalent nanogram amounts of each specified digest; Lysate Mix 1 contained HEK 293, MCF7, yeast, mouse, and CHO digests, while Lysate Mix 2 contained HEK 293, MCF7, yeast, mouse, and Drosophila digests. Lysate Mixes 1 and 2 were each diluted to a final concentration of 100 ng/µL total protein in a buffer containing 5% acetonitrile and 0.1% formic acid in water.
Chromatography: Microflow LC separations were performed with a Waters M-Class UPLC system in direct-inject LC mode, using a Phenomenex XB-C18 analytical column (0.3 mm x 150 mm, 2.6 µm particle size), at a flow rate of 5 µL/min. Mobile phases consisted of 0.1% formic acid in water (A) and 0.1% formic acid in acetonitrile (B). A 15-minute active gradient (25-minute total run time) was used for all experiments. Injection volumes were 2 µL for a total on-column loading of 200 ng digested protein per LC-MS run.
Mass spectrometry: Data-independent acquisition experiments were performed on a ZenoTOF 7600+ system using the OptiFlow Turbo V ion source with the microflow probe (1-10 µL/min electrode). Zeno SWATH DIA experiments used 65 variable-width windows spanning the TOF MS mass range 400-900 Da, MS/MS mass range 140-1750 Da, with MS/MS accumulation times of 13 msec, and Zeno trap pulsing turned on. ZT Scan DIA experiments used an estimated peak width at half-height (PWHH) setting of ≤ 1 sec. MS source parameters were as previously described [5]. Data was acquired in triplicate for all conditions.


Improved protein identification on complex digests using ZT Scan DIA
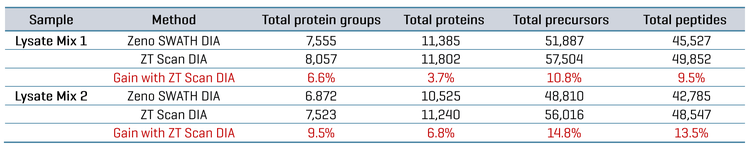
Using 15-minute microflow gradients (25-minute total run time), two different mixtures of lysate digests from various organisms were analyzed using either Zeno SWATH DIA or ZT Scan DIA on the ZenoTOF 7600+ system. These lysate mixtures were designed to challenge the system regarding the specificity of detections, as each differed in composition by one organism (CHO versus Drosophila). Replicate injections were made for each mix, with 200 ng total protein digest loaded on column per run. The ZT Scan DIA method (PWHH ≤ 1 sec) was compared with the 65 variable-window Zeno SWATH DIA method in terms of the resulting identifications of total proteins, protein groups, peptides and precursors after database searches using PEAKS Studio software. Table 4 summarizes the identification results for each mixture. The table shows 6.6% to 9.5% gains in total protein groups, 3.7% to 6.8% gains in total proteins, 10.8% to 14.8% gains in total precursors and 9.5% to 13.5% gains in total peptides using ZT Scan DIA over Zeno SWATH DIA.
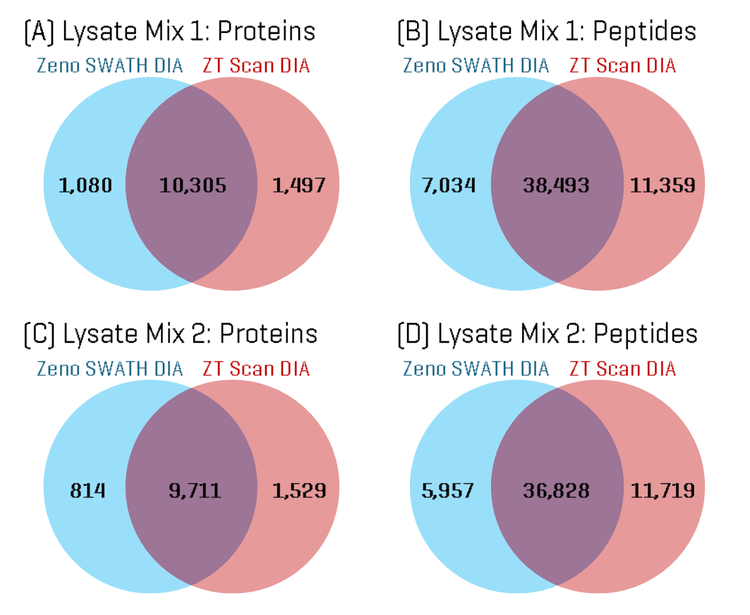
ZT Scan DIA identifies more unique peptides and improves protein sequence coverage
Using the built-in tools within PEAKS Studio software, the total proteins and peptides identified in each Lysate Mix sample were compared for the ZT Scan DIA and Zeno SWATH DIA results. Figure 1 shows Venn diagrams comparing the overlap in proteins and peptides. The Venn diagrams show a high degree of overlap in identifications, although approximately 1.5 to 2-fold more unique proteins and peptides were identified using ZT Scan DIA compared to Zeno SWATH DIA.
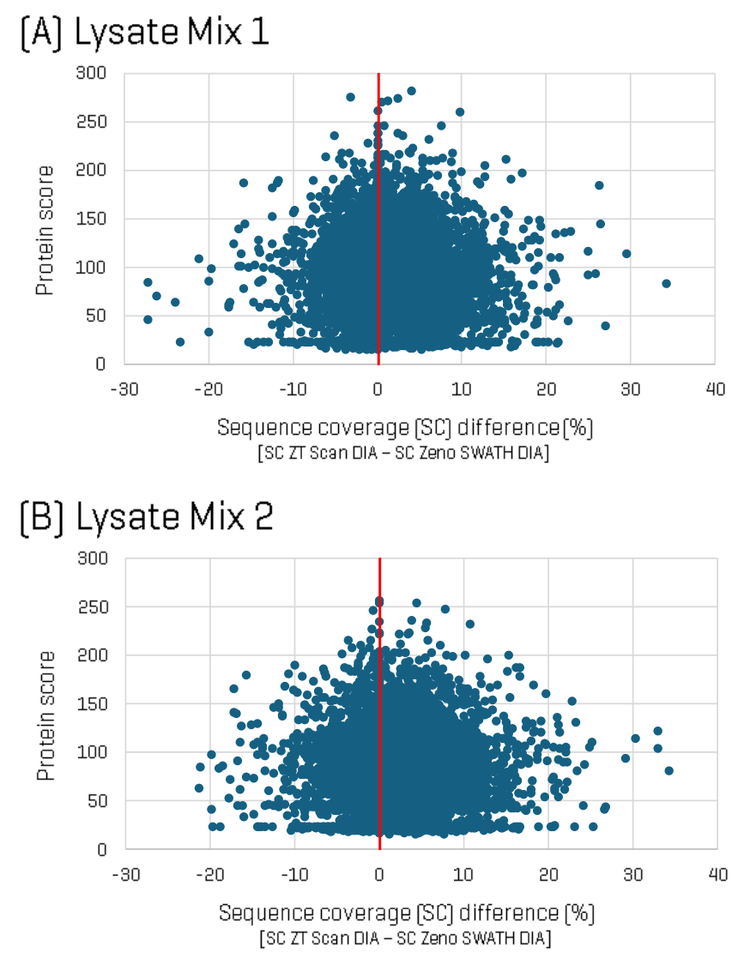
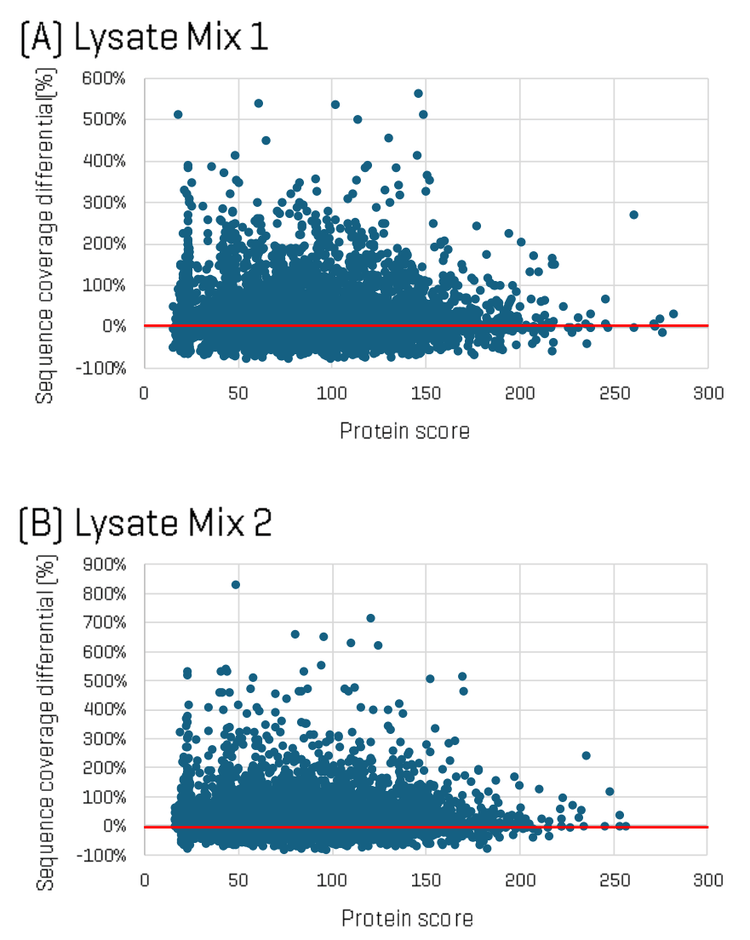
To dig deeper into the differences in identifications between the two methods, sequence coverage per protein was analyzed for each Lysate Mix, comparing ZT Scan DIA versus Zeno SWATH DIA. Figure 2 shows plots of the difference in protein sequence coverage per protein as a function of protein score (for proteins identified in both the ZT Scan DIA and Zeno SWATH DIA datasets) for Lysate Mix 1 (A) and Lysate Mix 2 (B). The plot shows that although some identified proteins had higher sequence coverage using Zeno SWATH DIA, a greater number of proteins were identified with higher sequence coverage using ZT Scan DIA. Differences in sequence coverage of as much as 35% were observed.
ZT Scan DIA reduces the false discovery rate (FDR) of identifications
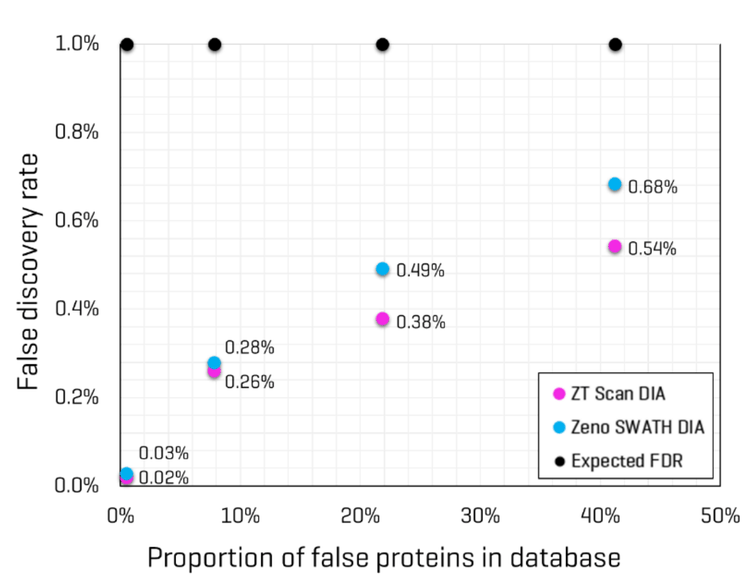
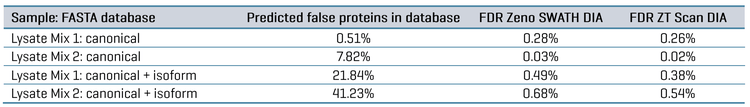
FDR was assessed for the datasets by comparing the database searches done against either the FASTA containing only the combined canonical protein sequences for the 5 organisms (48,408 total proteins) or the FASTA containing both canonical and isoform protein sequences (202,353 total proteins). Since Lysate Mix 1 contains CHO protein digest but not Drosophila melanogaster protein digest, searching that dataset would be expected to identify CHO proteins but not Drosophila proteins.
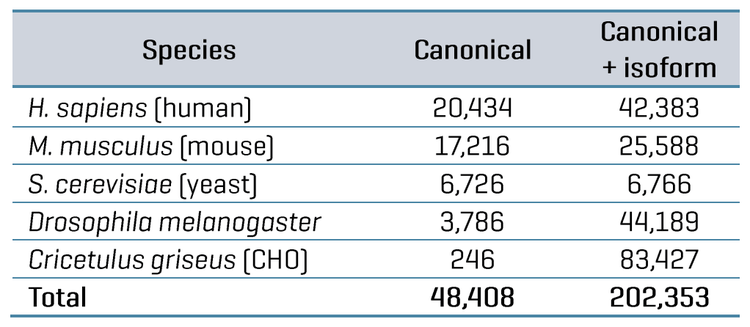
Conversely, Lysate Mix 2 contains Drosophila protein digest but not CHO protein digest; therefore, searching that dataset would be expected to produce identifications for Drosophila but not CHO. The proportion of “false” proteins in the FASTA database was easily predicted for each Lysate Mix, given that the total number of proteins present for each organism in the FASTA is known. The proportion of possible “false” proteins changes significantly when including isoforms compared to the FASTA containing only canonical sequences (see Table 5). The protein and peptide identification results for each Lysate Mix with each MS method were filtered to those reported with an expected FDR of 1%, and the number of peptides uniquely identified for CHO and Drosophila were compared. This data is also summarized in Table 5. The observed FDR rates for each Lysate Mix, run with either ZT Scan DIA or Zeno SWATH DIA, were plotted as a function of the proportion of possible false proteins in the database (Figure 4). These results clearly show that ZT Scan DIA reduces FDR for identifications from 0.03% to 0.02%, 0.28% to 0.26%, 0.49% to 0.38%, and 0.68% to 0.54%, translating to reductions in FDR by as much as 20%. Presumably, this enhancement results from the higher selectivity from the scanning quadrupole, generating MS/MS spectra of higher quality and specificity.
These results collectively highlight the unique benefits of ZT Scan DIA for proteomics research. These enhancements translate to higher protein sequence coverage and more confident identifications, which are crucial to users' understanding of complex biological processes and mechanisms involved in disease.
Conclusions
- Gains in the identifications of total proteins (as much as 6.8%), protein groups (as much as 9.5%), precursors (as much as 14.8%) and peptides (as much as 13.5%) were achieved in highly complex digest mixtures using ZT Scan DIA relative to Zeno SWATH DIA
- ZT Scan DIA identified 1.5-2-fold more unique peptides and proteins than Zeno SWATH DIA, increasing the overall proportion of sequence coverage by as much as 7-fold
- ZT Scan DIA reduced protein identification false discovery rate by as much as 20%, providing higher confidence for proteomics and biomarker research
References
- Quantifying 1000 protein groups per minute of microflow gradient using Zeno SWATH DIA on the ZenoTOF 7600 system. SCIEX technical note, RUO-MKT-02-15429-A.
- Flexibility, speed, and throughput for high proteome coverage using Zeno SWATH data-independent acquisition (DIA) coupled with the Evosep One system. SCIEX technical note, RUO-MKT-02-15461.
- Pushing the boundaries of sensitivity and depth-of-coverage for nanoflow proteomics. SCIEX technical note, MKT-29730-A.
- Continuing the data-independent acquisition (r)evolution: Introducing ZT Scan DIA for quantitative proteomics. SCIEX technical note, MKT-31731-A.
- Improved proteomics performance at high throughput using ZT Scan DIA on the ZenoTOF 7600+ system, SCIEX technical note, MKT-32367-A.
- Improved proteomics performance for low sample loadings using ZT Scan DIA on the ZenoTOF 7600+ system. SCIEX technical note, MKT-32501-A.