Abstract
This technical note describes the benefits of Zeno trap-enabled scanning data-independent acquisition (ZT Scan DIA) on the ZenoTOF 7600+ system for identifying and quantifying protein groups and precursors at low sample loadings. ZT Scan DIA, with the selectivity of the scanning quadrupole dimension, high sensitivity MS/MS enabled by Zeno trap pulsing, and fast time-of-flight acquisition rates, improves the detection of quantifiable protein groups by up to 50% at sub-nanogram levels relative to conventional discrete-window DIA (Zeno SWATH DIA). The ability to identify and quantify proteins and peptides in limited sample amounts benefits researchers seeking to characterize potential low-abundance disease biomarkers.
Key features of using ZT Scan DIA on the ZenoTOF 7600+ system for low abundance proteomics
- Easy method setup: Pre-defined, optimized ZT Scan DIA methods help streamline data acquisition by minimizing development time and manual intervention
- Quantifiable results at low loads: ZT Scan DIA improves the identification of quantifiable proteins and peptides at sub-nanogram column loadings by up to 50%
- Biologically relevant results acquired faster: ZT Scan DIA delivers quantifiable results equivalent to conventional discrete-window DIA with up to 3 times faster throughput, significantly enhancing research efficiency
Introduction
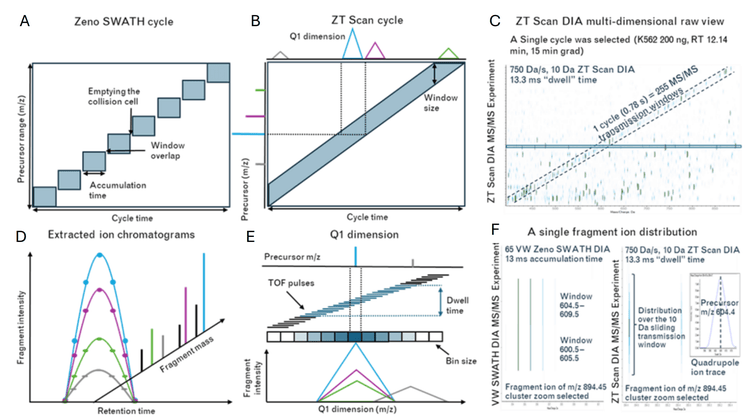
Protein biomarker research aims to identify quantifiable, biologically relevant markers for disease study and clinical treatment. These protein biomarkers often exist at trace levels in biological matrices or tissues, necessitating complex methodologies and instrumentation for their detection and quantitation. Advances in mass spectrometry technologies that can improve the characterization of low-level biomarkers are highly important. Data-independent acquisition (DIA) workflows are commonly utilized due to the relative simplicity of the methods and the depth of information they yield. Unlike discrete-window DIA methods such as Zeno SWATH DIA, ZT Scan DIA uses a continuously scanning quadrupole to isolate precursor ions for fast, sensitive, time-of-flight (TOF) detection (Figures 2 and 3). The added specificity in the quadrupole dimension significantly improves the identification and quantitation of peptides and proteins compared to Zeno SWATH DIA1,2 . This technical note highlights the unique benefits of ZT Scan DIA at low on-column loadings using microflow and nanoflow liquid chromatography (LC), approaching single-cell levels, with quantifiable protein group and precursor detections increased by as much as 50%. ZT Scan DIA improves quantifiable identifications at higher throughput LC regimes2. This feature is also highlighted in this work with low sample loadings – ZT Scan DIA delivers equivalent performance to Zeno SWATH DIA with significantly shorter microflow or nanoflow LC gradients, enabling users to obtain biologically relevant results faster.
Methods
Sample preparation: Human K562 protein tryptic digest standard was purchased from Promega and serially diluted to final concentrations between 250 pg/µL and 100 ng/µL in a buffer containing 5% acetonitrile and 0.1% formic acid in water.
Chromatography: Microflow and nanoflow LC separations were performed with a Waters M-Class UPLC system in direct-inject LC mode. Mobile phases consisted of 0.1% formic acid in water (A) and 0.1% formic acid in acetonitrile (B). Microflow separations were done using a Phenomenex XB-C18 analytical column (15 cm x 300 µm, 2.6 µm particle size) at a flow rate of 5 µL/min, using 5- or 15-minute active gradients of 3-35% mobile phase B (15- or 25-minute total run times, respectively). Nanoflow separations were done using an IonOpticks Aurora Elite SX column (15 cm x 75 µm, 1.7 µm particle size) at a flow rate of 150 nL/min, using 15- or 30-minute active gradients of 3-35% mobile phase B (55- or 70-minute total run times, respectively). Injection volumes were 1 µL for all LC-MS runs.
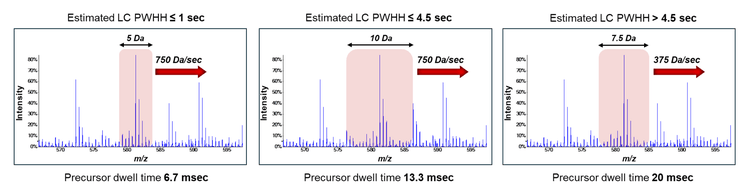
Mass spectrometry: DIA experiments were performed on a ZenoTOF 7600+ system. An OptiFlow Turbo V ion source was used with the microflow probe (1-10 µL/min electrode) for the microflow experiments, with source parameters as previously described3. The nanoflow experiments used the horizontal nanoflow probe on the OptiFlow Turbo V source and the OptiFlow interface, with source parameters as previously described4. Zeno SWATH DIA experiments used variable-width windows spanning the TOF MS mass range 00-900 Da and MS/MS mass range 1 0-1750 Da, with Zeno trap pulsing turned on. For microflow experiments, 65 variable windows were used with MS/MS accumulation times of 13 msec; for nanoflow experiments, 85 variable windows were used with MS/MS accumulation times of 18 msec. ZT Scan DIA experiments used an estimated peak width at half-height (PWHH) settings of ≤ .5 sec for the microflow experiments. For nanoflow experiments, a PWHH setting of > .5 sec was for the 30-minute nanoflow gradients and ≤ .5 sec for the 15-minute nanoflow gradients. Data was acquired in triplicate for all conditions.
Data processing: All data was processed using DIA-NN software version 1.8.15 against a previously described K562/HeLa spectral library6. Default DIA-NN software search settings were used with the following changes: Precursor m/z range was adjusted to 00-900, Fragment m/z range was adjusted to 1 0-1750, mass accuracy tolerance was set to 20 ppm, MS1 accuracy was set to 0 ppm, Scan window was set to 6, and MBR was checked. The --scanning-swath command option was used for all ZT Scan DIA data processing. Searches were done individually, processing only triplicate data files from the same loading/gradient/method.
Gains in quantitative identifications using ZT Scan DIA at low sample loadings
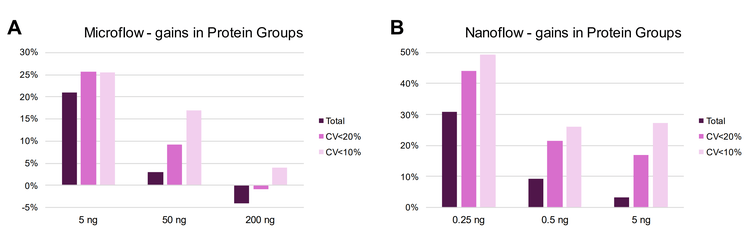
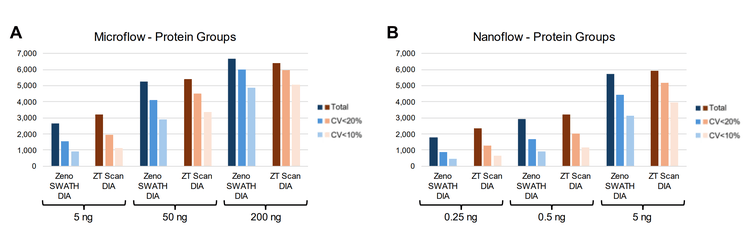
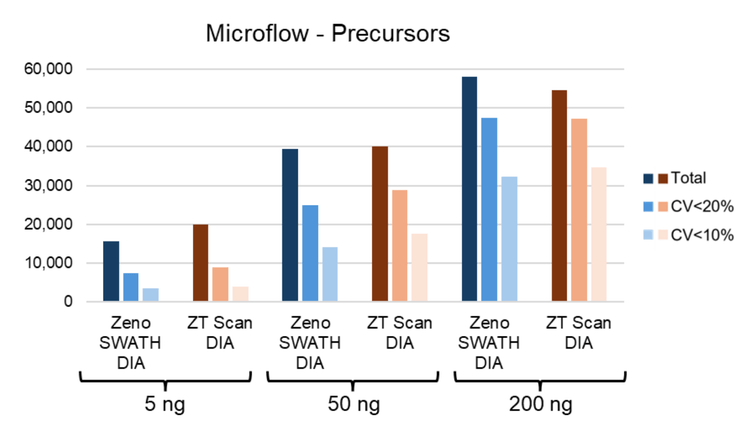
ZT Scan DIA and Zeno SWATH DIA were compared using microflow LC (15-minute gradients) and nanoflow LC (30- minute gradients) across different on-column loadings of K562 digest. The gains in the total protein groups identified and quantified at CVs of <20% and <10% with ZT Scan DIA are summarized in Figure 1. The gains progressively increase as the on-column loadings decrease, being the highest at the 5 ng loadings for microflow LC (Figure 1A, where the quantifiable identifications improve by >25%) and 0.25 ng for nanoflow LC (Figure 1B, where the quantifiable identifications improve by as much as 50%). The data highlights the improvements in quantitative precision with ZT Scan DIA, with the highest gains for protein groups with CV <10%. The total number of identified and quantified protein groups across these levels is shown in Figure . This trend is also highlighted at the precursor level using microflow LC in Figure 5, showing that the gains in the identification and quantitation of precursors also increase as the on-column loadings decrease. Quantitative precision is a critical attribute for biomarker characterization, and these results indicate the potential benefits of ZT Scan DIA for the quantitative measurements of low-level biomarkers or with limited overall amounts of sample.
ZT Scan DIA achieves quantitative identifications with faster throughput
As previous work has demonstrated the benefits of ZT Scan DIA at high throughput separations2, the effects of improved quantitative identifications at low sample loadings using ZT Scan DIA were subsequently evaluated using faster microflow and nanoflow LC gradients. On-column K562 loadings of 5 ng (for microflow LC) and 0.5 ng (for nanoflow LC) were chosen for this testing. The performance differences between ZT Scan DIA and Zeno SWATH DIA for microflow LC were compared at 15-minute and 5-minute active gradients. Nanoflow LC performance differences were compared at 30-minute and 15-minute active gradients. The results are summarized in Figure 6. Using a 5-minute gradient for microflow LC resulted in slightly fewer overall protein groups being identified relative to the corresponding 15-minute gradient for ZT Scan DIA and Zeno SWATH DIA (Figure 6A). However, the numbers of quantified protein groups (at CV <20% and CV <10%) with ZT Scan DIA using the 5-minute gradient were better than or equal to those with Zeno SWATH DIA with either gradient. The gains of quantifiable protein groups with ZT Scan DIA relative to Zeno SWATH DIA were higher for the 5-minute gradient compared to the 15-minute gradient (Figure 6C). Notably, the overall numbers of total and quantifiable protein group identifications using ZT Scan DIA with a 5-minute gradient were higher than with Zeno SWATH DIA at the 15-minute gradient.
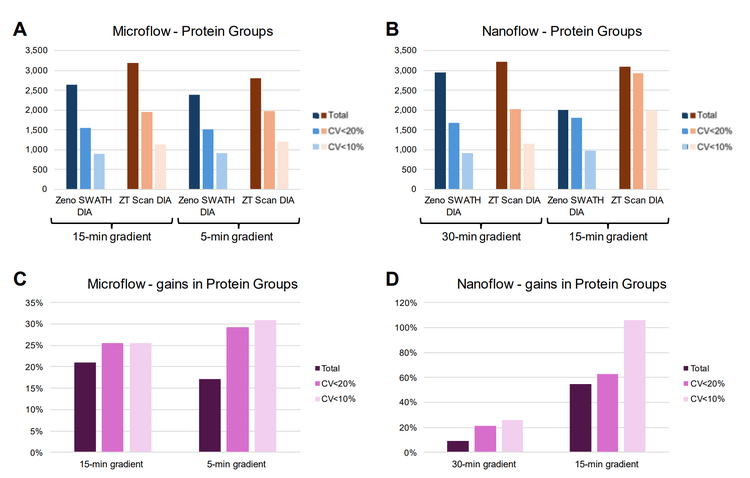
These performance improvements with shorter gradients were even more apparent with nanoflow LC (Figures 6B and 6D). Utilizing 15-minute active gradients resulted in higher gains with ZT Scan DIA relative to Zeno SWATH DIA compared with the 30-minute active gradients, particularly with the numbers of quantifiable protein groups. Notably, significantly more protein groups were identified with CV <20% (>60%) and CV <10% (>100%) using ZT Scan DIA 0 500 1,000 1,500 2,000 2,500 3,000 3,500 Zeno SWATH DIA ZT Scan DIA Zeno SWATH DIA ZT Scan DIA Microflow - Protein roups Total C V<2 0% C V<1 0% 0% 5% 1 0% 1 5% 2 0% 2 5% 3 0% 3 5% 15-min gradient 5-min gradient Microflow - gains in Protein roups Total C V<2 0% C V<1 0% 0 500 1,000 1,500 2,000 2,500 3,000 3,500 Zeno SWATH DIA ZT Scan DIA Zeno SWATH DIA ZT Scan DIA Nanoflow - Protein roups Total C V<2 0% C V<1 0% 0% 2 0% 0% 6 0% 8 0% 100% 120% 30-min gradient 15-min gradient Nanoflow - gains in Protein roups Total C V<2 0% C V<1 0% 15-min gradient 5-min gradient 30-min gradient 15-min gradient A B C D with the shorter gradient. Additionally, the number of quantifiable identifications with ZT Scan DIA using 15- minute active gradients significantly surpasses the total number of identifications with Zeno SWATH DIA using 30- minute active gradients.
These results demonstrate that ZT Scan DIA empowers users to generate more quantitatively accurate results from limited sample amounts. Furthermore, ZT Scan DIA delivers equivalent or better proteomics performance at low sample loadings to conventional DIA approaches when using faster LC gradients, allowing users to get meaningful results in a fraction of the time.
Conclusion
- ZT Scan DIA increases quantitative protein group identifications by as much as 50% over conventional Zeno SWATH DIA at sub-nanogram column loads
- Quantifiable protein group identifications (at CV <10%) improve by as much as 100% with ZT Scan DIA using 15- minute nanoflow gradients relative to Zeno SWATH DIA
- ZT Scan DIA delivers equivalent or better numbers of total and quantifiable protein group identifications in up to 1/3rd the time relative to Zeno SWATH DIA
References
- Continuing the data independent acquisition (r)evolution: Introducing ZT Scan DIA for quantitative proteomics. SCIEX technical note, MKT-31731-A.
- Improved proteomics performance at high throughput using ZT Scan DIA on the ZenoTOF 7600+ system, SCIEX technical note, MKT-32367-A.
- Quantifying 1000 protein groups per minute of microflow gradient using Zeno SWATH DIA on the ZenoTOF 7600 system. SCIEX technical note, RUO-MKT-02-15 29-A.
- Pushing the boundaries of sensitivity and depth-of-coverage for nanoflow proteomics. SCIEX technical note, MKT-29730-A.
- Demichev V et al. (2019) DIA-NN: neural networks and interference correction enable deep proteome coverage in high throughput. Nature Methods, 17, 1-44.
- Large-scale protein identification using microflow chromatography on the ZenoTOF 7600 system. SCIEX technical note, RUO-MKT-02-1 15-A.