Confident identification of phase 1 metabolites using electron-activated dissociation (EAD)
Identification of phase 1 metabolites of pioglitazone using EAD on the ZenoTOF 7600 system
Rahul Baghla and Eshani Nandita
SCIEX, USA
Abstract
This technical note describes the identification of pioglitazone phase 1 metabolites from a hepatocyte incubation using comprehensive spectral data from an orthogonal fragmentation technique. More informative MS/MS spectra provided by EAD aided in the software-based identification of phase 1 metabolites to support drug metabolism studies.
Introduction
Drug metabolism plays a vital role in drug discovery and development, affecting pharmacokinetics, pharmacodynamics and safety. Studies of in vitro metabolism of drugs in human and animal tissues help identify major metabolism pathways ("soft spots").1
The Mass-MetaSite software employs several algorithms to detect the peaks corresponding to metabolites in the mass spectra obtained from incubated samples. This process includes background subtraction, noise suppression, isotope pattern analysis, retention time analysis and mass shift analysis based on cyp, non-cyp and other uncommon reactions. A potential metabolite is scored based on the number of matches between its fragments and the parent compound. Site of metabolism (SoM) predictions generated by the Mass-MetaSite software can be used to distinguish between potential regioisometric metabolites that have the same fragmentation patterns and mass shifts. This technical note demonstrates an efficient soft-spot identification workflow using a novel orthogonal fragmentation technique, EAD, on the ZenoTOF 7600 system (Figure 1). Sites of metabolism were predicted using the Mass-MetaSite software.
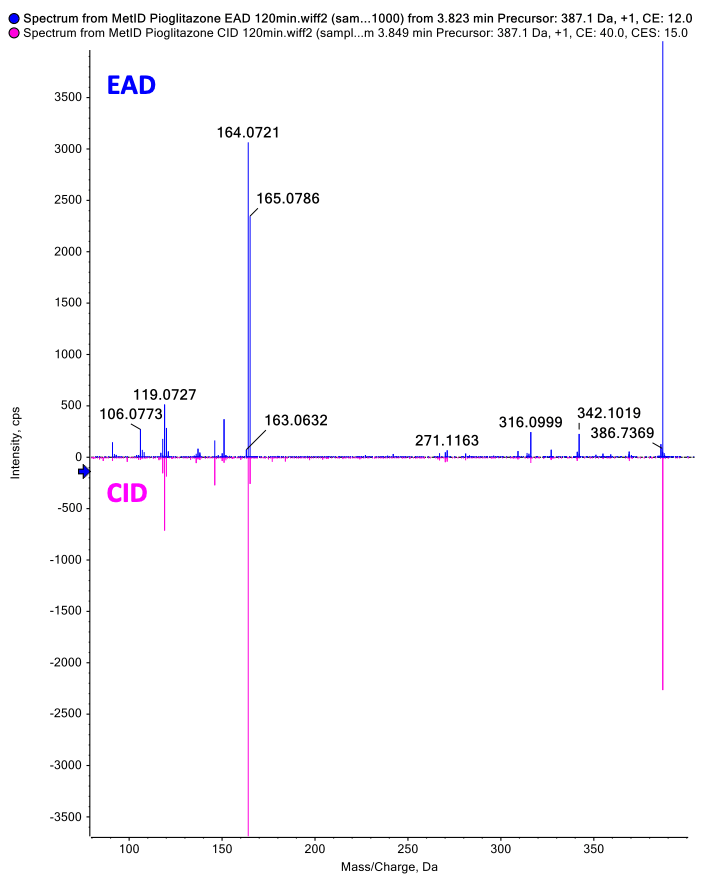
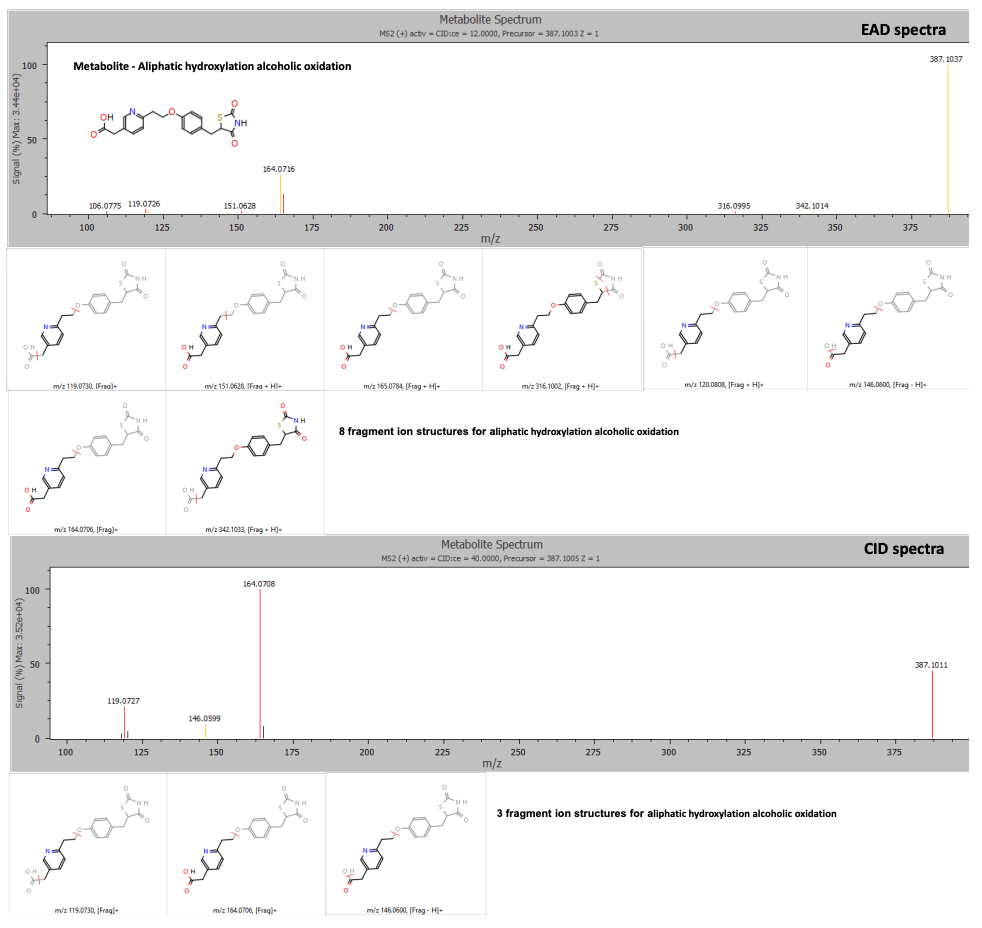
Figure 1. EAD provided rich MS/MS spectra for confident identification of pioglitazone phase 1 metabolites. EAD (top) and CID (bottom) spectra for a metabolite showing aliphatic hydroxylation and alcoholic oxidation at a retention time of 3.77 minutes.
Key features for the identification of metabolites using the ZenoTOF 7600 system
- Confident identification: Acquire more fragments to confidently identify the site of metabolism for phase 1 metabolites with EAD. EAD spectra were more informative than collision-induced dissociation (CID) spectra for metabolite identification.
- Fast characterization and identification: Achieve rapid and efficient software-aided characterization and identification of drug metabolites from hepatocyte incubations using the ZenoTOF 7600 system
- Detection of low-level metabolites: Identify low-level metabolites present in drug metabolism studies with enhanced MS/MS sensitivity provided by the Zeno trap
- Streamlined data acquisition and processing workflow: Develop confident structure-metabolic stability relationships for drugs using a quick, easy-to-use workflow from acquisition to analysis
Methods
Sample preparation: Pioglitazone was incubated at 37°C in human hepatocytes at a starting concentration of 5µM. Samples were removed from incubation and quenched with acetonitrile at 0-, 30-, 60-, 90- and 120-minute intervals.
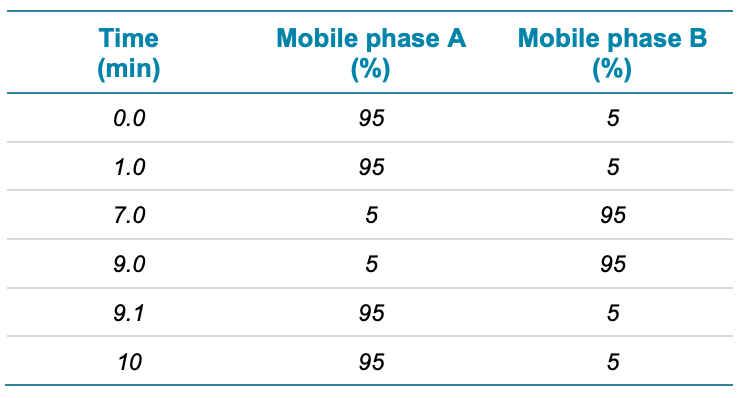
Chromatography: Separation was performed on a Phenomenex Kinetex Polar C18 column (2.1 x 100 mm, 2.6 µm, 100 Å) at a column temperature of 40°C. Mobile phase A was 0.1% (v/v) formic acid in water and mobile phase B was 0.1% (v/v) formic acid in methanol. An injection of 5 µL was subjected for analysis.
The chromatographic gradient conditions used are summarized in Table 1.
Table 1. Chromatographic gradient.
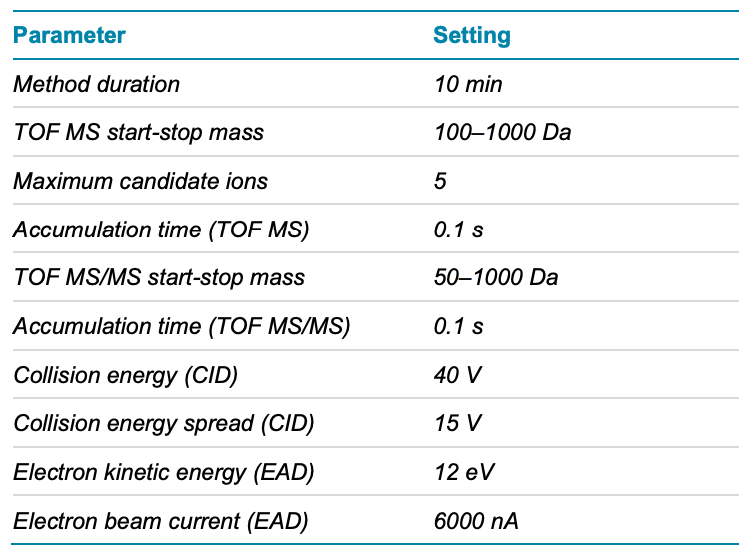
Mass spectrometry: The samples were analyzed using the data-dependent acquisition (DDA) method with Zeno CID DDA and Zeno EAD DDA on the ZenoTOF 7600 system. The source and gas conditions used are summarized in Table 2. The method conditions are summarized in Table 3
Table 2. Source and gas conditions.
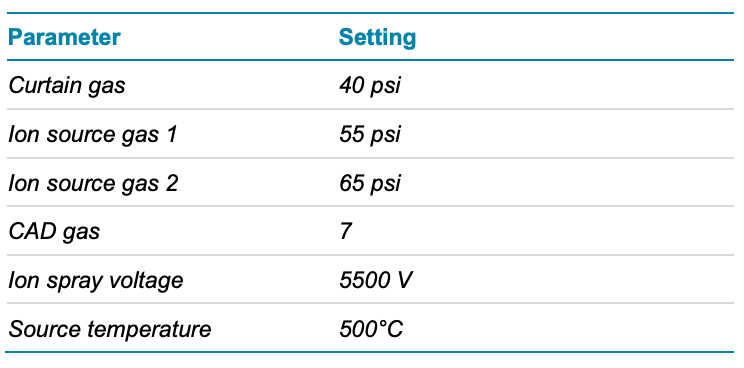
Table 3. Zeno DDA parameters.
Data processing: SCIEX OS software, version 3.0 was used for data acquisition. The Mass-MetaSite software was used to predict biotransformation sites using Zeno CID DDA and Zeno EAD DDA data.4-9
EAD provides positional information to identify the site of metabolism
In the 120-minute incubation sample, 3 peaks at retention times of 3.53, 3.77 and 4.13 minutes were identified as hydroxy pioglitazone.
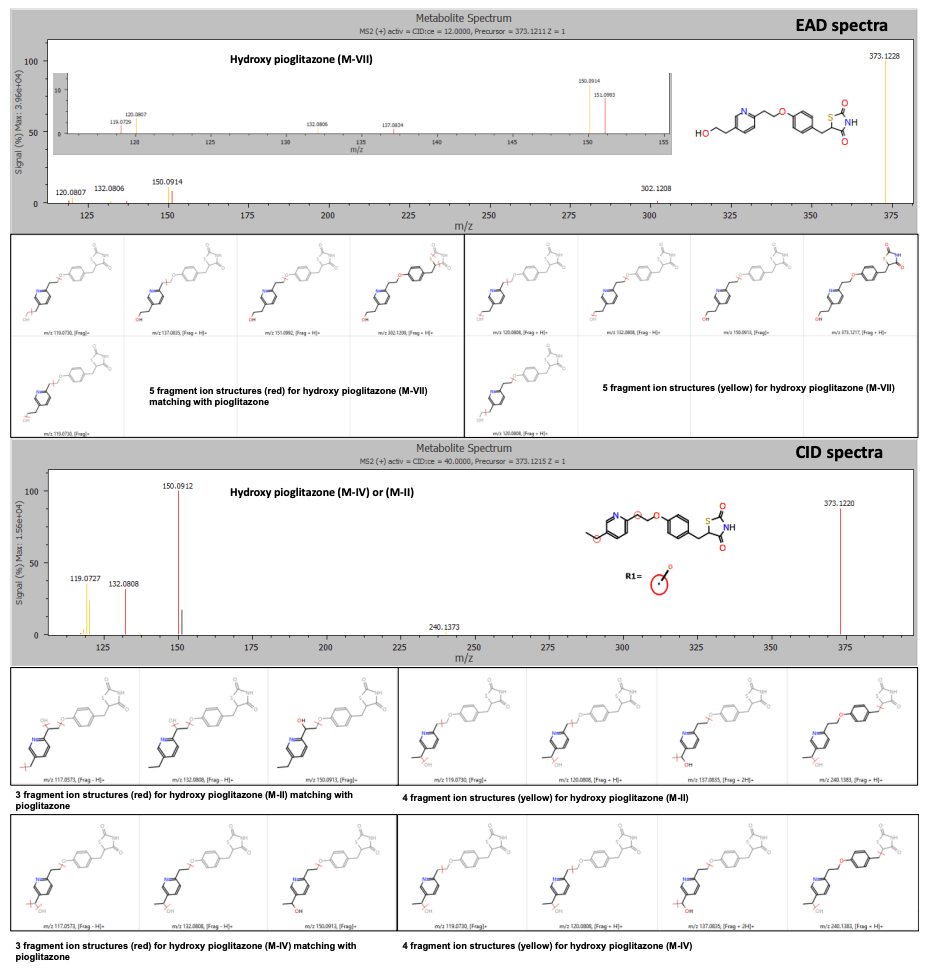
The Mass-MetaSite software identified the peaks as hydroxy pioglitazone using both Zeno CID DDA and Zeno EAD DDA data. The Zeno EAD data for the hydroxy pioglitazone peak at 3.53 minutes yielded 10 product ion matches. Therefore, the software labeled this peak hydroxy pioglitazone (M-VII). In comparison, for the Zeno CID data, the software predicted 2 possibilities for hydroxylation, which included hydroxy pioglitazone (M-II) and hydroxy pioglitazone (M-IV). These 2 structures were predicted with equal likelioods and 7 product ion matches each (Figure 2).
Figure 2. EAD and CID spectra for the hydroxy pioglitazone metabolite at retention time 3.53 minutes with fragment ion matches for structures predicted by Mass-MetaSite software. Product ion matches with pioglitazone are displayed in red and metabolite-specific matches are indicated in yellow.
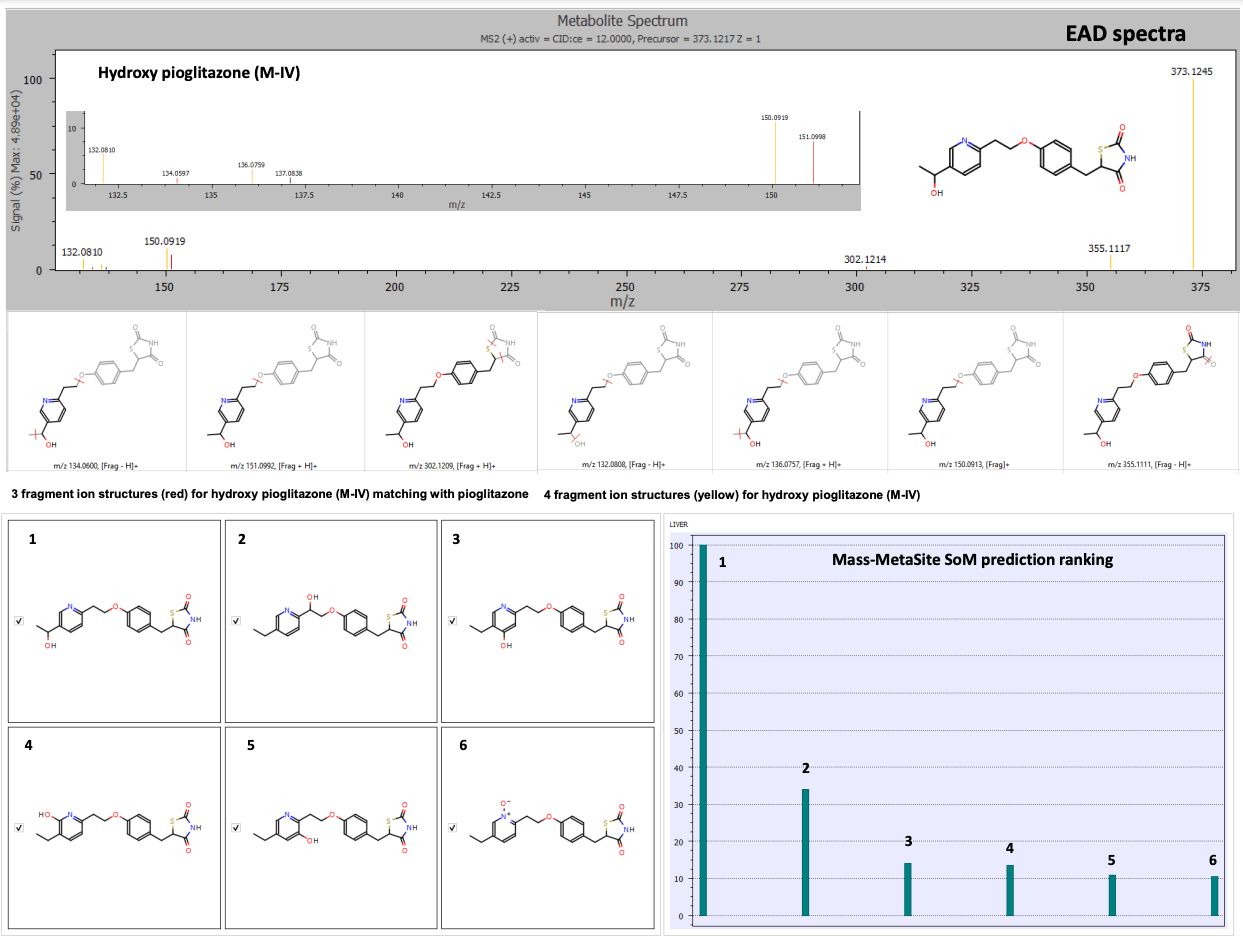
The hydroxy pioglitazone peak at retention time 3.77 minutes was scored highest for hydroxy pioglitazone (M-II) based on 6 product ion matches. The hydroxy pioglitazone (M-II) was ranked second with 6 fragment matches from CID data. EAD data resulted in 6 possible structures for the hydroxyl metabolite. The hydroxy pioglitazone (M-IV) was ranked first with the highest score and 7 product ion matches (Figure 3).
Figure 3. EAD spectra for the hydroxy pioglitazone metabolite at retention time 3.77 minutes with fragment ion matches for structures predicted by Mass-MetaSite software and SoM prioritization ranking. Product ion matches with pioglitazone are displayed in red and metabolite-specific matches are indicated in yellow. The SoM prioritization ranking indicated the highest probability match for hydroxy pioglitazone (M-IV).
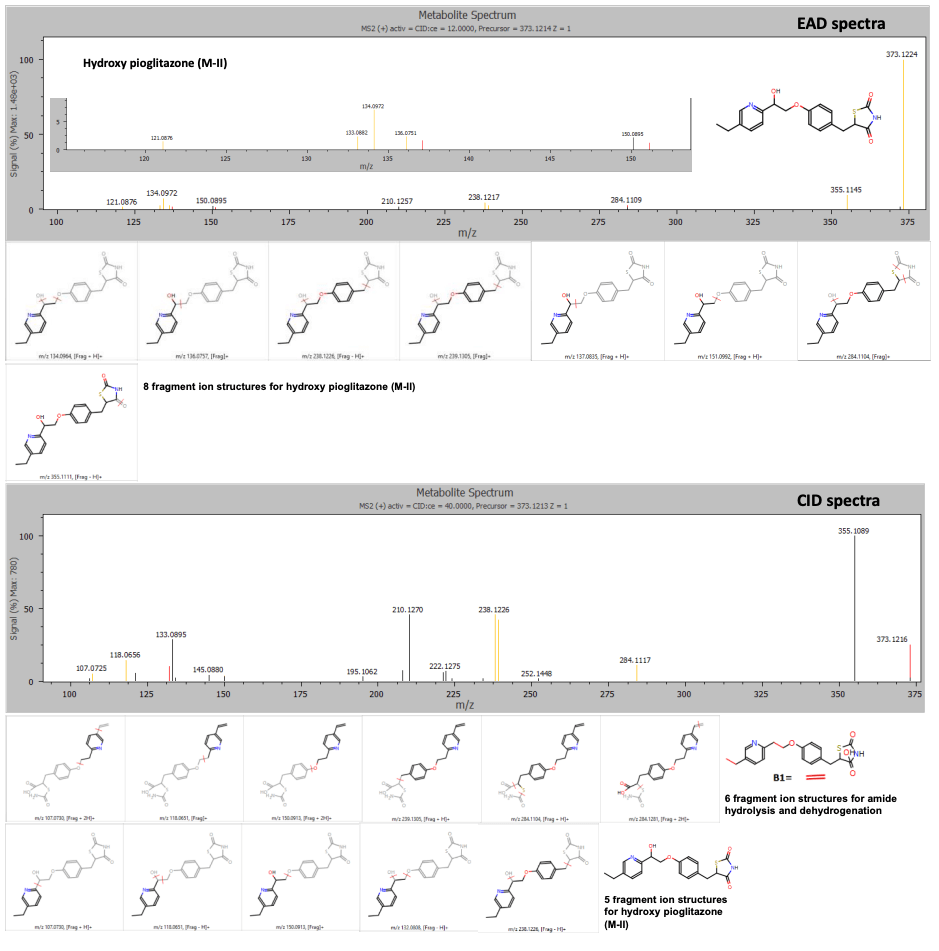
The hydroxy pioglitazone peak at retention time 4.13 minutes was labeled as a possible amide hydrolysis and dehydrogenation based on 6 product ion matches or hydroxy pioglitazone (M-II) with low probability based on 5 product ion matches from the CID data. The EAD data indicated a higher likelihood that the peak corresponded to hydroxy pioglitazone (M-II) based on 8 product ion matches (Figure 4).
Figure 4. EAD and CID spectra for the hydroxy pioglitazone metabolite at retention time 4.13 minutes with fragment ion matches for structures predicted by Mass-MetaSite software. Product ion matches with pioglitazone are displayed in red and metabolite-specific matches are indicated in yellow.
A metabolite with aliphatic hydroxylation and alcoholic oxidation was labeled at retention time 3.78 minutes using both EAD and CID spectra. The rich MS/MS spectra collected by EAD enabled a more confident structure assignment. The EAD data yielded 8 fragment matches, whereas the CID data yielded only 3 fragment matches (Figure 5). 3-9
Figure 5. EAD and CID spectra for a metabolite showing aliphatic hydroxylation and alcoholic oxidation with fragment ion matches for structures predicted by Mass-MetaSite software. Product ion matches with pioglitazone are displayed in red and metabolite-specific matches are indicated in yellow.
All 3 pioglitazone hydroxy metabolites (M-VII, M-IV and M-II) were confirmed by matching their respective retention time with standard solution injections. The ZenoTOF 7600 system demonstrated excellent mass accuracy for the workflow. All metabolites and fragments were identified with <2 ppm error, which enabled the confident identification of phase 1 metabolites present in an in vitro metabolism study of pioglitazone. Furthermore, the identification of phase 1 metabolites was easily and confidently performed with the MS/MS coverage provided by Zeno EAD on the ZenoTOF 7600 system.
Conclusion
- More information-rich product ion spectra provided by EAD aided in the rapid software-aided characterization and identification of phase 1 metabolites from hepatocyte incubations of pioglitazone on the ZenoTOF 7600 system
- The presented workflow can be easily adapted for in vivo metabolism studies for the detection of low-level metabolites with the enhanced sensitivity provided by the Zeno trap
- A streamlined data acquisition and processing workflow was utilized to expedite data reduction and develop confident structure-metabolic stability relationships for pharmaceutical drugs
References
- Zhang, Z.; Tang, W. (2018). Drug metabolism in drug discovery and development. Acta Pharm Sin B. 8(5): 721-732.
- Orthogonal fragmentation mechanism enables new levels of metabolite characterization, SCIEX technical note, RUO-MKT02-13348-A.
- Boon, B. et al. (2010). Enhanced metabolite identification with MS(E) and a semi-automated software for structural elucidation. Rapid Commun Mass Spectrom. 24(21): 3127-38.
- Zamora, I. et al. (2013). High-throughput, computerassisted, specific MetID. A revolution for drug discovery. Drug Discovery Today Technol. 10(1): e199-205.
- Strano-Rossi, S. et al (2014). Metabolism of JWH-015, JWH-098, JWH-251, and JWH-307 in silico and in vitro: a pilot study for the detection of unknown synthetic cannabinoids metabolites. Analytical and Bioanalytical Chemistry. 406(15): 3621-3636.
- Zelesky, V. (2013). Software automation tools for increased throughput metabolic soft-spot identification in early drug discovery. Bioanalysis, 5(10): 1165-1179.
- Li, A.C. (2013). Update on hydrocodone metabolites in rats and dogs aided with a semi-automatic software for metabolite identification Mass-MetaSite. Xenobiotica, 43(4): 390-398.
- Brink, A. et al. (2014). Post-acquisition analysis of untargeted accurate mass quadrupole time-of-flight MS(E) data for multiple collision-induced neutral losses and fragment ions of glutathione conjugates. Rapid Commun Mass Spectrom. 28(24): 2695-703.
- Ge, S; Tu, Y; Hu, M. Challenges and opportunities with predicting in vivo phase II metabolism via glucuronidation from in vitro data (2016). Curr Pharmacol Rep. 2(6): 326-338