Robustness of the SCIEX 7500 system for small molecule analysis in tissue
Michael Deng and Ian Moore
SCIEX, Canada
Abstract
The robustness of the SCIEX 7500 system was evaluated using two pharmaceuticals in a complex matrix. An extract of rat liver tissue was prepared using standard extraction protocol. Over 4000 injections were performed and very good reproducibility was observed with %CV <8 on two standard compounds.

Introduction
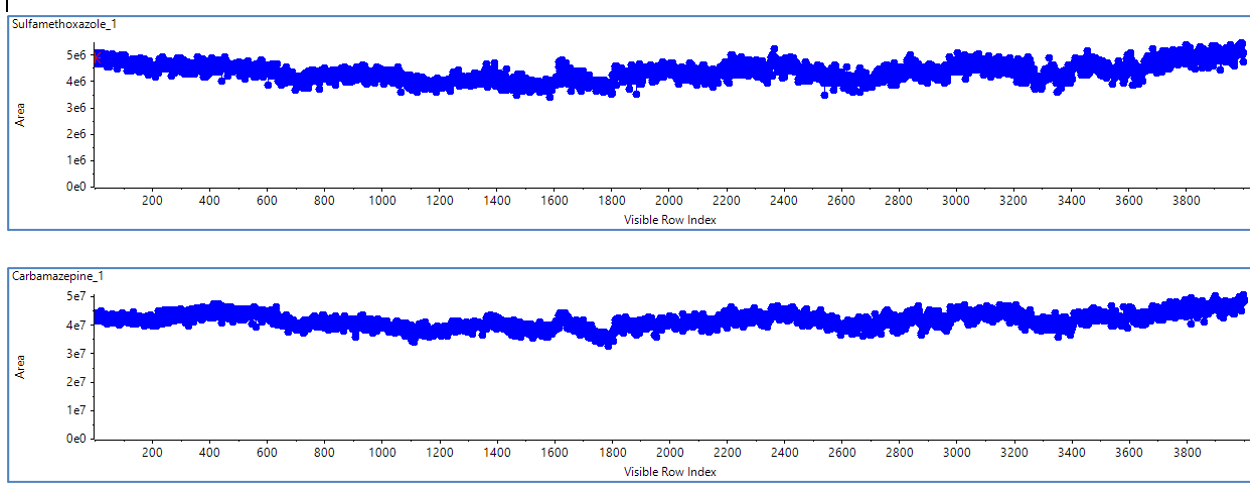
Robust and stable instrument response is needed for efficient lab operation, accuracy of study conclusions and confidence in reported results. Since its launch, the SCIEX 7500 system has demonstrated tremendous sensitivity.1-4 The objective of this study was to establish the robustness of this system by analyzing compounds present in a complex rat liver homogenate matrix over 4,000 injections (Figure 1). Rat liver homogenate was selected as a matrix to increase the complexity of the samples, as it is a biological tissue sample that is both scientifically relevant and known to present a challenge to instrument robustness. The capacity of the system to provide high-quality, reproducible data, even when run continuously for multiple weeks, addresses the needs of many laboratories to analyze many valuable, complex and challenging samples.
Figure 1. The detected peak areas for sulfamethoxazole and carbamazepine spiked into rat liver matrix were exceptionally consistent over 4,000 continuous injections. The %CV for peak area of both analytes over all injections was less than 8%.
Key features of the SCIEX 7500 system
- Features such as the OptiFlow Pro ion source, E Lens probe and the D Jet ion guide provide enhanced sensitivity on the SCIEX 7500 system
- Peak area %CV values less than 8% over 4,000 continuous injections of 2 analytes demonstrate high reproducibility
- Preservation of signal over continuous injections of highly complex tissue matrix demonstrates system robustness.
Methods
Sample preparation: A sample preparation protocol was employed that included protein precipitation, concentration of the supernatant and reconstitution of the extract in mobile phase A with a 2X dilution factor relative to the initial sample volume. This protocol to yield a highly concentrated biological matrix allows for rigorous assessment of instrument performance in challenging matrices.
First, 1:10, rat liver homogenate/PBS was prepared without detergents (BIOIVT, Hicksville , NY). The protein precipitation step was performed with 3:1, methanol/tissue homogenate and the sample was vortexed and centrifuged to complete the precipitation. For the purposes of this study, 3.5 mL of homogenate and 10.5 mL of methanol were used. Following precipitation, the supernatant was removed from the precipitate and dried under nitrogen. The dried sample was then reconstituted with 7 mL of 80:20, mobile phase A/mobile phase B. The sample was vortexed and sonicated to ensure complete reconstitution. The final sample was filtered sequentially through 0.45 µm and 0.2 µm cellulose filters to remove all particulates before injection onto the LC-MS/MS system. The final dilution factor was 2-fold from the original sample volume. Figure 2 shows images of the sample matrix at various stages of the preparation protocol. After filtering, the processed matrix was spiked with a mixture of the 2 analytes.
Chromatography: The LC system was a Shimadzu LC-40 system. A Phenomenex Kinetex XB-C18 (2.6µm, 100 Å, 50 x 2.1mm) analytical column was used with a 3-minute LC gradient. Mobile phase A was 0.1% formic acid with 5 mM ammonium formate in water and mobile phase B was methanol. The method started at 20% mobile phase B for 0.1 minute, then was ramped to 80% B until 2.5 minutes. The method was held at 80% B for 0.5 minutes, then returned to the start conditions over 0.25 minutes. The flow rate was 0.5 mL/min throughout and a 3 µL injection volume was used. An example chromatogram showing peaks for both target analytes is shown in Figure 3.
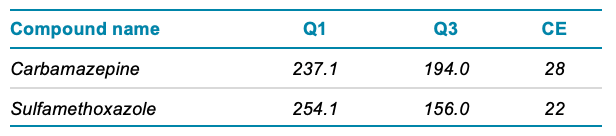
Mass spectrometry: A SCIEX 7500 system equipped with the OptiFlow Pro ion source and E Lens probe was used. The source conditions were CUR gas 40 psi, GS1 55 psi, GS2 70 psi, TEM 400°C. The defined MRM transitions and the settings specific to the target analytes are shown in Table 1.
Data processing: Data processing was performed using SCIEX OS software and the Analytics module.
Figure 2. Sample preparation process. The rat liver homogenate and the employed extraction and preparation protocol were selected to represent a highly challenging and complex biological tissue matrix. These images show the sample at various stages during the extraction and concentration of the rat liver homogenate. The appearance, including the color, indicate that the matrix is rich in endogenous components. It is visually observed that protein precipitation and filtering both contribute to reduction in cloudiness.
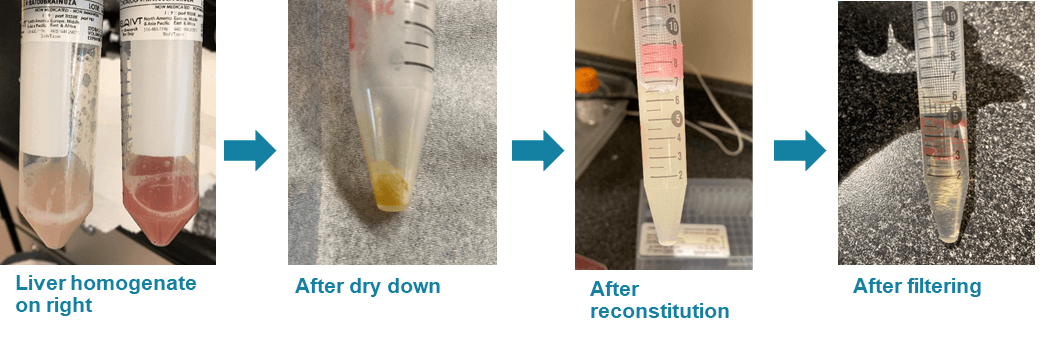
Figure 3. Optimized chromatography. Example chromatogram showing the peaks for the fortified carbamazepine (1.8 min, blue trace) and sulfamethoxazole (1.1 min, pink trace) in rat liver matrix.
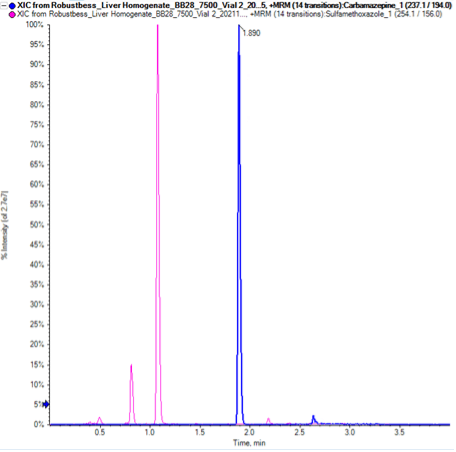
Table 1. MRM transitions and collision energy settings for target analytes.
Chromatographic data
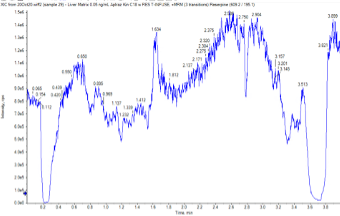
To qualify the complexity and potential for matrix suppression of the rat liver samples, a matrix suppression profile test was performed using reserpine as the model infused compound. In the matrix suppression profile test, a sample of the rat liver matrix was injected onto the analytical column using the optimized chromatography method (Figure 2) and a reserpine standard was continuously infused post-column, upstream of the ion source. The objective of this test was to monitor for decreases in analyte signal along the chromatogram to determine when high amounts of endogenous matrix species eluted, causing significant signal suppression for target pharmaceuticals. This is a common and effective strategy to visualize the potential impact of a matrix on analyte signal and how chromatographic strategy can impact matrix effects on target analytes.
The matrix suppression profile is shown in Figure 4. Complete signal suppression of the analyte by the rat liver matrix was observed in early and late portions of the chromatogram. No divert valves were used in the completion of this experiment. These results indicate that although rat liver matrix is a challenging matrix for MS analysis, the analytical peaks for the target analytes were generally chromatographically well-resolved from the most signal-suppressing matrix components.
Figure 4. Matrix suppression test profile. A blank sample of rat liver matrix was injected and reserpine was infused post-column. This test demonstrates the potential of the matrix to suppress signal at the beginning and end of the chromatogram. Note that minimal suppression is observed at the elution times of the selected compounds (1.1 and 1.8 mins).
Statistical analysis of robustness
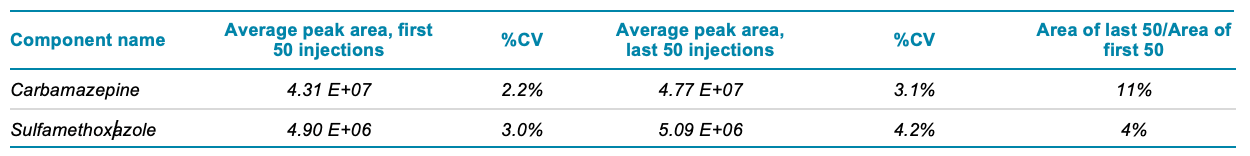
During the acquisition of 4,000 injections, the system ran continuously for 20 days. Over the course of the experiment, a total of approximately 12 mL of processed sample, or the equivalent of 6 mL of pre-processed rat liver homogenate, was injected onto the system. The calculated mean, standard deviation and %CV values for peak area are shown in Table 2 for carbamazepine and sulfamethoxazole. The peak area %CV of more than 4,000 continuous injections of both analytes was less than 8%. Figure 1 shows plots of the peak areas for these compounds. These low %CV values indicate excellent reproducibility and reflect the performance of the LC and MS systems. A more relevant measure of system robustness is the change in system sensitivity during this long period of continuous use. Loss of signal over time might not be detected by either the mean or %CV. Therefore, the average area of the first 50 injections was compared to the average area of the last 50 injections for both analytes. This comparison revealed little difference in the peak areas over time, with peak area increases of 11% and 4% for carbamazepine and sulfamethoxazole, respectively (Table 3).
Table 2. Statistical calculations demonstrate the reproducibility of carbamazepine and sulfamethoxazole detection in complex rat liver matrix.
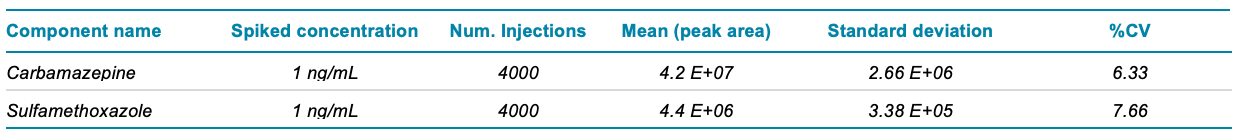
Table 3. Comparison of first 50 injections to last 50 injections does not reveal any signal drop over time.
Conclusions
The SCIEX 7500 system has demonstrated exceptional sensitivity compared to its QTRAP 6500+ system predecessor.1-4 In addition to sensitivity, an LC-MS/MS system needs demonstrable robustness to produce reproducible and reliable results in highly complex and challenging matrices over time. This study tested the robustness of the SCIEX 7500 system using 4,000 continuous injections of a rat liver homogenate. The results of this study indicated that the observed precision in peak area for 2 fortified pharmaceutical compounds was exceptional. The instrument was run continuously for multiple weeks, yet the %CV across all injections for both compounds was less than 8% and no significant change in signal from start to finish was observed. These data highlight the robustness of the SCIEX 7500 system and suggest that it can be deployed in laboratories requiring the collection of high-quality data from many biological, environmental or other challenging samples.
References
- Sensitivity gains for the evolution of routine bioanalysis. SCIEX technical note, RUO-MKT-02-11885-A.
- Ultra-high sensitivity quantification of veterinary drug residues in products of animal origin. SCIEX technical note, RUO-MKT-02-14259-A.
- High sensitivity MRM workflow for signature peptide quantification. SCIEX technical note, RUO-MKT-02-11882-A.
- Confident quantification of per- and polyfluoroalkyl substances within water intended for human consumption. SCIEX technical note, RUO-MKT-02-13414-B.