Holly Lee1, Simon Roberts2, Craig M. Butt2, Sam Lodge3, RenXi Ye4, Cora Young4 and Trevor VandenBoer4
1SCIEX, Canada; 2SCIEX, USA; 3Phenomenex, USA; 4York University, Canada
Simultaneous quantitation of ultrashort-, short- and long-chain PFAS in water by a single direct injection LC-MS/MS method
Abstract
This technical note describes a direct injection LC-MS/MS method for the simultaneous quantitation of ultrashort-, short-and long-chain per- and polyfluoroalkyl substances (PFAS). in water. Mixed-mode chromatography demonstrated robust retention and separation for the wide range of PFAS chain lengths tested. The sensitivity of the SCIEX 7500 system enabled in-sample limits of quantitation (LOQs) of 0.2–10 ng/L and method detection limits (MDLs) of 0.1–13 ng/L for most target analytes. TFA, PFBA, 5:3 and 7:3 FTCAs, and 6:2 and 8:2 diPAP required higher LOQs (10–100 ng/L) due to background contamination. Application of the method to tap water, rainwater and lake water revealed the predominance of TFA at sub-to-low µg/L levels (Figure 1).
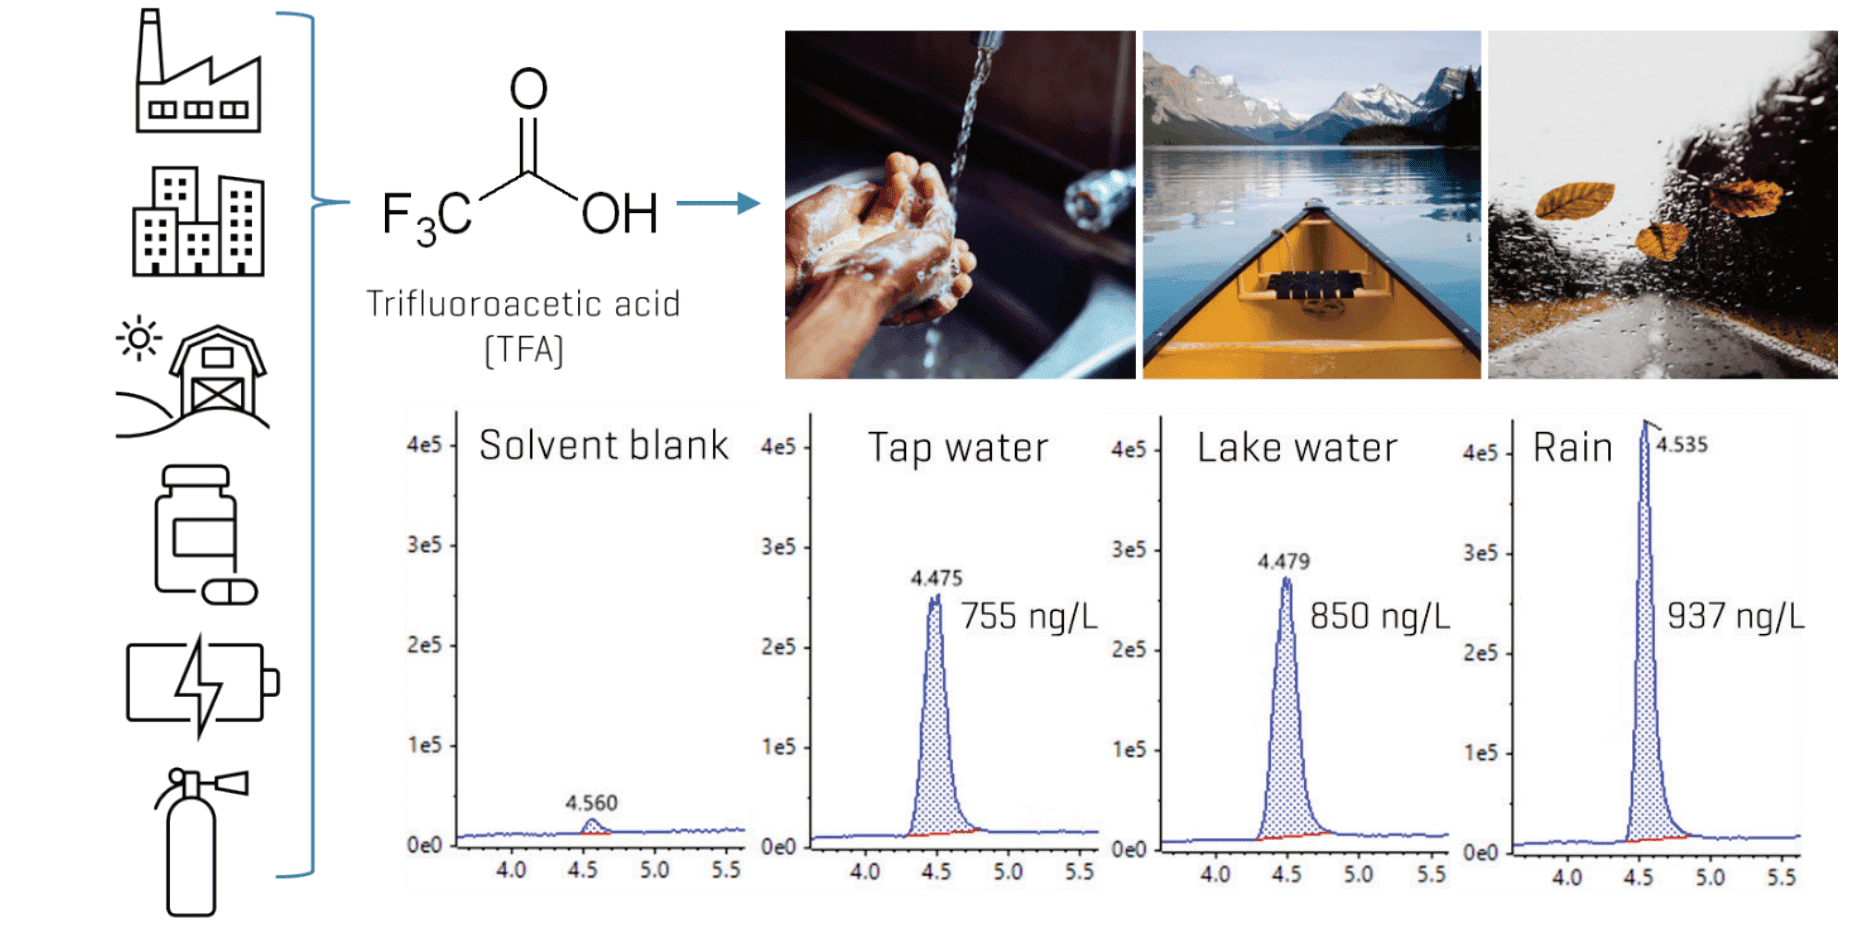
Figure 1. Quantitation of TFA in real-world aqueous matrices. Representative extracted ion chromatograms (XICs) of TFA demonstrate its ubiquity at sub-µg/L levels in tap water, surface water and rainwater
Methods
Chemical standards and samples: Native and isotopically-labeled standards were purchased from Wellington Laboratories and Cambridge Isotope Laboratories. Tap water, rainwater and lake water were collected from different regions around Ontario, Canada. After pre-screening solvents from different suppliers and chemical grades, LC-MS grade methanol and water were selected due to the lowest levels of PFAS observed.
Sample preparation: Each water sample was diluted 2-fold with methanol and spiked with isotopically-labeled internal standards at in-vial concentrations of 2–10 ng/L for a final vial composition of 50:50 (v/v) methanol/water.
Chromatography: Chromatographic separation was performed on a Shimadzu Prominence LC system using a Luna Omega PS C18 as the analytical column (150 x 2.1 mm, 3 µm, Phenomenex P/N: 00F-4758-AN). The delay configuration consisted of stacking a Luna Omega PS C18 column (50 x 3 mm, 3 µm, Phenomenex P/N: 00B-4758-Y0) and a Biozen Glycan column (100 x 2.1 mm, 2.6 µm, Phenomenex P/N: 00D-4773-AN) in series between the solvent mixer and the autosampler (Figure 2). A flow rate of 0.4 mL/min, an injection volume of 45 µL and a column temperature of 45o C were used. The LC gradient used is shown in Table 1.
Table 1: Chromatographic gradient for the analysis of ultrashort-, short and long-chain PFAS.
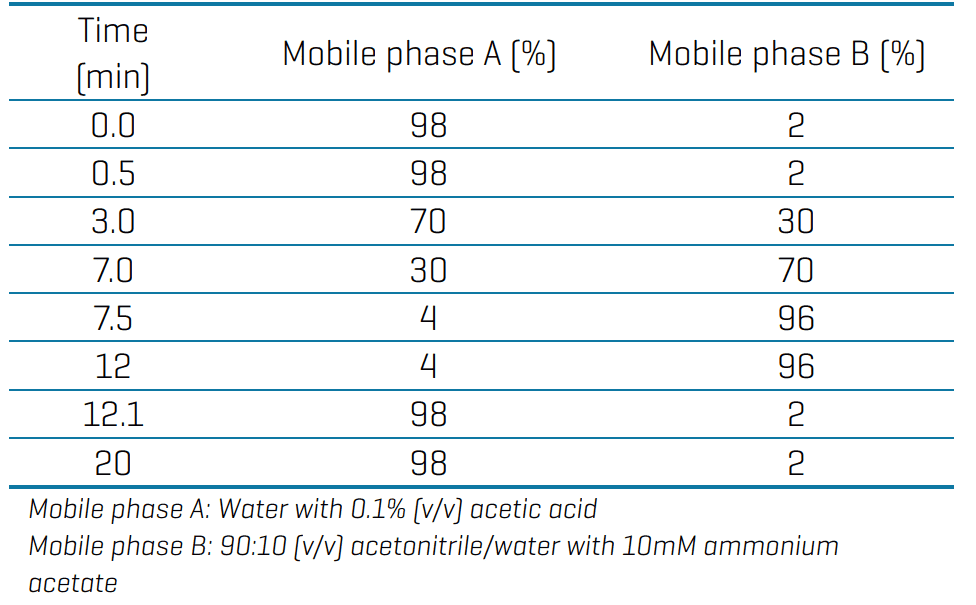
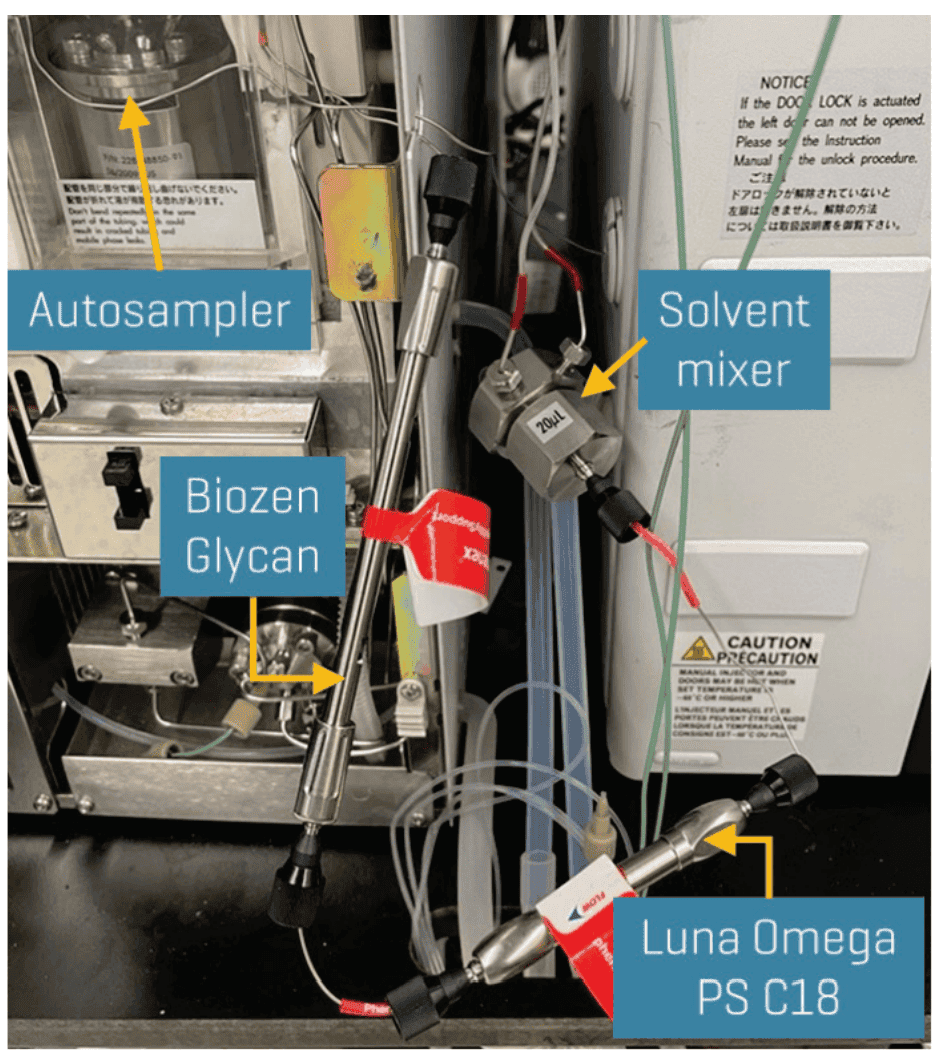
Figure 2. Setup of the 2-column delay configuration on the LC system. Separation of background PFAS contamination from the LC system was performed using a Luna Omega PS C18 column and a Biozen Glycan column stacked in series between the solvent mixer and the autosampler.
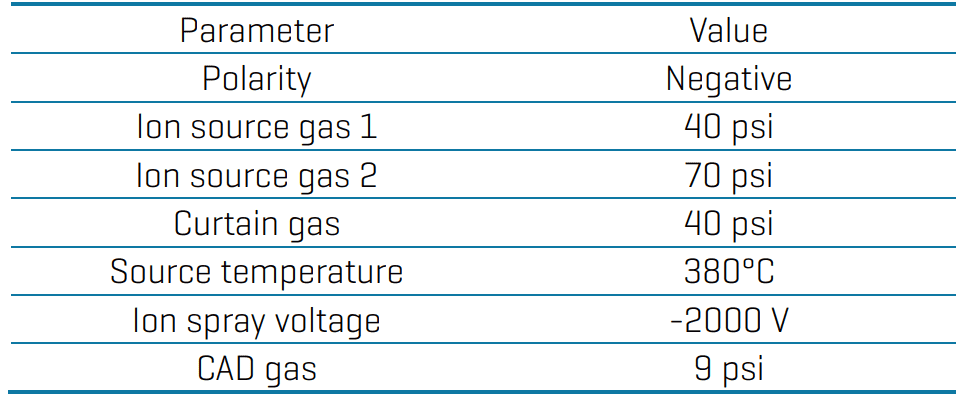
Mass spectrometry: Analysis was performed using negative electrospray ionization on the SCIEX 7500 system. Data was acquired by scheduled multiple reaction monitoring (sMRM) with optimized source and gas conditions (Table 2) and compound-dependent parameters (Appendix).
Table 2: Source and gas parameters for the analysis of ultrashort-, short and long-chain PFAS on the SCIEX 7500 system.
Data processing: Data acquisition and processing were performed using SCIEX OS software (version 3.4).
Chromatographic optimization
Due to their low molecular weights and high polarity, ultrashort-chain PFAAs are not well retained on most reverse-phased LC columns, often eluting close to or within the void region. This increases the risk of matrix effects from early eluting co-extractables. As such, extensive optimization of analytical and delay column selection, mobile phases and gradient was performed to ensure reproducible retention and adequate separation. After testing different stationary phases and column dimensions, a 150 x 2.1 mm, 3 µm Luna Omega PS C18 column was selected. This column contains a positively charged surface alongside C18 functionalization, which promotes mixed-mode retention of acidic and hydrophobic compounds. Adding acetic acid to the mobile phase also increased the retention of the ultrashort-chain PFAAs (>4.5 minutes). Improved retention of TFA, PFPrA and PFBA was also reported on a C18 column upon adding formic acid to the mobile phase, which was attributed to enhanced reverse-phase interactions with protonated silanolate groups on the stationary phase.9 Alternatively, protonation of the PFAAs by the acidic pH may have also contributed to their enhanced retention. Figure 3 demonstrates the excellent separation of the earliest eluting ultrashort-chain PFAAs from the void region.
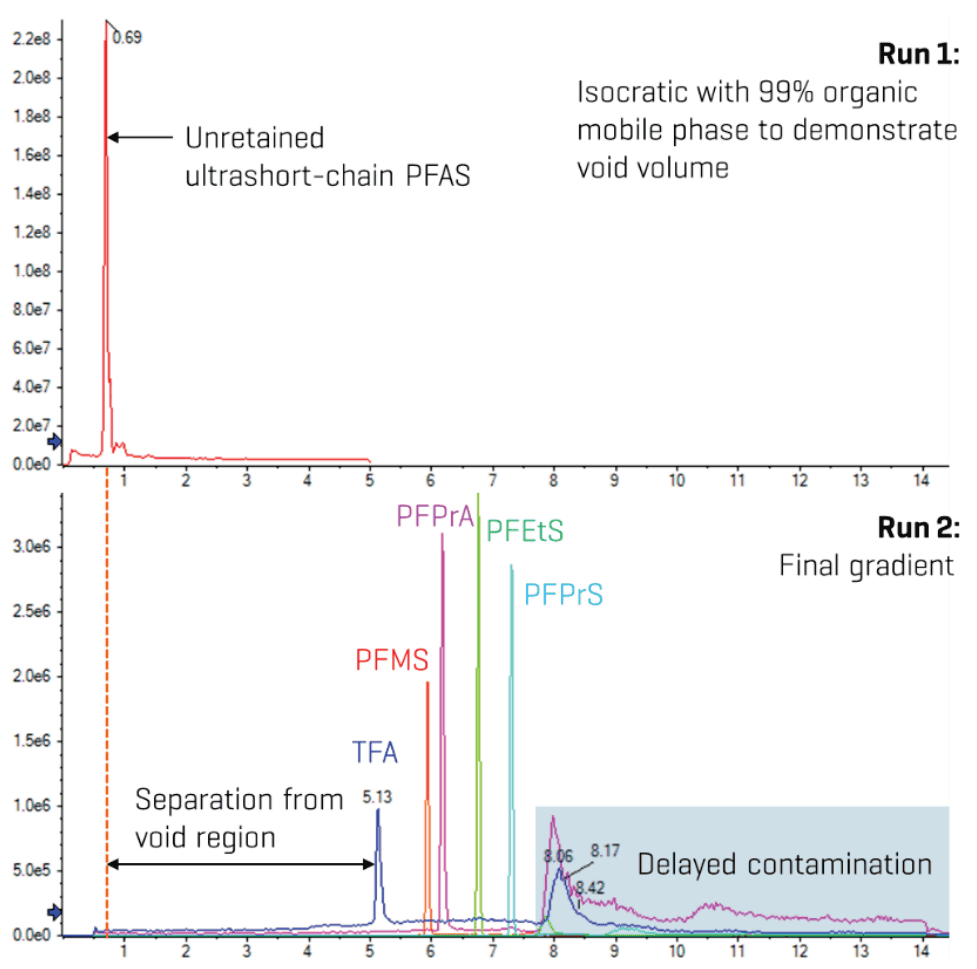
Figure 3. Separation of ultrashort-chain PFAS from the void region. The initial peaks at <1 min in the top XIC represent the unretained ultrashort-chain PFAS under an isocratic run with 99% organic mobile phase. Comparison against the final gradient demonstrated excellent separation of the ultrashort-chain PFAS from the void region of the analytical column.
Figure 4 shows the overall chromatographic separation of all target analytes, demonstrating the method’s extensibility to PFAAs with chain lengths as long as 17 CF and other PFAS classes. While not important for the aqueous matrices tested here, the gradient also exhibited >1 minute of separation between perfluorooctane sulfonate (PFOS) and the 3 known bile acid interferences, indicating broad applicability to biological and food matrices and compliance with EPA Method 1633A.
Figure 5 also demonstrates reproducible RTs (%CV <1%) of the ultrashort-chain PFAAs over a 2.5-day batch that consisted of >170 injections of solvent blanks, standards, matrix spikes and real-world environmental water samples.
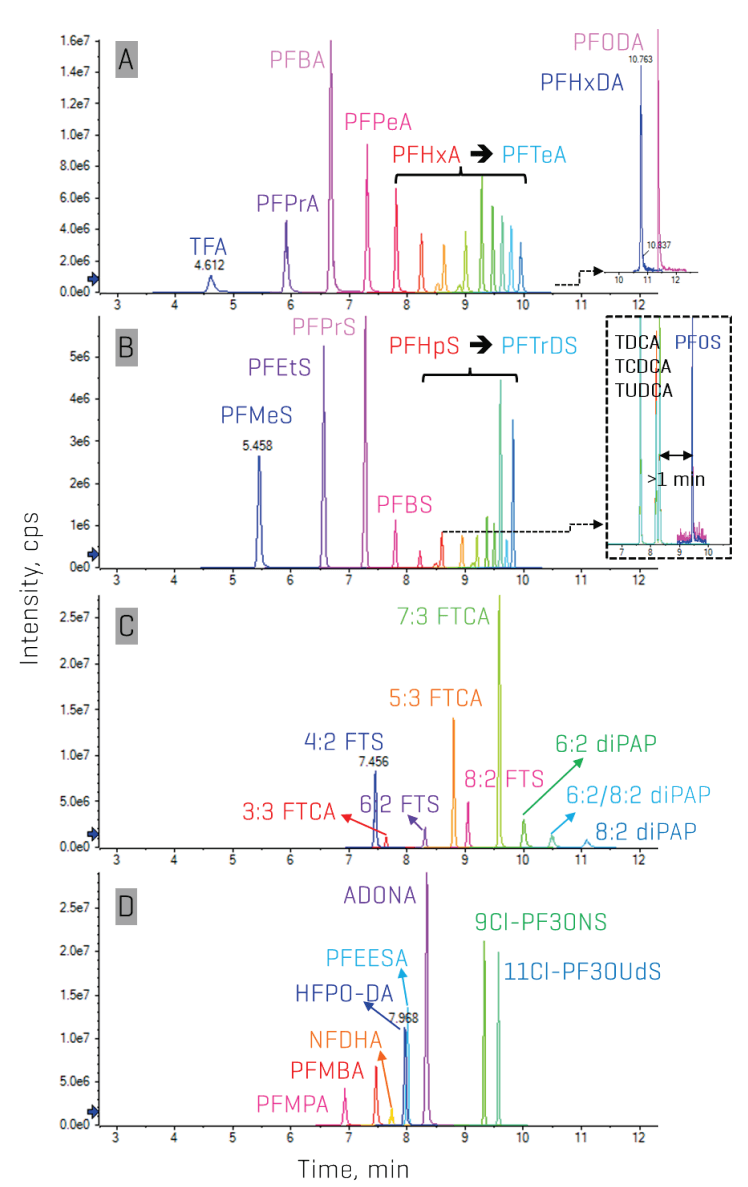
Figure 4. Chromatographic separation of the target PFAS using the Luna Omega PS C18 column on the SCIEX 7500 system. The top 2 panels show the XICs for the full range of A) perfluorocarboxylic acids (PFCAs, 1–17 CF) and B) perfluoroalkane sulfonates (PFSAs, 1–13 CF) monitored. Although perfluorohexadecanoic acid (PFHxDA) and PFODA were not quantified here, the gradient is capable of their inclusion. Panels C and D demonstrate the gradient’s capability to chromatographically separate other commonly monitored PFAS as well as several novel analytes such as the polyfluoroalkyl phosphate diesters (diPAPs).
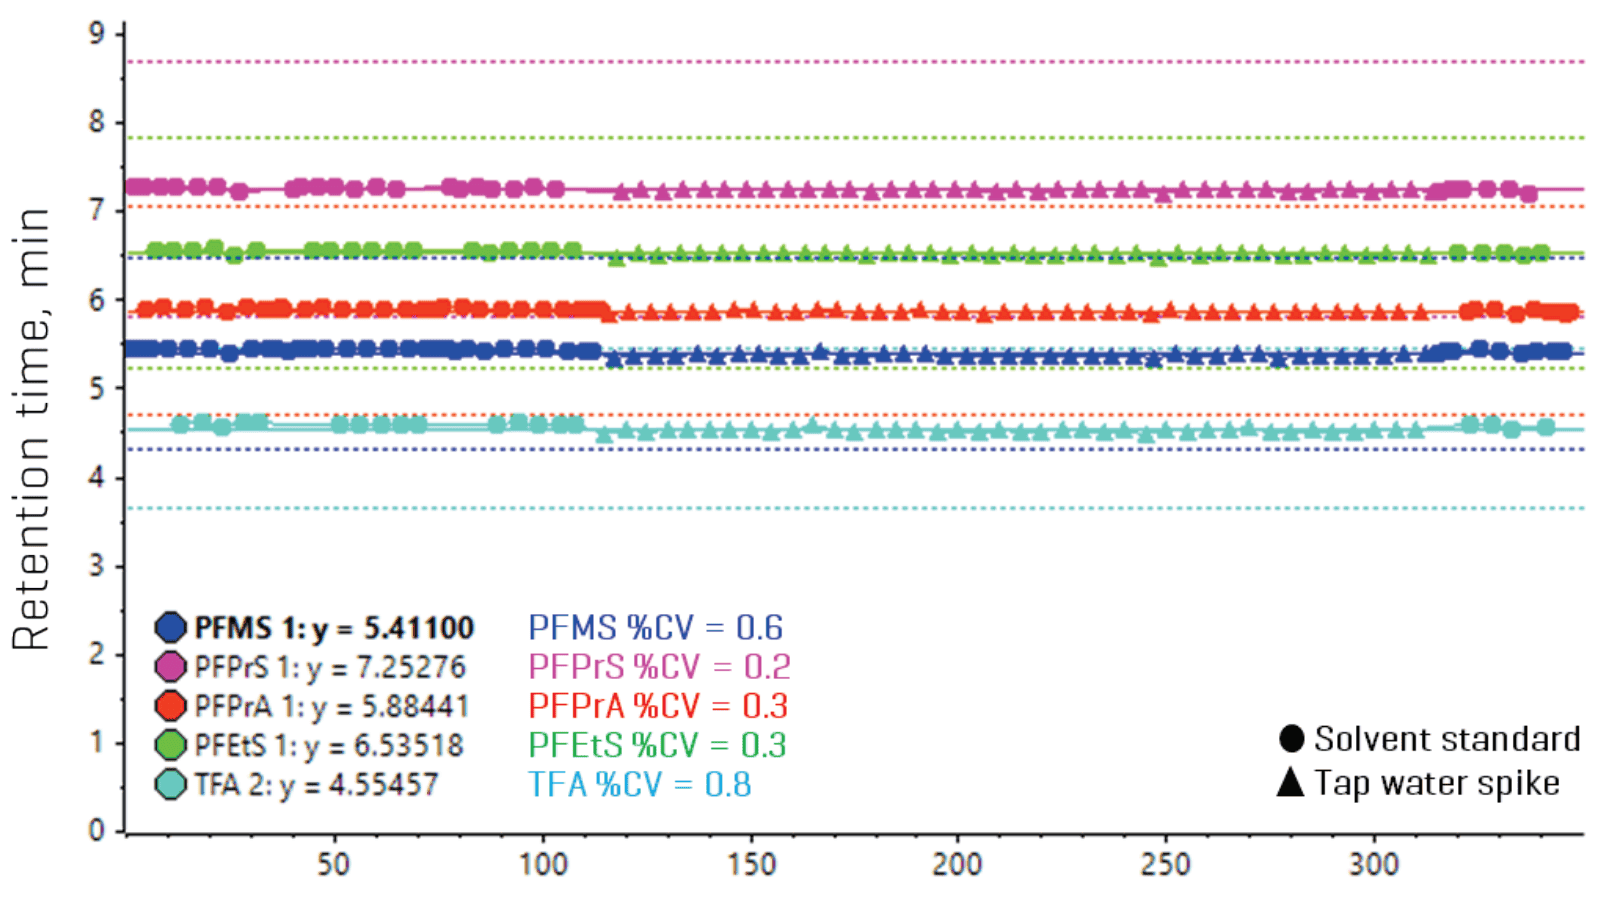
Figure 5. Metric plots in SCIEX OS software of retention times (RTs) for the ultrashort-chain PFAAs. Excellent RT reproducibility (%CV <1%) was demonstrated throughout a long batch comprised of >170 injections of solvent blanks, standards, spikes and 15 different real-world water samples.
Measures to minimize background contamination
Installation of a delay column helps to separate the PFAS contamination present in the mobile phases and fluorinated components of the LC system from the target analyte peak. Here, a dual-column configuration using a C18 and a HILIC column provided adequate separation of the contaminant peak from the target analyte peaks for the wide range of PFAA chain lengths tested (Figures 2 and 6). This ensures a cleaner baseline for more consistent peak integration and reproducible data quality, especially at the LOQ levels.
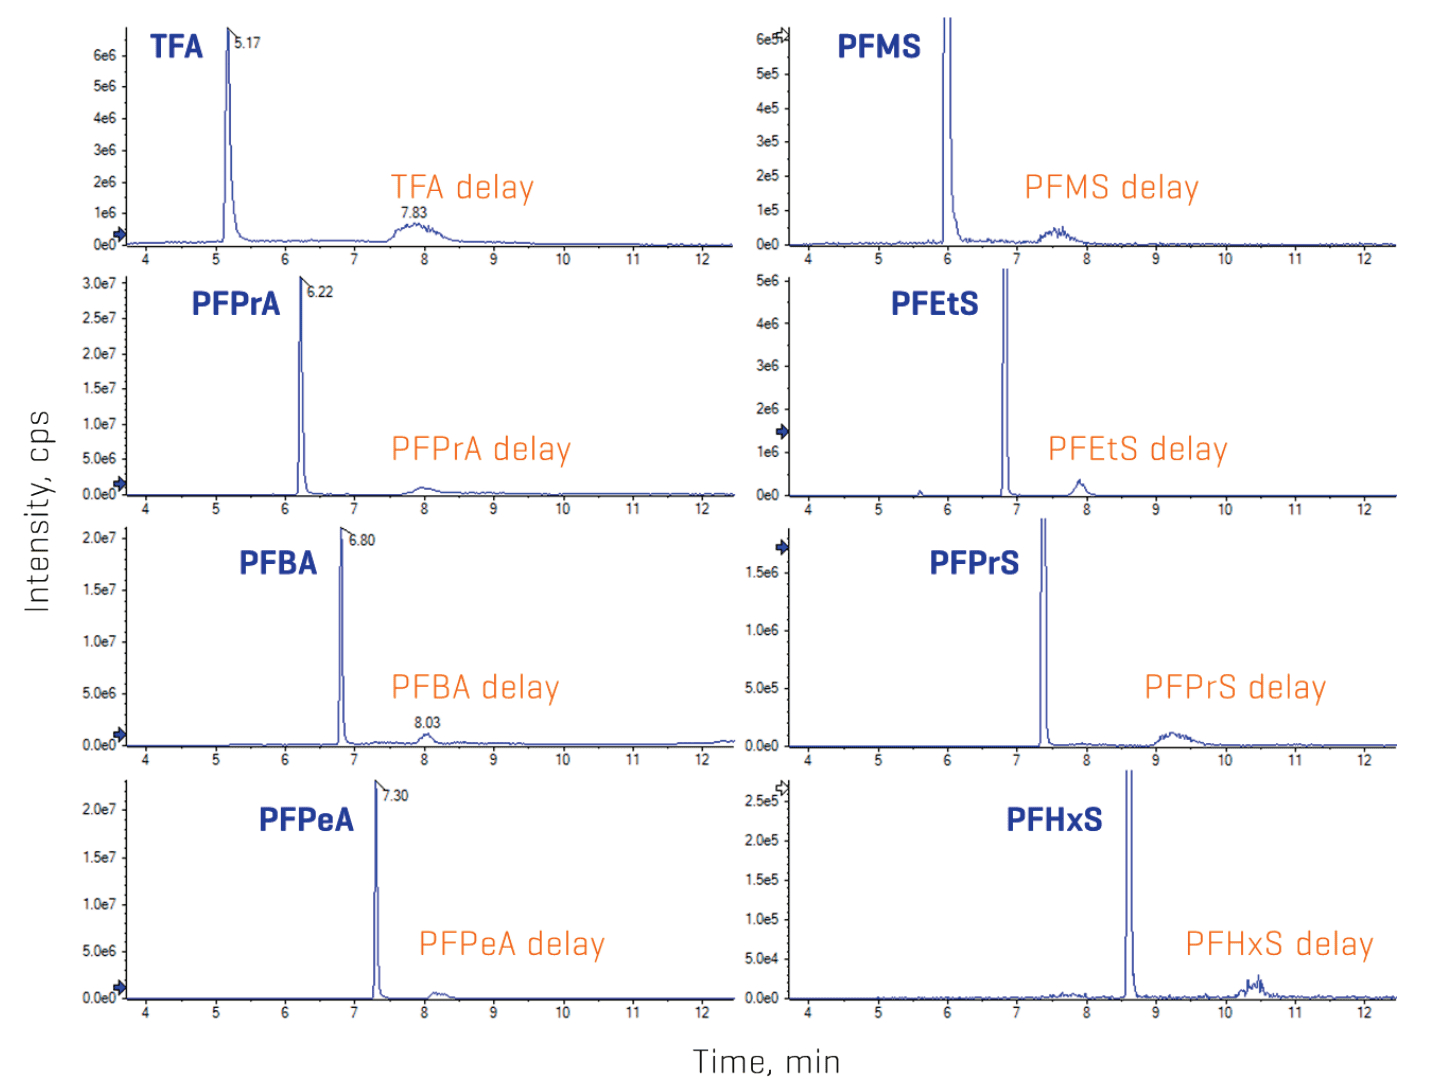
Figure 6. Chromatographic delayed separation between the target PFAS and LC system contamination. A dual delay column configuration was used due to the wide range of PFAS chain lengths in the panel. Representative XICs show sufficient separation between the delayed PFAS contamination and the target analytes.
Figure 6. Chromatographic delayed separation between the target PFAS and LC system contamination. A dual delay column configuration was used due to the wide range of PFAS chain lengths in the panel. Representative XICs show sufficient separation between the delayed PFAS contamination and the target analytes.
Additional LC modifications included replacing fluoropolymer components with PEEK and rerouting the mobile phase and autosampler rinse solvent tubing to bypass the degasser. Pre-screening solvents and lab consumables also ensured that the materials with the lowest contamination levels were used. Figure 7 compares the observed levels of TFA, PFBA and PFHxA in different pipet tips, different purity-grade solvents, different solvent brands and the impact of pre-cleaning water with solid-phase extraction (SPE). Pipet tips without the “low binding” or “low retention” labels and LC-MS grade solvents generally exhibited lower levels, although improper or prolonged storage of the latter may eventually result in contamination, as was observed for lot 2 of the LC-MS grade methanol in Figure 7. While SPE has previously been used to remove PFAS from water, this approach introduced even more contamination, especially for TFA, PFBA and 6:2 diPAP.
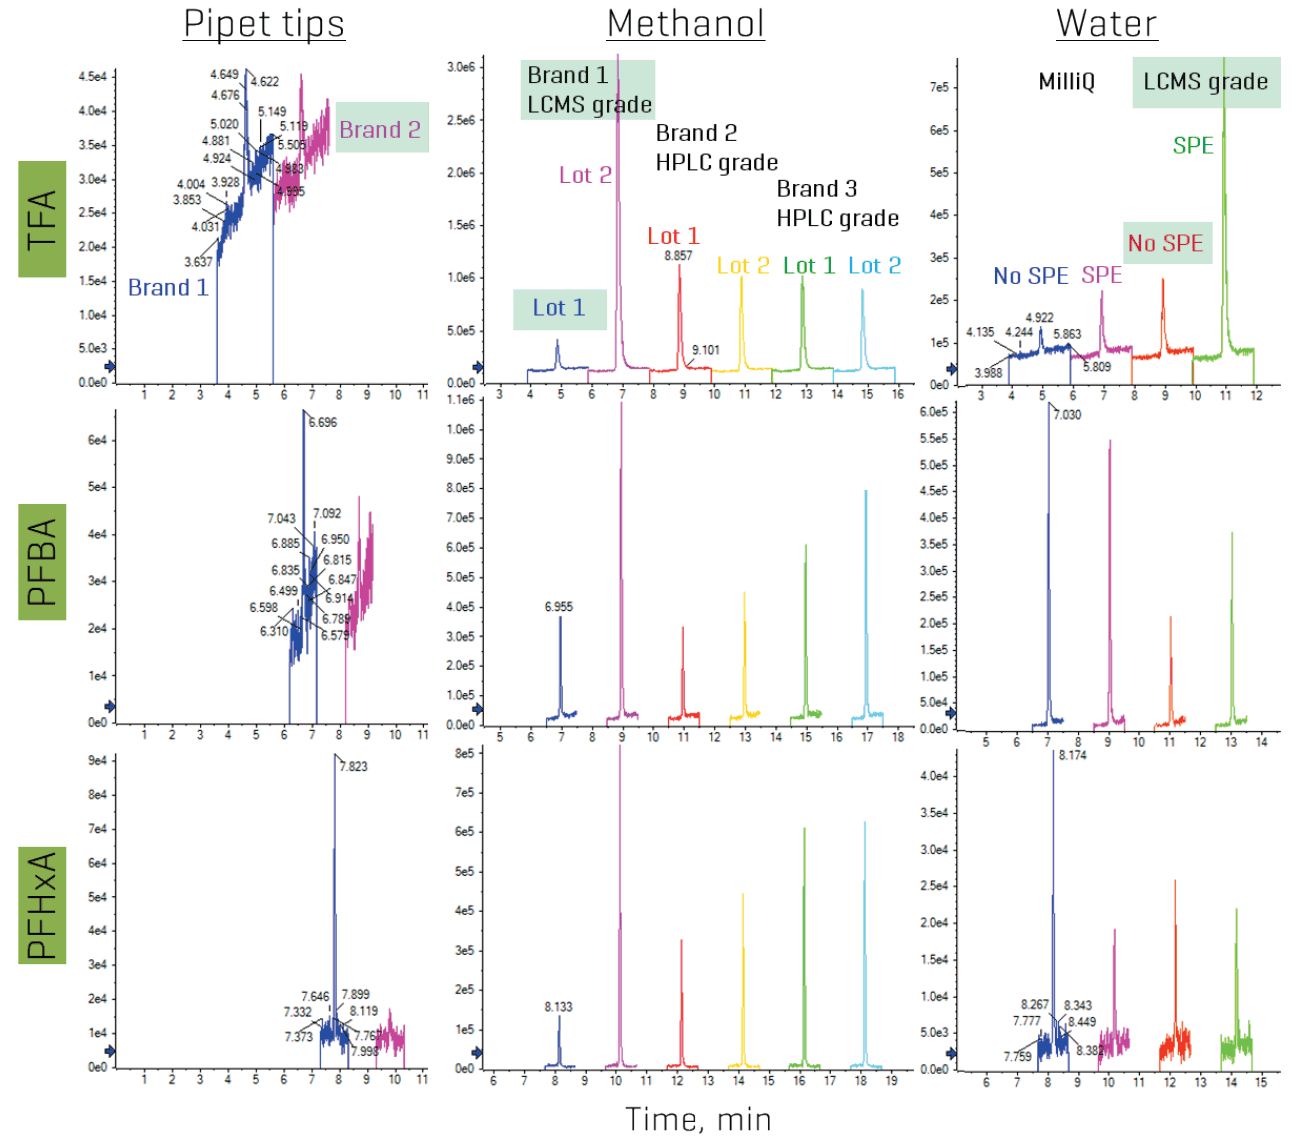
Figure 7. Background contamination of TFA, PFBA and PFHxA in pre-screened consumables and solvents. Different brands of pipet tips and solvents and different lots from the same brand were pre-screened to evaluate the PFAS background levels PFAS. The use of SPE was also tested for pre-cleaning water prior to use. The conditions highlighted in green were those selected for the final optimized method. Chromatographic offset was applied to separate each XIC for better visibility
Quantitative performance of the solvent-based calibration standards
Due to the varying sensitivity expected from the diverse panel of PFAS, initial calibration curves spanning 17 concentration levels were analyzed to determine the calibration range. The SCIEX OS software can automatically remove outliers based on user-defined tolerances on regression coefficient, accuracy and precision of calibration standards (Figure 8). This feature expedites the finalization of the calibration range by reducing the amount of manual review.
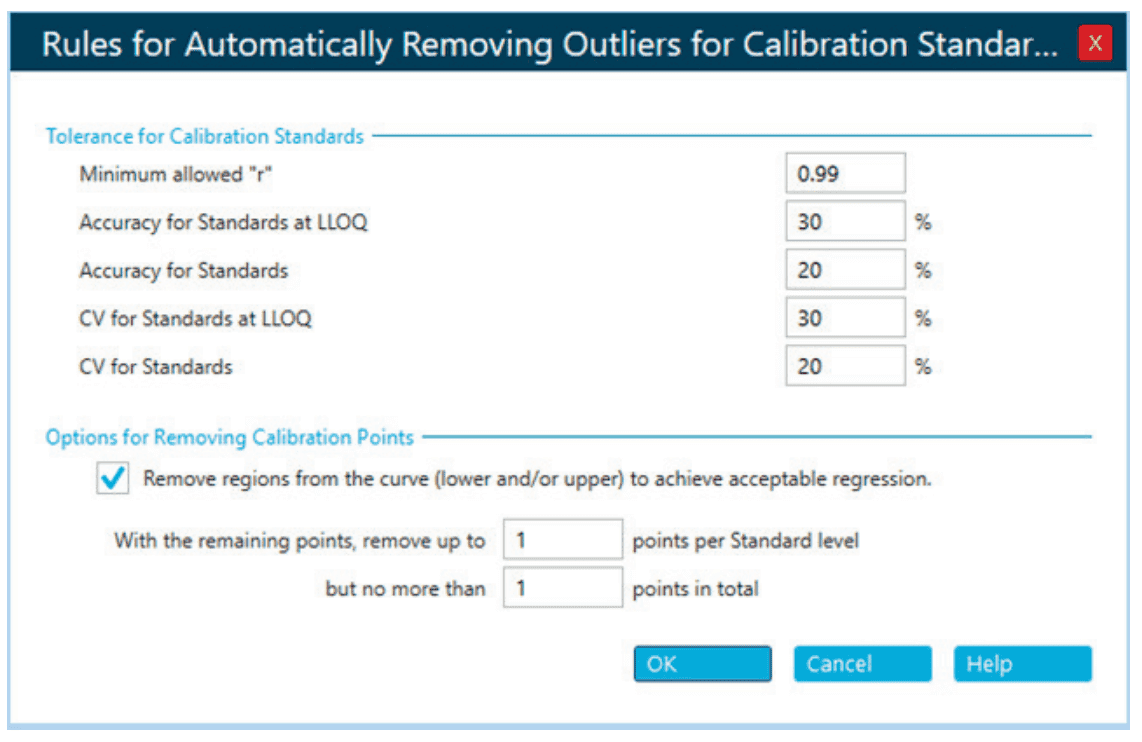
Figure 8. Automatic outlier removal settings in processing method editor of SCIEX OS software. User-defined acceptance criteria for r, accuracy and %CV of calibration standards instruct the software algorithm for automatic removal of outliers from the calibration curve.
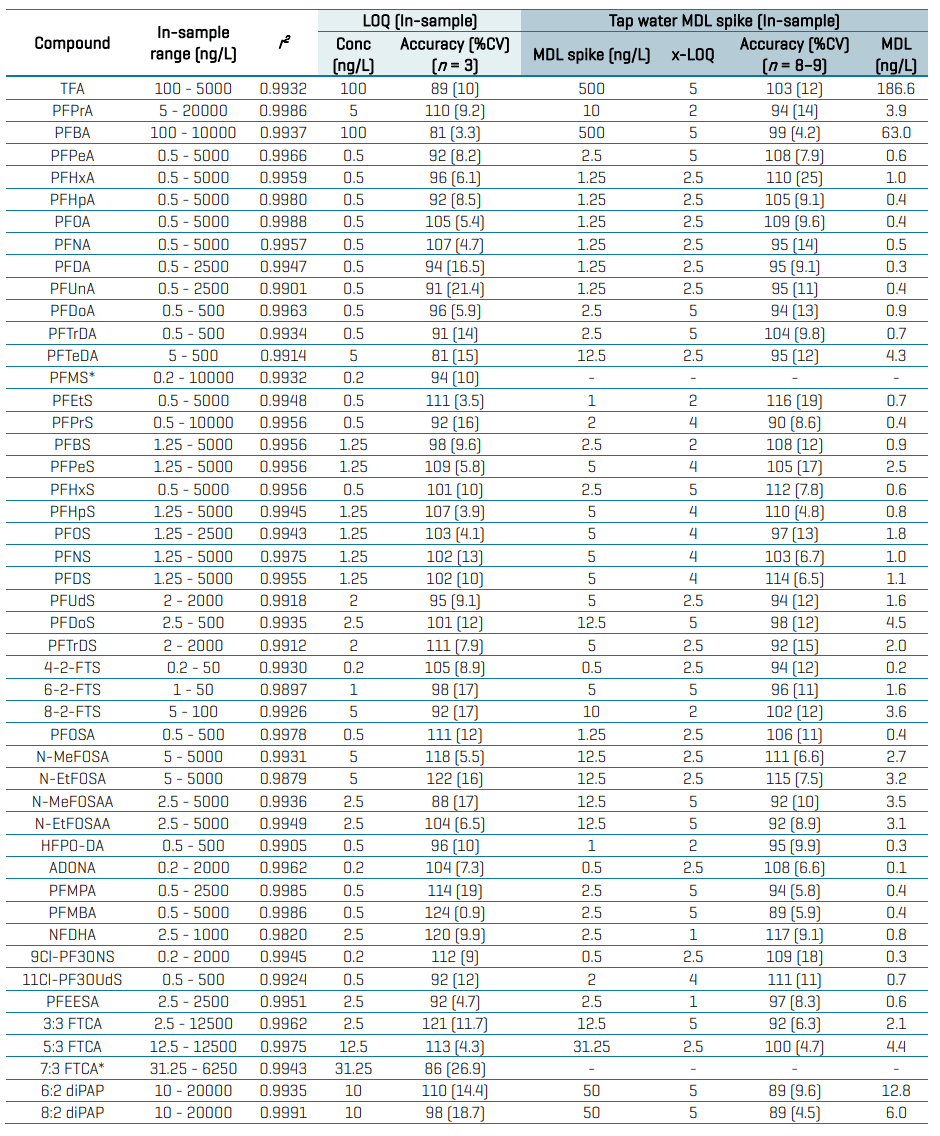
Table 3 summarizes the overall quantitative performance of the SCIEX 7500 system based on triplicate injections of the solvent-based calibration standards. Linear regression of r2 ≥0.99 was achieved for most analytes. The LOQ selection was based on the quantifier transition achieving a signal-to-noise (S/N) ratio ≥10, accuracy within ±30%, %CV of <30% and ion ratio tolerance of ±30%. In-sample LOQs ranged from 0.2 ng/L to 10 ng/L, except for several analytes whose LOQs were compromised by high blank levels. Despite the extensive measures taken to reduce contamination, Figure 7 still shows the presence of residual background originating from the solvents used to prepare the diluent and likely other sources. This resulted in the selection of higher LOQs of 30–100 ng/L for TFA, PFBA and 7:3 FTCA. Overall, acceptable accuracies within ±30% and %CV <30% were achieved at the LOQ level, while accuracies within ±25% and %CV <20% were achieved at all other levels for most analytes.
Table 3: Quantitative performance of the solvent calibration standards and tap water spikes at the MDL. All analytes are listed with their in-sample calibration range, linear regression coefficient (r 2 ), accuracy and precision at the in-sample LOQs and MDL tap water spikes prepared at 1–5x of LOQ.
Quantitative performance in tap water spikes
Table 3 also summarizes the quantitative performance in tap water spiked at near-LOQ levels. Replicates of tap water spiked at 1–5x of the in-vial solvent LOQs were used to calculate the MDL. The MDL is defined as the lowest measured concentration of an analyte that can be measured with 99% confidence as distinguishable from the method blanks.11 The MDL was calculated by multiplying the standard deviation from 8–9 replicates by the corresponding t-value at the 99% confidence level, as follows:

Background subtraction was applied to correct for the presence of any target PFAS present in the unspiked tap water. Overall, recoveries within ±30% of the nominally spiked concentration and %CV <25% were achieved in the MDL spikes. The calculated MDLs ranged from 0.1 ng/L to 13 ng/L for most analytes and from 63 ng/L to 190 ng/L for TFA and PFBA (Table 3). MDL determination was not performed for PFMS and 7:3 FTCA, because their concentrations in the unspiked tap water were too high to allow for spiking within 1–5x of their solvent LOQs.
Tap water spikes were also performed at a mid (5–500 ng/L) and high (10–5000 ng/L) spike level, as shown in Figure 8. Overall, most of the target PFAS compounds showed excellent recovery (±20%) and precision (%CV <20%) at the higher spiking levels, demonstrating excellent quantitative method performance.
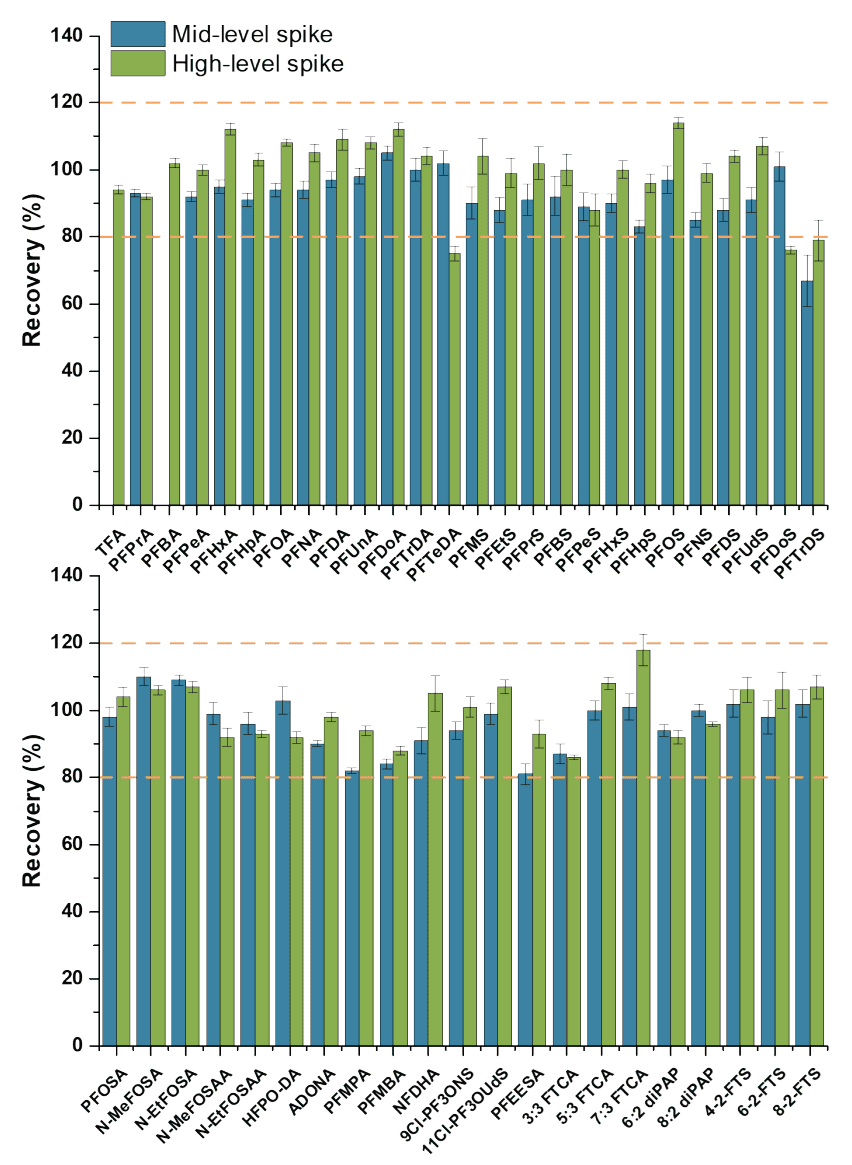
Figure 8. Recoveries in tap water matrix spiked at mid-to-higher levels above the MDL. The blue and green bars represent the recoveries obtained at a mid (5–500 ng/L) and high (10–5000 ng/L) spike level in-sample, respectively. Each bar represents the mean recovery of 8–9 replicate spikes with error bars representing the standard error of the mean. The dotted orange lines represent the ±20% tolerance on recovery.
PFAS quantitation in different aqueous matrices
The method applicability was tested in tap water and rainwater from the Toronto region and surface water from a river and 2 lakes in Ontario. Overall, the PFAA distribution exhibited a predominance of ultrashort- and short-chain compounds, with TFA accounting for the majority of the fluorochemical burden observed (Figure 9). Concentrations of TFA ranged from 250 ng/L to >2000 ng/L, with the highest levels observed in the lake and river water. A similar distribution was also observed for PFPrA, but at concentrations at least an order of magnitude lower than TFA. Environmental data on the ultrashort-chain perfluoroalkane sulfonic acids (PFSAs) are relatively scarce, with limited reporting of PFMS, PFEtS and PFPrS near sources like firefighting training facilities, landfills and hazardous waste facilities.1 Here, PFMS was detected as the predominant PFSA at sub-to-low ng/L levels, with higher levels (13–18 ng/L) observed in tap water.
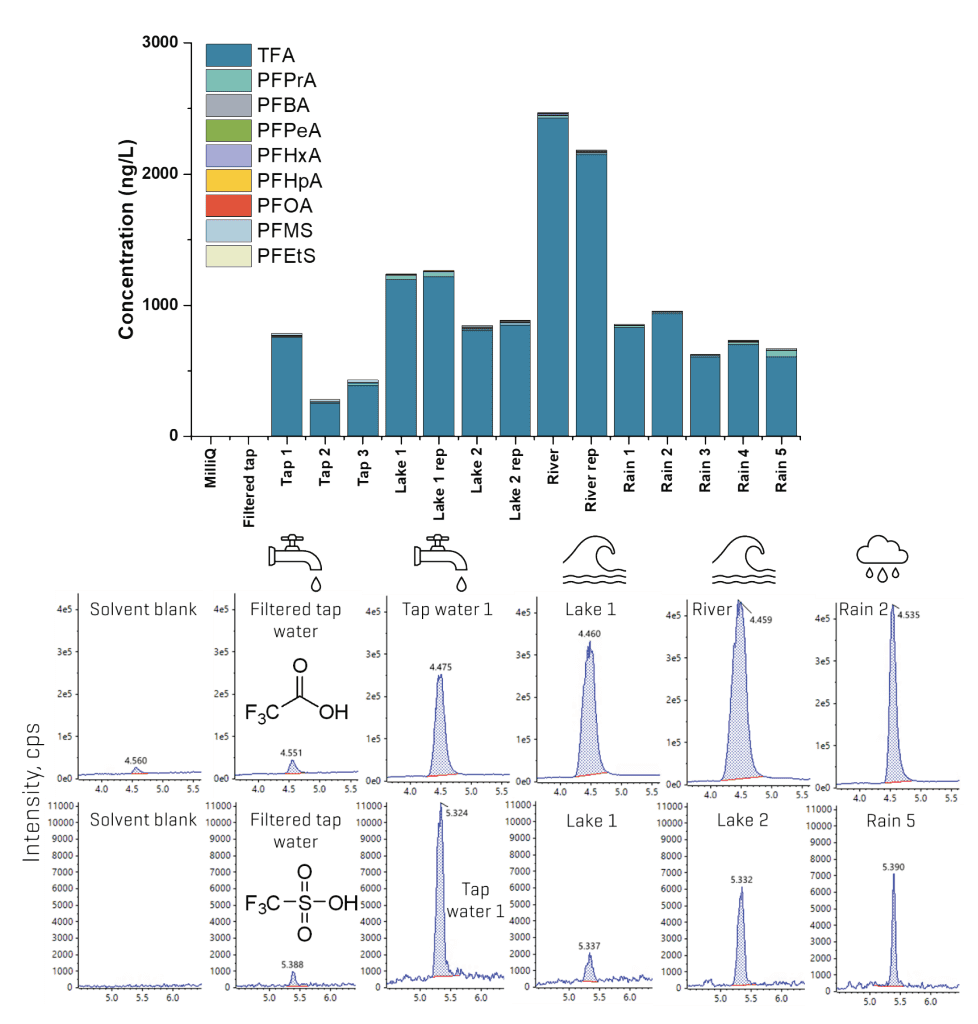
Figure 9. Detection of ultrashort-, short- and long-chain PFAAs in aqueous matrices. The top panel shows the distribution of PFAAs detected in the different water samples, while the bottom panel shows representative XICs of the quantifier transition of TFA and PFMS in 5 example aqueous matrices compared against the solvent blank. Detection was also confirmed by the qualifier transitions of the analytes.
Appendix
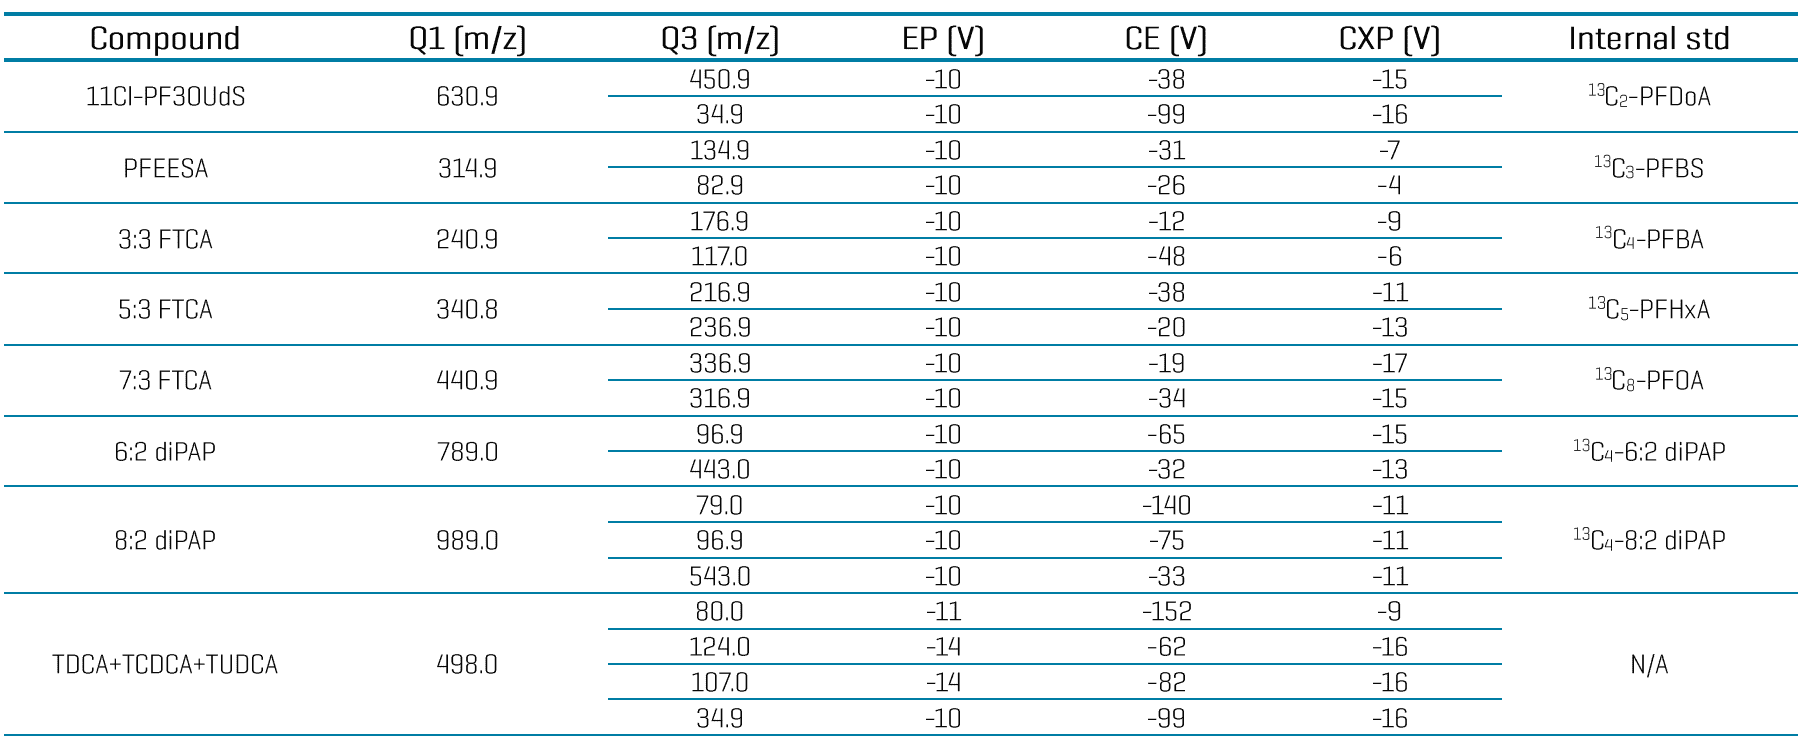
Table 4: Compound-specific MRM parameters and internal standard assignment for PFAS analysis in water using the SCIEX 7500 system.
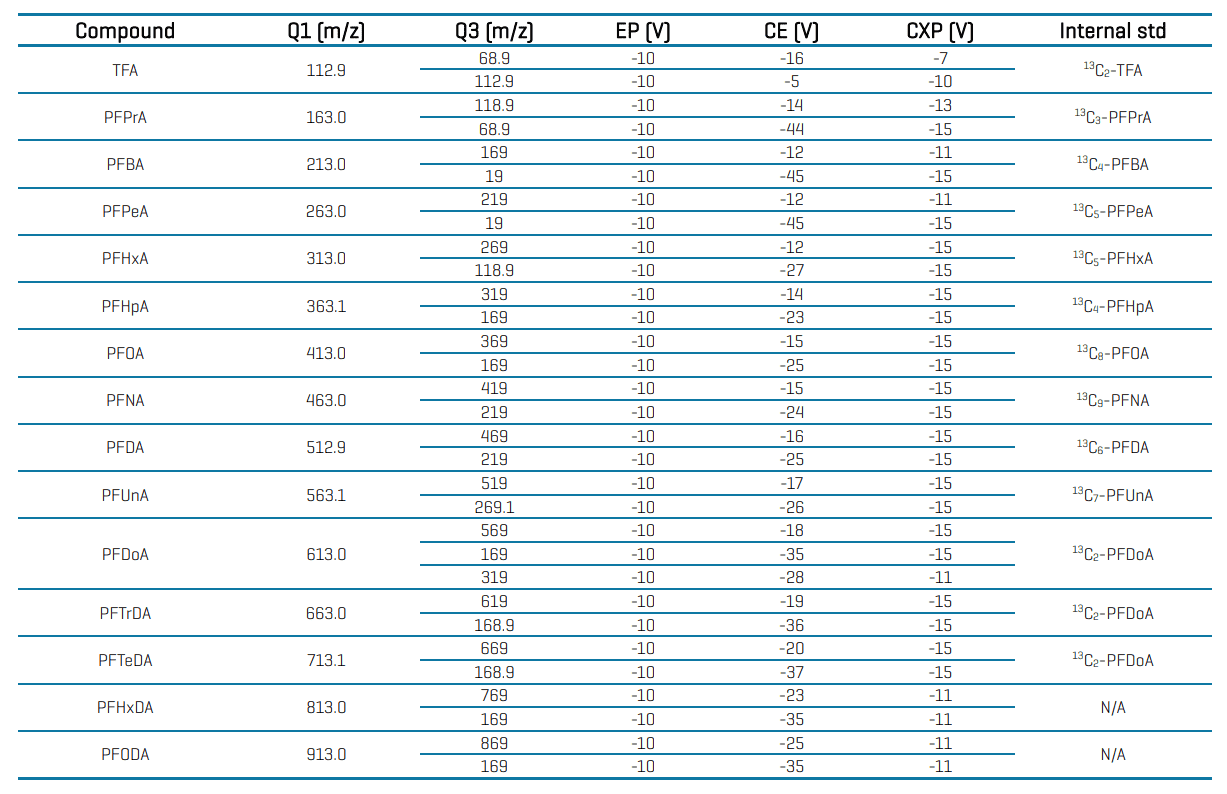
Table 4 (cont’d): Compound-specific MRM parameters and internal standard assignment for PFAS analysis in water using the SCIEX 7500 system.
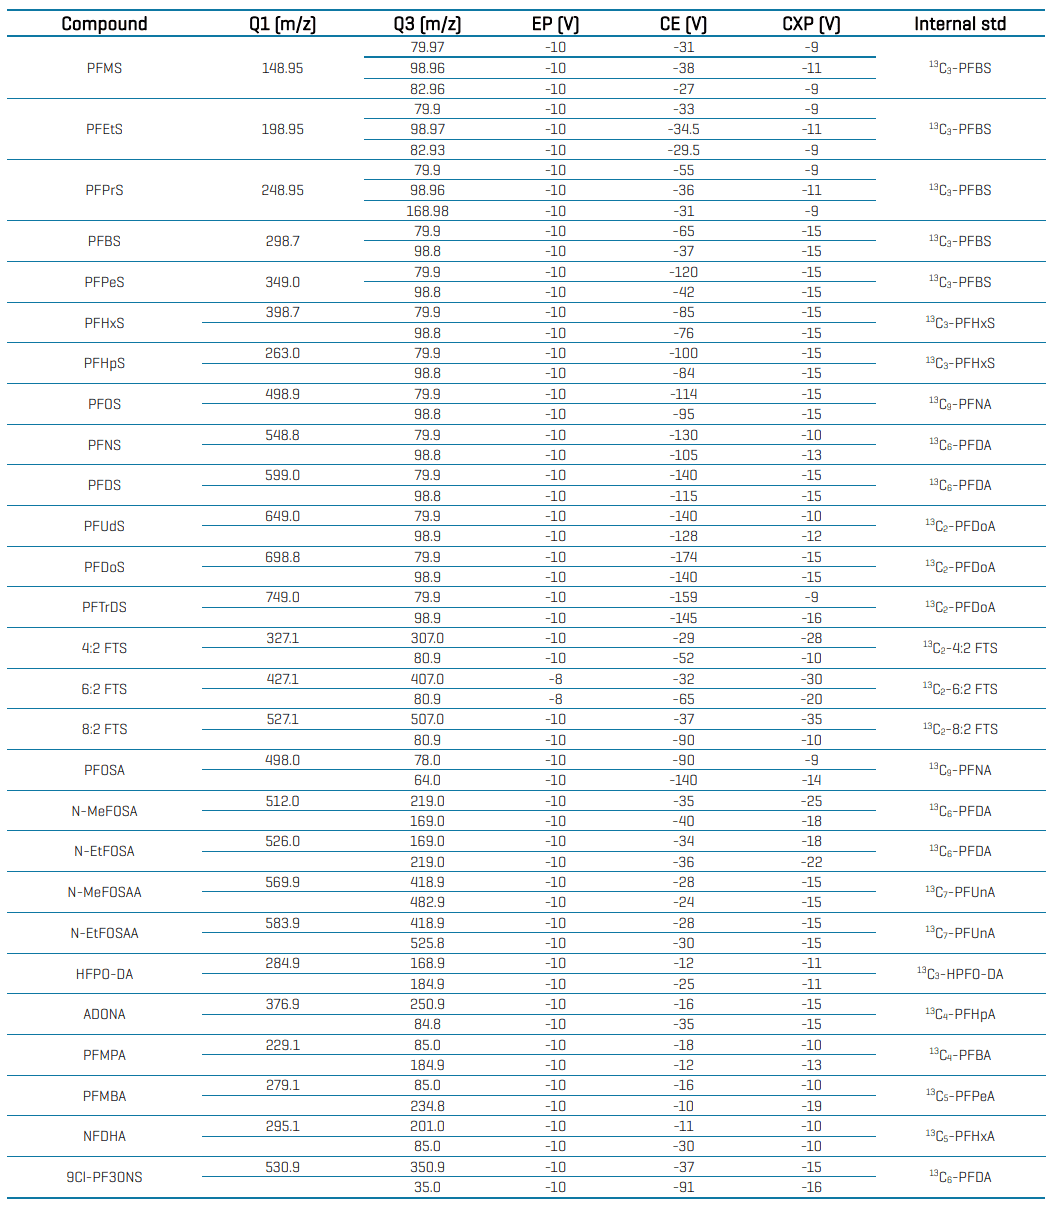
Table 4 (cont’d): Compound-specific MRM parameters and internal standard assignment for PFAS analysis in water using the SCIEX 7500 system.