Scott Mack, Haichuan Liu and Zoe Zhang
SCIEX USA
Effortless icIEF-UV/MS to LC-MS switching for comprehensive biotherapeutic characterization
Abstract
The combined capabilities of imaged capillary isoelectric focusing (icIEF)-UV/MS and electron-activated dissociation (EAD)-based LC-MS workflows on a single MS system offer a rapid and flexible solution to multi-level characterization of biotherapeutics and charge variants.1-3 This technical note describes a streamlined process of alternating between icIEF-UV/MS and LC-MS instrument configurations to achieve rapid charge heterogeneity and peptide mapping analyses. The icIEF-UV/MS and LC-MS results obtained before and after the configuration change are highly consistent, instilling confidence in leveraging these 2 orthogonal separation approaches for comprehensive biotherapeutic characterization (Figure 1).
Comprehensive characterization of biotherapeutics and charge variants is vital to ensuring the quality, safety and efficacy of these drug molecules throughout their development cycles.4 Traditionally, achieving in-depth charge heterogeneity analysis and biotherapeutic characterization requires investment in separate icIEF and LC-MS instrumentation and personnel with different skill sets. However, elucidating complex charge profiles and identifying the proteoforms associated with each charge variant peak using conventional icIEF approaches or ambiguous fraction collection methods is challenging. icIEF fractionation followed by off-line MS analysis is labor-intensive, often taking weeks to complete. Furthermore, LC-MS instruments equipped only with collision-based MS/MS techniques struggle with the localization of labile post-translational modifications (PTMs) and differentiation of amino acid isomers.
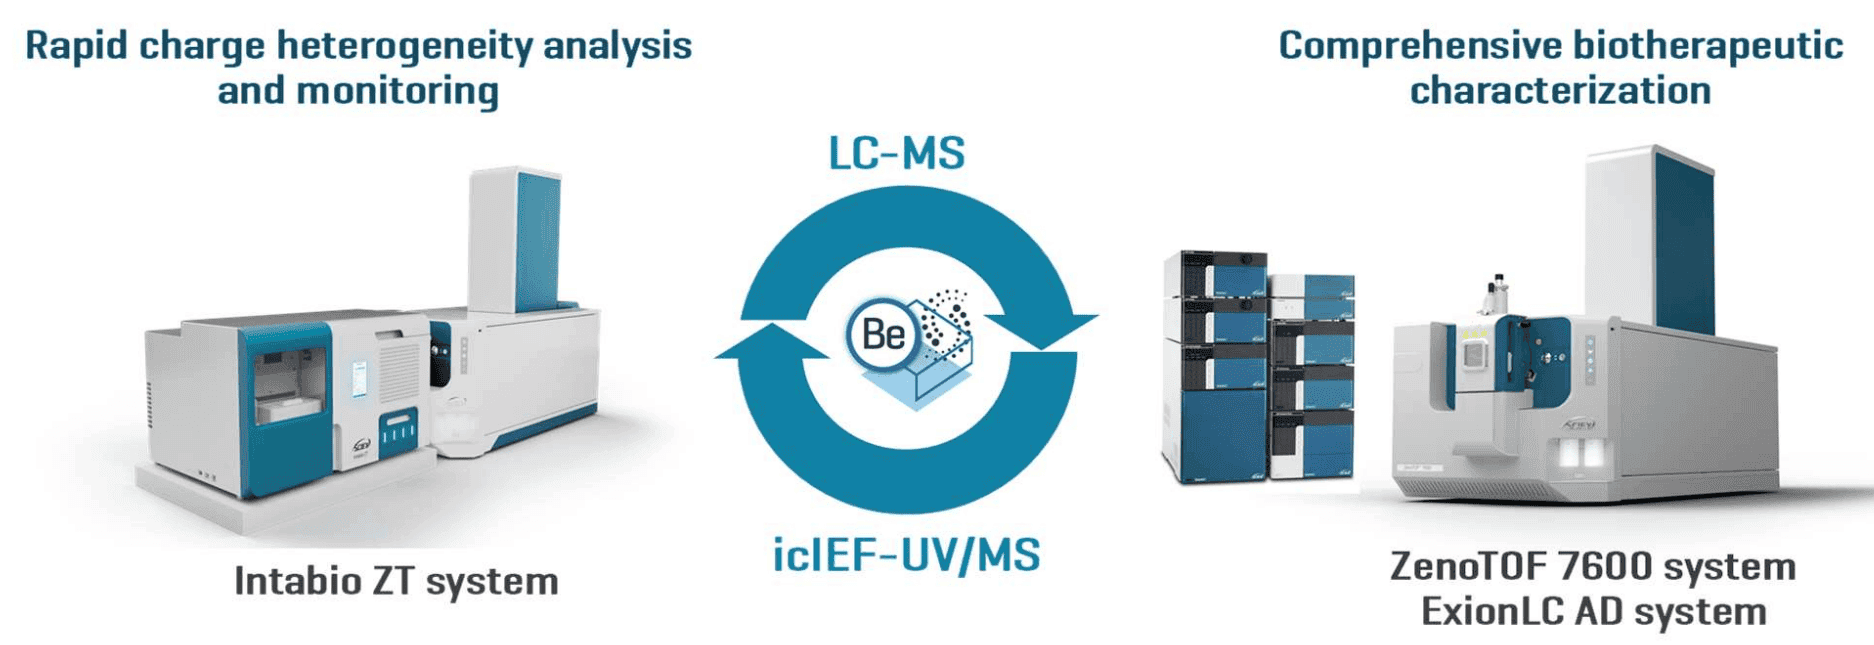
Figure 1. The ease of switching between the icIEF-UV/MS and LC-MS configurations on a single MS system allows rapid charge heterogeneity analysis and comprehensive biotherapeutic characterization. The ZenoTOF 7600 system coupled with an Intabio ZT system (left) provides powerful icIEF-UV/MS capabilities for high-resolution separation, sensitive detection, confident identification and rapid monitoring of biotherapeutic charge variants. Coupling the ZenoTOF 7600 system with an ExionLC AD system (right) enables the access to a full suite of LC-MS workflows, such as EAD-based peptide mapping and middle-down MS, offering comprehensive biotherapeutic characterization for sequence confirmation, PTM localization, disulfide bond mapping and isomer differentiation. The icIEF-UV/MS and LC-MS data can be interpreted using a single software package-Biologics Explorer software (middle).
Methods
Sample preparation: NISTmAb (RM 8671, NIST) was desalted and then mixed with the master mix solution containing arginine, pharmalyte 5 to 8 (Cytiva), pharmalyte 8 to 10.5 and 6.0 µg/mL peptide pI markers. The solution was vortexed and degassed by centrifugation prior to intact mass analysis using icIEF-UV/MS. For peptide mapping analysis, NISTmAb was denatured using guanidine hydrochloride, reduced with dithiothreitol and alkylated by iodoacetamide, followed by trypsin digestion using the trypsin/Lys-C protease (Promega).
icIEF-UV/MS: NISTmAb sample was separated with an Intabio cartridge (SCIEX) installed on the Intabio ZT system (SCIEX). UV absorbance measurements were collected at 1 Hz during the focusing and mobilization steps. The samples were introduced into the ZenoTOF 7600 system by a metered 3 µL/min flow of chemical mobilizer. The data of 6 replicate injections were acquired.
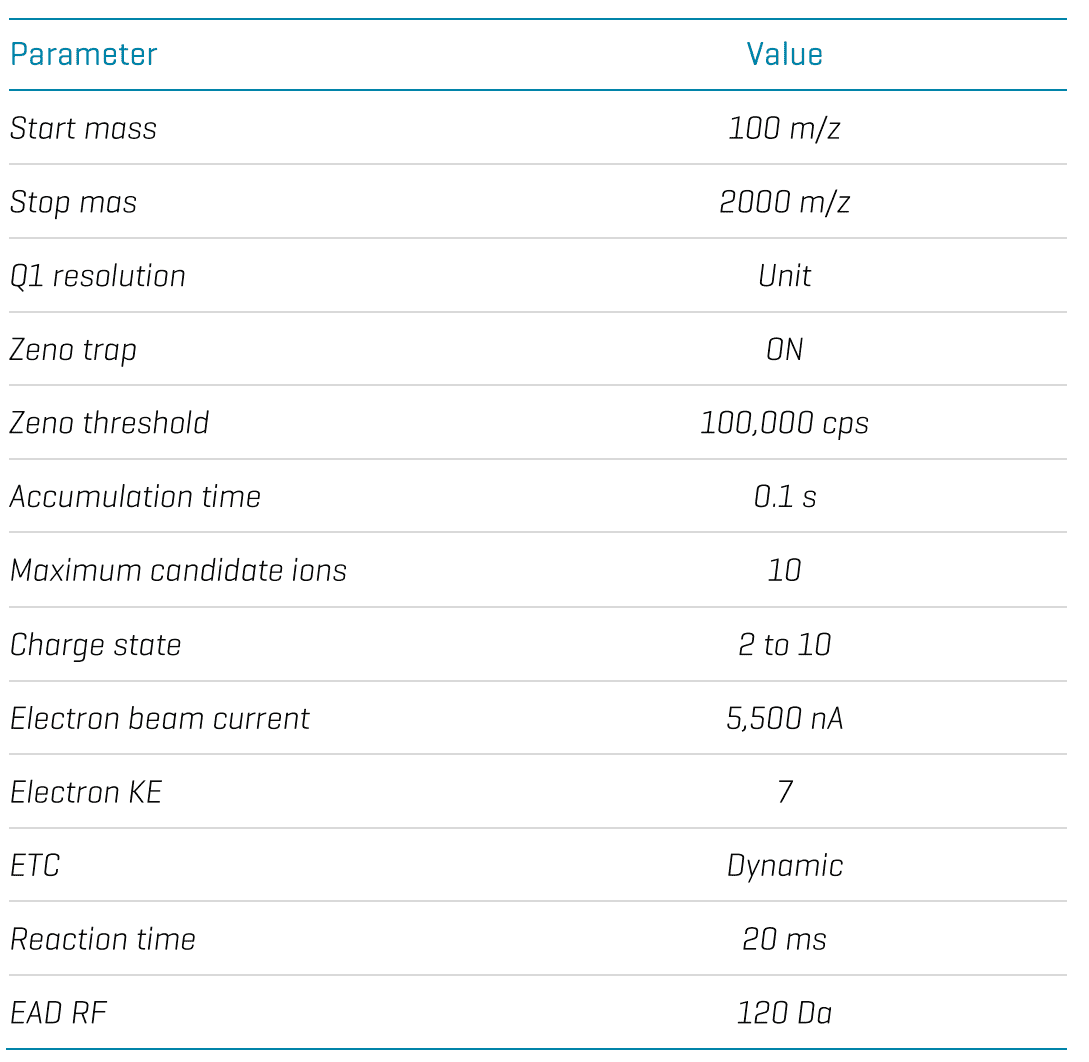
LC-MS: Upon the completion of icIEF-UV/MS analysis, the Intabio ZT unit was replaced with an ExionLC AD system (SCIEX). In LC-MS experiments, tryptic peptides of NISTmAb were separated using an ACQUITY BEH C18 column (2.1 × 150 mm, 1.7 µm, 130 Å, Waters). A flow rate of 0.25 mL/min was used for the chromatographic separation. The column was kept at 60°C in the column oven of the ExionLC AD system. Mobile phase A was 0.1% formic acid (FA) in water and mobile phase B was 0.1% FA in acetonitrile. The peptide mapping data was acquired using an EAD data-dependent acquisition (DDA) method. The key EAD DDA parameters are provided in Table 1.
Table 1. Key EAD DDA parameters.
Data analysis: UV traces and mass spectra from icIEF-UV/MS analysis were interpreted using Biologics Explorer software (SCIEX). Each peak in the charge profile was integrated using the Intabio software to determine its peak area and percentage composition. Intact masses of the main peak and charge variants were determined from the deconvolution of the corresponding mass spectra. EAD DDA data were processed using a peptide mapping workflow template within Biologics Explorer software. Two sets of icIEF-UV/MS and LC-MS data acquired before and after the configuration changes were compared to assess data consistency.
Conversion between icIEF-UV/MS and LC-MS configurations
The Intabio ZT system integrates charge separation and UV detection offered by icIEF-UV with the accurate mass measurement capability of the ZenoTOF 7600 system. icIEF-UV/MS offers simultaneous separation, detection and identification of charge variants in a single assay for rapid charge heterogeneity analysis of biotherapeutics.5-7 When coupled with an LC, the ZenoTOF 7600 system provides a full suite of LC-MS workflows for comprehensive biotherapeutic characterization.8-10 Alternating the icIEF-UV/MS and LC-MS configurations allows the user to leverage the unique capabilities of these orthogonal techniques on a single MS platform.
The configuration change from icIEF-UV/MS to LC-MS involves the undocking of the Intabio unit on a wheeled table, removal of a source adapter, installation of an ESI ion source and the connection of an LC system. The reversal of these steps will convert the LC-MS configuration back to icIEF-UV/MS (Figure 2). The process of switching between 2 instrument configurations can be completed in 10 minutes by a single user. The ease and quickness associated with the system conversion enable rapid access to complementary icIEF-UV/MS and LC-MS workflows, depending on the analytical need. The details of configuration changes between icIEF-UV/MS and LC-MS will be described separately. In this work, 2 sets of icIEF-UV/MS and LC-MS data (Before and After) were acquired and compared to assess data consistency before and after the configuration changes (Figure 2).
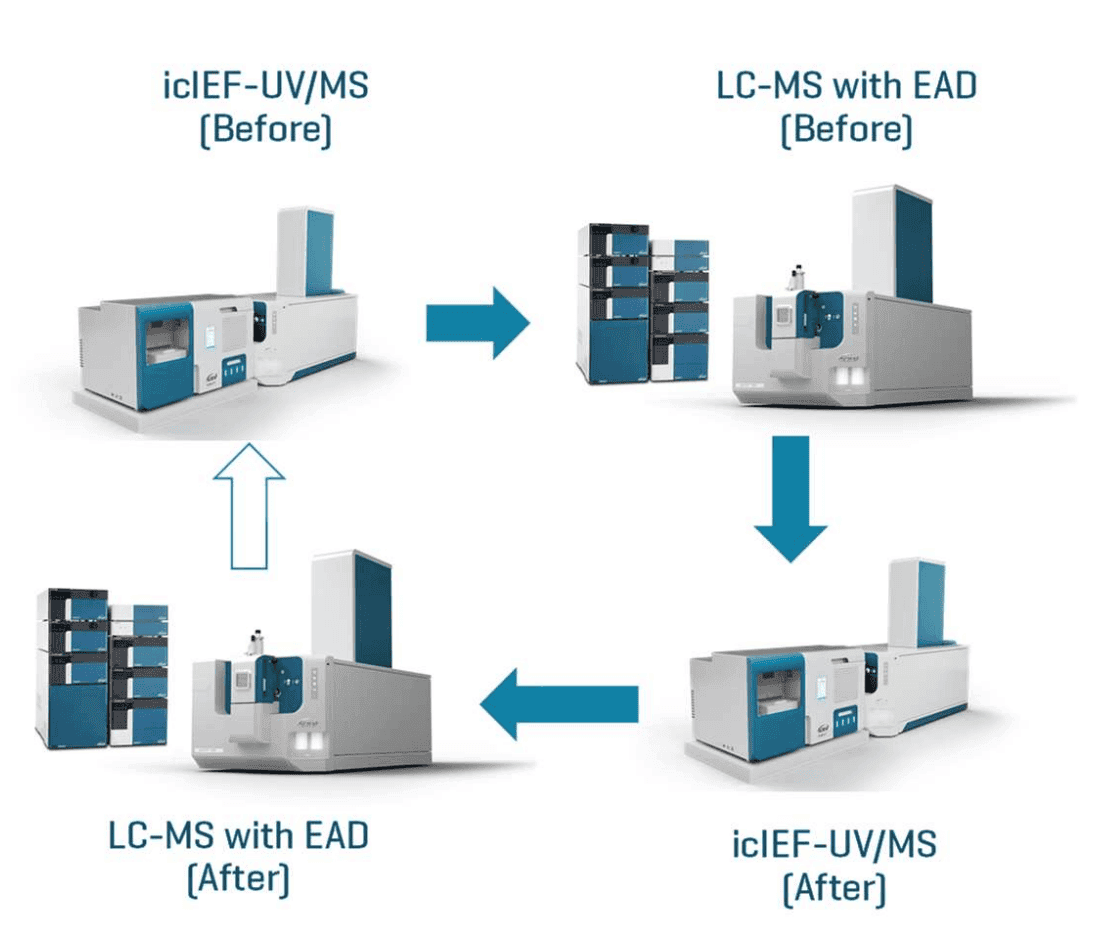
Figure 2. Configuration changes between icIEF-UV/MS and LC-MS. Two sets of icIEF-UV/MS and EAD-based peptide mapping data (Before and After) were acquired by switching between 2 instrument configurations. The unfilled arrow indicates that the system was converted back to the original icIEF-UV/MS configuration at the end of this study.
Charge heterogeneity analysis using the icIEF-UV/MS workflow
Figure 3 shows the icIEF-UV profile, icIEF-MS ion map and relative quantitation results of NISTmAb samples acquired before and after instrument configuration changes. High-resolution separation of acidic and basic variants from the main species was consistently observed in the Before (Figures 3A) and After (Figures 3B) profiles. The MS capability of the icIEF-UV/MS workflow provided consistent identification of various proteoforms, such as various glycoforms (species 1-15), under each charge variant peak following system conversion (Figure 3C). These results demonstrate the minimal impact of instrument configuration changes on the data quality and reproducibility of the icIEF-UV/MS workflow.
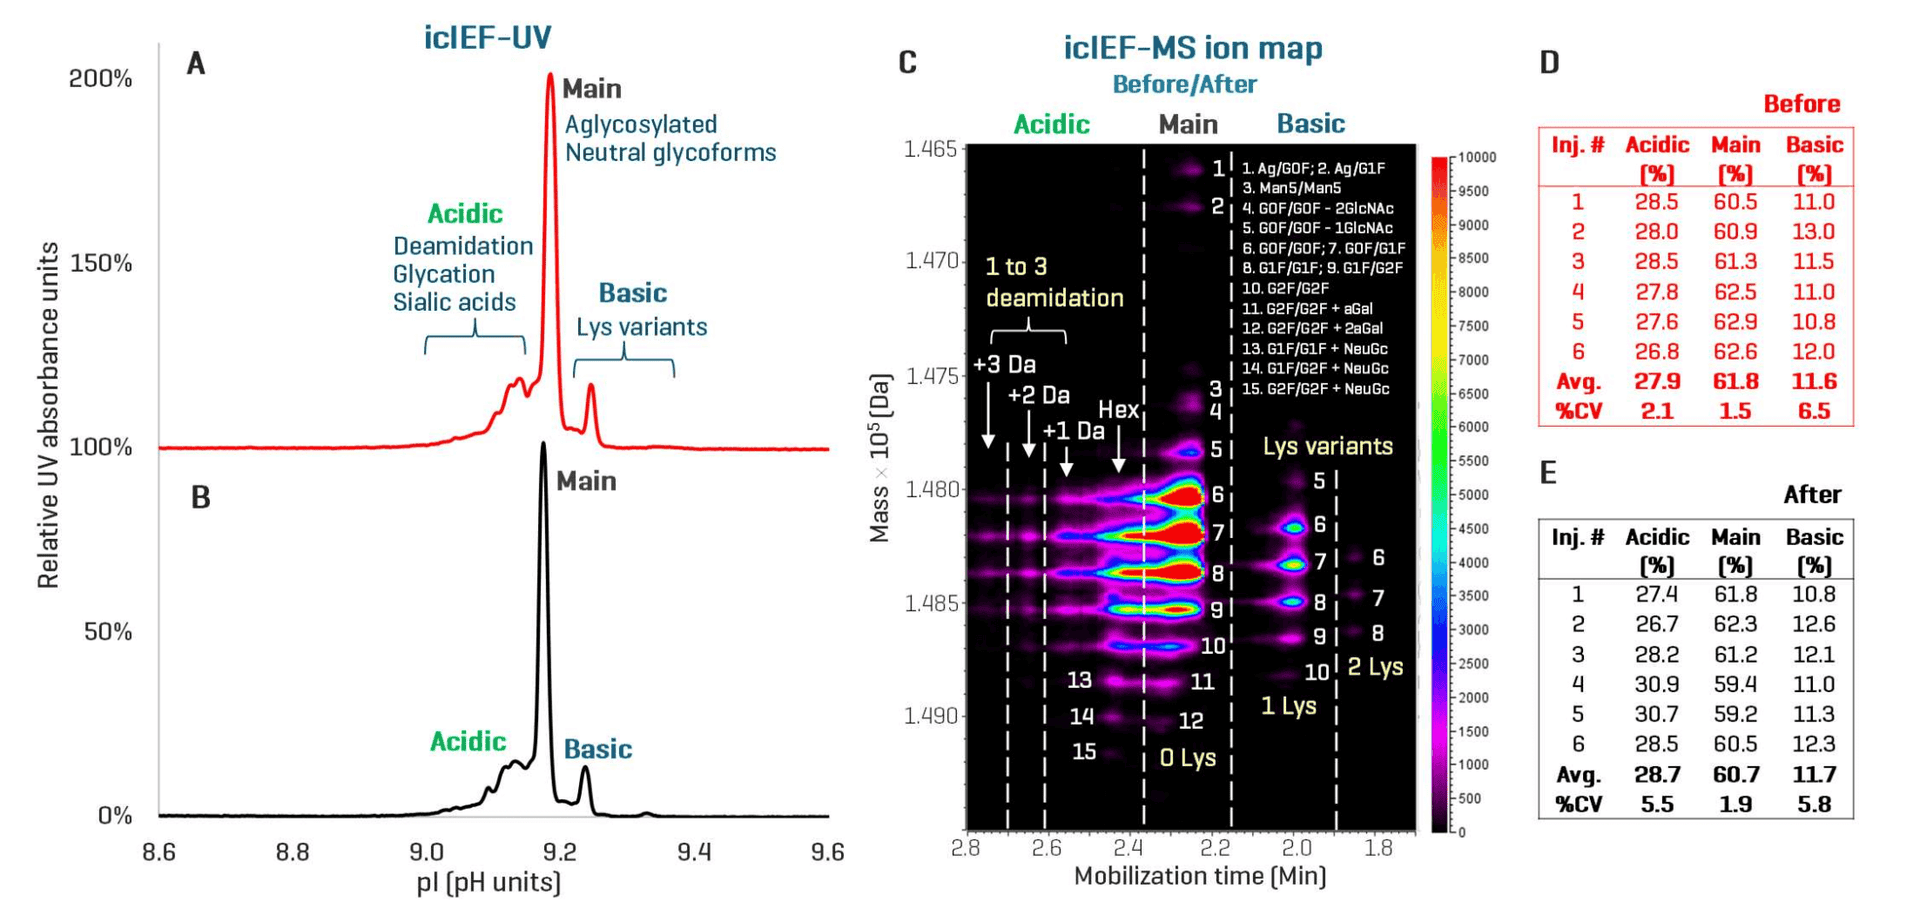
Figure 3. Reproducible separation, relative quantitation and identification of NISTmAb charge variants using the icIEF-UV/MS workflow before and after instrument configuration changes. The icIEF-UV profiles acquired before (A) and after (B) the configuration change show high similarities in charge variant separation and detection, demonstrating the reproducibility of the icIEF-UV/MS workflow. The ion map of the icIEF-MS data from Biologics Explorer software provides excellent visualization of multiple proteoforms, such as various glycoforms (species 1-15), identified from each charge variant peak before and after the configuration change (C). The tables in D and E display the percentage compositions of the main, acidic and basic species measured for 6 replicate injections of NISTmAb before and after system conversion, respectively. Similar quantitative values were obtained for each species across 12 injections, further demonstrating the minimal impact of instrument configuration change on the data quality and reproducibility. Ag: aglycosylated. Hex: glycation.
The tables in Figures 3D and 3E show the relative quantitation results obtained for 6 replicate injections of NISTmAb from the Before and After icIEF-UV/MS data, respectively. The average percentage compositions of the main, acidic and basic species measured from the Before data are 61.8%, 27.9% and 11.6% (Figure 3D), respectively, in good agreement with those (60.7%, 28.7% and 11.7%) measured from the After data (table in Figure 3E). High reproducibility of the quantitation result (%CV<10%) was also observed across 6 replicate injections before and after instrument configuration changes (Figures 3D and 3E). These results further demonstrate the reproducibility of charge variant separation, detection and quantitation using icIEF-UV/MS despite instrument configuration changes.
Biotherapeutic characterization using the EAD-based LC-MS workflow
Upon completion of icIEF-UV/MS analysis, the system was converted into the LC-MS configuration following the procedures described above. Two sets of peptide mapping data of NISTmAb (Before and After, Figure 2) were acquired using an EAD DDA method. A similar total ion chromatogram (TIC) intensity of ~7e7 was obtained for the Before and After data (not shown). The interpretation of 2 data files using the same parameters within Biologics Explorer software led to an identical sequence coverage of HC (98.9%) and LC (97.2%) (Figure 4A). High-quality EAD spectra of peptides were also obtained consistently from the 2 LC-MS data files. Figures 4B and 4C show the deisotoped EAD spectrum of the glycopeptide TKPREEQYN[G0F]STYR from the Before and After EAD DDA data, respectively. Nearly identical spectral quality and fragment coverage were obtained for this peptide identified in the 2 data files. The detection of a nearly complete series of c/z fragments led to accurate localization of labile G0F glycan in both cases. Similar EAD data were also obtained for other glycoforms, such G1F, G2F and Man5 (data not shown). These LC-MS results confirm the glycoform identification achieved using icIEF-UV/MS (Figure 3C).
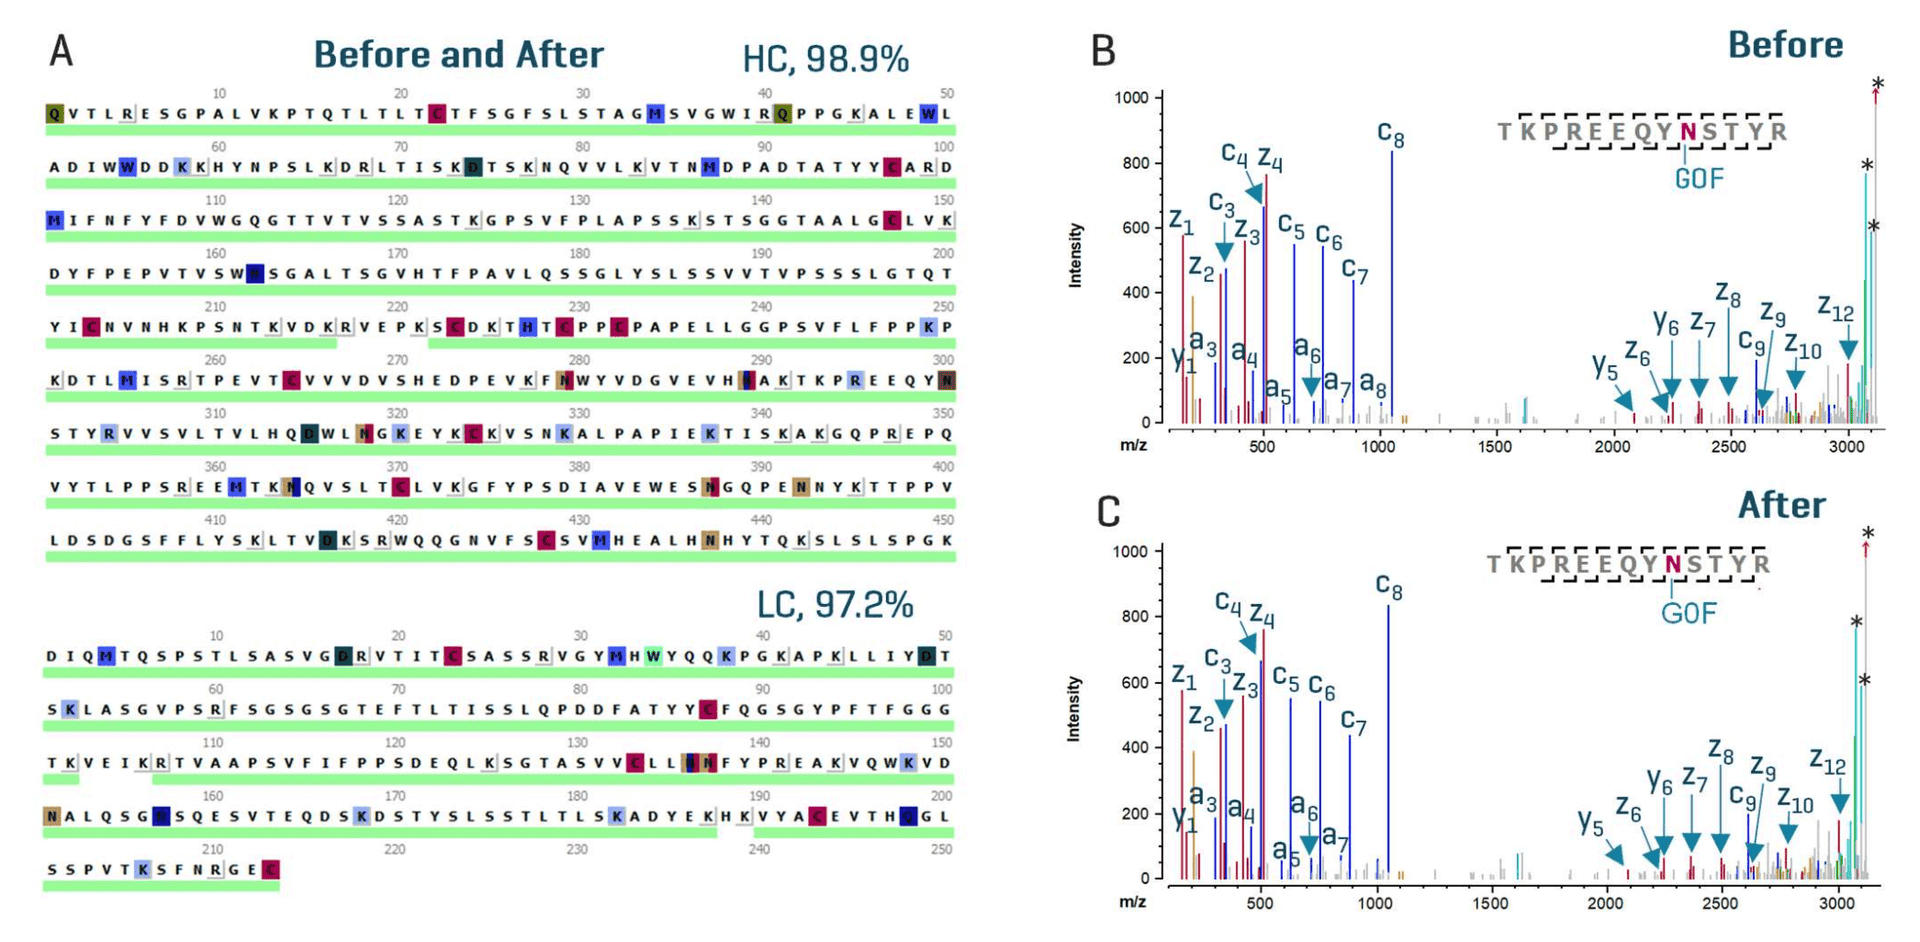
Figure 4. EAD-based peptide mapping results obtained before and after instrument configuration changes. The EAD-based peptide mapping data acquired before and after instrument configuration changes led to an identical sequence coverage of NISTmAb (>97% for HC and LC) (A). Consistent high-quality EAD data were obtained in the Before and After data. An example demonstrating this similarity is provided in B and C, which show the deisotoped EAD spectra of the glycopeptide TKPREEQYN[G0F]STYR obtained before (B) and after (C) system switching. * Precursor or neutral-loss peaks.
In summary, the data presented in this technical note demonstrate the operation simplicity and data reproducibility associated with alternating between icIEF-UV/MS and LC-MS configurations on a single MS system. Highly reproducible icIEF-UV/MS and LC-MS data were obtained before and after the configuration changes, ensuring confidence in leveraging these 2 orthogonal workflows for rapid charge heterogeneity analysis and comprehensive biotherapeutic characterization on a regular basis.