Abstract
This technical note demonstrates the utility of orthogonal technologies, such as capillary isoelectric focusing (cIEF), imaged cIEF (icIEF)-UV/MS, and LC-MS based peptide mapping and middle-down workflows in the realm of biopharmaceuticals, to enable an understanding of critical quality attributes (CQAs). These streamlined workflows can be leveraged separately or jointly for charge variant analysis at all stages of biotherapeutic discovery and development, empowering scientists to make informed decisions at critical stages to ensure the highest level of drug quality and safety. Charge heterogeneity is an important CQA, which not only needs to be fully characterized, but also closely monitored to ensure the quality, safety and efficacy of a biotherapeutic product.1,2 The presence of various post-translation modifications (PTMs), such as deamidation, glycosylation, glycation and C-terminal clipping, leads to a complex charge profile of biotherapeutics.1,2 cIEF is the gold standard for charge variant analysis in biotherapeutics development; by accurately measuring migration time and determining the percent compositions of the charge variants, biopharma scientists can quickly evaluate biotherapeutics' quality attributes, ensuring their safety and efficacy. However, there are technical and resource challenges that limit the ability to identify proteoforms in charge variant peaks in a timeframe that keeps pace with process development.
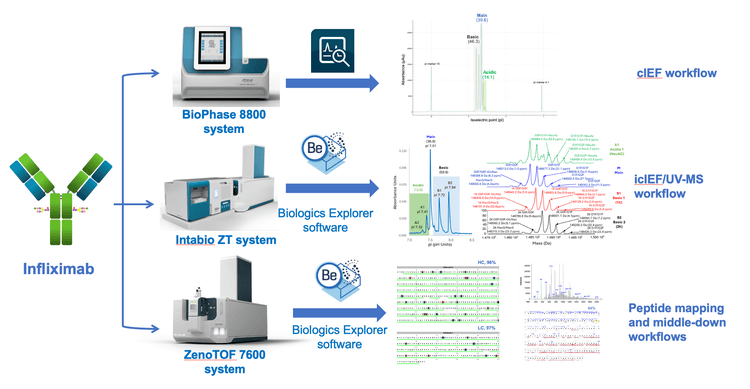
In this technical note, we address the challenge of proteoform identification and characterization in cIEF results, by harnessing the power of orthogonal workflows- cIEF, icIEF-UV/MS, peptide mapping, and middle-down assays to gain a comprehensive understanding of the attributes contributing to the complex charge profile of infliximab. (Figure 1).
Key features of full characterization toolset from SCIEX
- High throughput: Enable rapid charge heterogeneity assessment for high-throughput screening, monitoring and method optimization.
- Confident identification: icIEF-UV/MS and LC-MS workflows provide sensitive detection and confident identification of proteoforms in each charge variant.
- Power of EAD: EAD-based peptide mapping and middle-down workflows provide accurate localization of labile PTMs, rapid disulfide bond mapping, differentiation of amino acid isomers and high sequence coverage.
- Platform assays: The streamlined cIEF, icIEF-UV/MS and EAD-based peptide mapping workflows can be easily adopted for routine biotherapeutic characterization for the entire development pipeline.
Introduction
Antibody-based therapeutics are highly heterogeneous due to the presence of degradation products, aggregates and charge variants.1,2 The charge variants are predominantly formed from different modifications of the main species, such as C-terminal Lys pyroglutamate and amidation for the basic species and deamidation and glycation for the acidic species.2 Many of these species are critical quality attributes whose levels must be closely monitored and controlled to ensure product quality.1 While SCIEX cIEF approaches3,4 offer high-resolution and reproducible separation of the charge variant profile in a high throughput manner, it is challenging to identify the proteoforms in each charge variant with just this system. The Intabio ZT system enables an integrated icIEF-UV/MS workflow and effectively bridges the gap, enabling confident and precise characterization of various proteoforms within biotherapeutic charge variants.5-7 Further, to provide detailed information for biotherapeutics - such as sequence confirmation, PTM localization, isomer differentiation and disulfide bond mapping1, LC-MS based methods, such as peptide mapping and middle-down, enable comprehensive characterization. The implementation of electron activated dissociation (EAD) for these LC-MS workflows significantly expands their capabilities for biotherapeutic characterization.8-10
In a previous cIEF study of intact infliximab, an intriguing charge profile was observed with abundant basic species11. A different study using icIEF-UV/MS suggested that the Cterminal Lys residue primarily contributes to these species.5 Therefore, employing multiple orthogonal technologies together to elucidate the charge variant profile of biotherapeutics comprehensively is important. This work leverages cIEF, icIEF-UV/MS and LC-MS approaches to achieve a complete characterization of the charge profile of infliximab, as shown in Figure 2.

Methods
Detailed information about sample preparation, data acquisition and data analysis for the cIEF, icIEF-UV/MS and LC-MS workflows can be found in the previous technical notes.3-10 Below is a brief description of these steps for each workflow.
Samples preparation:
cIEF: All buffers and reagents were prepared following instructions in the Capillary Isoelectric Focusing (cIEF) Kit for the BioPhase 8800 system application guide.3,4 The infliximab sample was thoroughly mixed with the master solution comprised of 4M urea-cIEF gel, cathodic stabilizer, anodic stabilizer, pharmalyte 3-10 and pI markers 10.0 and 4.1. An aliquot of the mixture was transferred to a sample plate, which was spun at 20 g for 4 minutes.
icIEF-UV/MS: Infliximab was desalted and then mixed with the master mix solution containing arginine, pharmalyte 5 to 8 (Cytiva), pharmalyte 8 to 10.5 and 6.0 µg/mL peptide pI markers. The solution was vortexed and degassed by centrifugation.
LC-MS: Enzymatic digestion of infliximab was performed using the Trypsin/Lys-C (Promega) and FabBRICATOR (IdeS, Genovis) proteases for peptide mapping for middle-down analyses, respectively.
Data acquisition:
cIEF: The cIEF data was acquired using a BioPhase 8800 system (SCIEX) equipped with a UV detector. The cIEF separation method was executed at 20°C, with a focusing step of 25 kV for 15 min and the mobilization step at 30 kV for 30 min.
icIEF-UV/MS: During icIEF-UV/MS analysis, the infliximab sample was separated with an Intabio cartridge (SCIEX) installed on the Intabio ZT system (SCIEX). UV absorbance measurements were collected at 1 Hz during the focusing and mobilization steps. The samples were introduced into the ZenoTOF 7600 system by a metered 3 µL/min flow of chemical mobilizer, and the data was acquired
LC-MS: In the peptide mapping experiment, tryptic peptides were separated using an ACQUITY BEH C18 column (2.1 × 150 mm, 1.7 µm, 130 Å, Waters). A flow rate of 0.25 mL/min was used for the chromatographic separation. The column was kept at 60°C in the column oven of an ExionLC AD system (SCIEX). Mobile phase A was 0.1% formic acid (FA) in water and mobile phase B was 0.1% FA in acetonitrile. The peptide mapping data was acquired using a joint CID/EAD data-dependent acquisition (DDA) method described previously.8
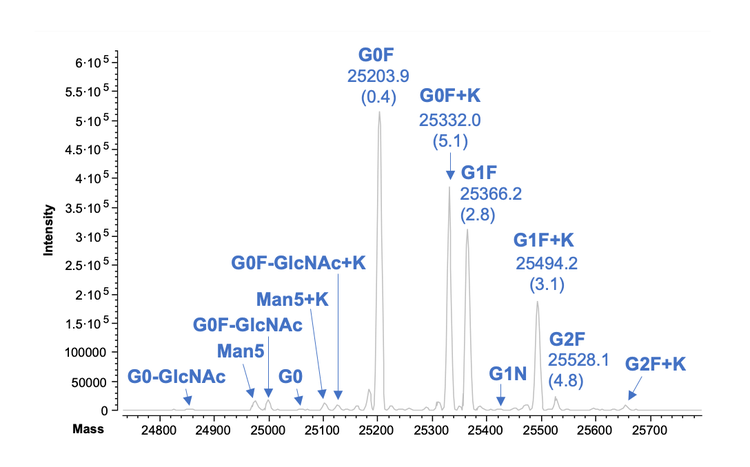
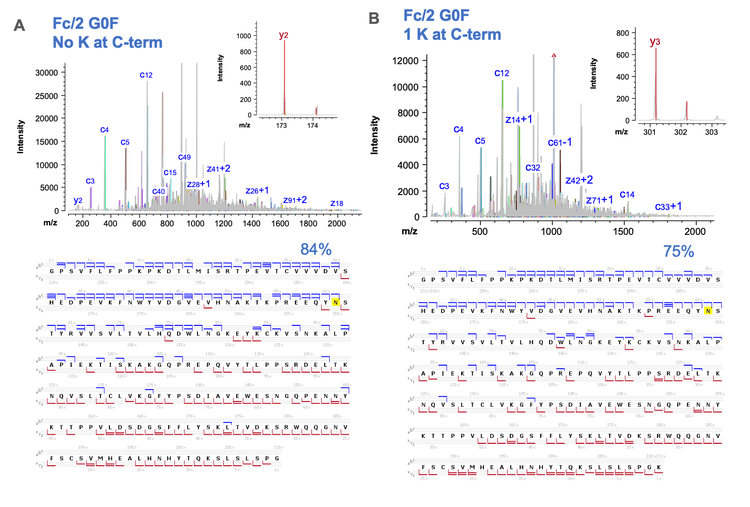
The LC, Fc/2 and Fd subunits from IdeS treatment of infliximab were separated at a flow rate of 0.3 mL/min using an ACQUITY UPLC Protein BEH C4 column (2.1 × 50 mm, 1.7 µm, 300 Å, Waters). The accurate mass of each subunit was measured using a TOF MS method. Middle-down analysis of the subunits, including LC, Fd and the Fc/2 subunit with or without the C-terminal Lys, was performed using an MRMHR EAD method. Three charge states per subunit were selected for EAD fragmentation with an electron kinetic energy of 1 eV.
Data analysis:
cIEF: The cIEF data were analyzed using the BioPhase 8800 system software, version 1.0. The integrated peak areas of the main species and charge variants were used for percent composition calculations.
icIEF-UV/MS: UV traces and mass spectra from icIEF-UV/MS analysis were interpreted using Biologics Explorer software (SCIEX). Each peak in the charge profile was integrated using Intabio software to determine its peak area and percentage composition. Intact masses of the main peak and charge variants were determined from the deconvolution of the corresponding mass spectra.
LC-MS: Intact mass analysis of infliximab subunits was conducted using an intact workflow template in Biologics Explorer software. CID/EAD DDA and EAD MRMHR data were interpreted using the peptide mapping and middle-down workflow templates, respectively.
Separation of charge variants using cIEF
cIEF is a powerful analytical separation technology for the characterization of protein therapeutics. cIEF is sensitive to small changes in the overall charge of the protein. For example, the retaining of the C-terminal Lys, pyroglutamate, amidation and succinimide formation yield basic variants, whereas deamidation, sialylation and glycation lead to acidic variants.2 The percent compositions of the main, basic and acidic species are a key matrix for quality assessment of a biotherapeutic because of the impact of charge variants on the safety and efficacy of the therapeutic product. The multi-capillary platform offered by the BioPhase 8800 system enables reproducible separation of the charge variants in a high throughput manner, facilitating rapid assessment of the product quality.
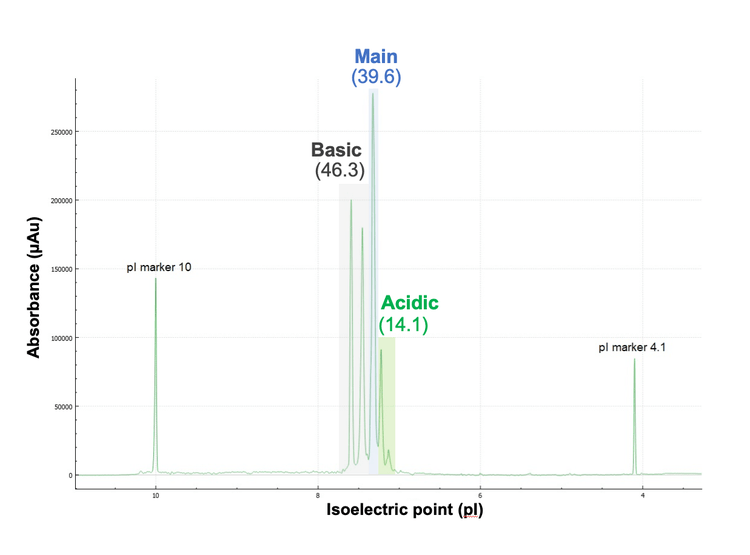
Figure 3 shows the cIEF charge profile of intact infliximab and 2 pI markers. A clear separation of the main, basic and acidic species was achieved. The percent compositions of the 3 species were calculated from their integrated peak areas using BioPhase 8800 system software. The result shows that the total composition of the basic variants (46.3%) is slightly higher than that of the main species (39.6%), while the acidic variants account for the remaining 14.1%. The high percentage of basic variants poses a question of what attributes contributed to the abundance of the basic peak. Further investigation is needed to determine the underlying modifications responsible for this observation, as C-terminal Lys, pyroglutamate, amidation and succinimide can all contribute to basic variants. Therefore, icIEF-UV/MS is employed to provide proteoform identification in each charge variant. The relative peak abundance from cIEF separation agree well with those obtained from icIEF-UV/MS analysis in the previous and present studies, as will be described below.
Separation and identification of charge variants by icIEF-UV/MS
Simultaneous separation, quantitation and identification of biotherapeutic charge variants in a single assay is challenging. The Intabio ZT system addresses this challenge by coupling charge separation and UV detection offered by icIEF-UV with accurate mass measurement using the high-resolution ZenoTOF 7600 system.5-7
The separation efficiency and resolution of icIEF are maintained after the mobilization step, enabling confident identification of different charge variants by MS. It was demonstrated previously that this powerful workflow provides reproducible separation and detection of intact mAbs and their charge variants.5-7
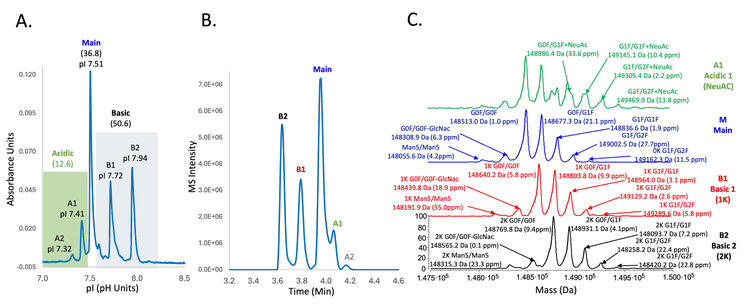
Figure 4 shows the icIEF-UV/MS results of intact infliximab obtained using the Intabio ZT system. The icIEF-UV profile reveals a high resolution separation of the main species and charge variants (Figure 4A). This result matches well with that obtained using cIEF, except that the basic and acidic species appear on the opposite sides of the main peak in 2 profiles, as the data was collected using icIEF separation (Figures 3 and 4A). The MS Base Peak Electropherogram (BPE) shows all the peaks observed on icIEF-UV profile were also detected in icIEF-MS profile without compromising separation resolution (Figure 4B), demonstrating that the separation power was maintained after chemical mobilization. From the icIEF-UV profile, the percent compositions of the main, acidic and basic species were calculated to be 50.6%, 12.6% and 36.8%, respectively. These percentage numbers correlate with the values from the cIEF separation in this work (Figure 3) and the previous icIEF-UV/MS study5, highlighting the reproducibility and transferability of this technology.
Peptide mapping and middle-down analyses
To confirm the identification in icIEF-UV/MS workflow, a combination of techniques was employed, including peptide mapping and EAD based middle-down analysis. This comprehensive approach allows for a thorough characterization of infliximab, providing a deeper understanding of quality attributes. Previous studies have demonstrated the capability, versatility and flexibility of the ZenoTOF 7600 system equipped with the Zeno trap and EAD cell to achieve unparalleled peptide mapping and middle-down results for comprehensive biotherapeutic characterization in a single injection.9-11 A 5- to 10-fold sensitivity increase in the detection of MS/MS fragments offered by the Zeno trap leads to high sequence coverage of biotherapeutics on the peptide or subunit levels. The ability of EAD to preserve labile PTMs and differentiate amino acid isomers greatly enhances the capability of peptide mapping and middle-down workflows for biotherapeutic characterization. In addition, the flexibility to create DDA or MRMHR methods using CID, EAD or the combination of 2 fragmentation techniques in SCIEX OS software ensures that different needs for biotherapeutic development can be met.
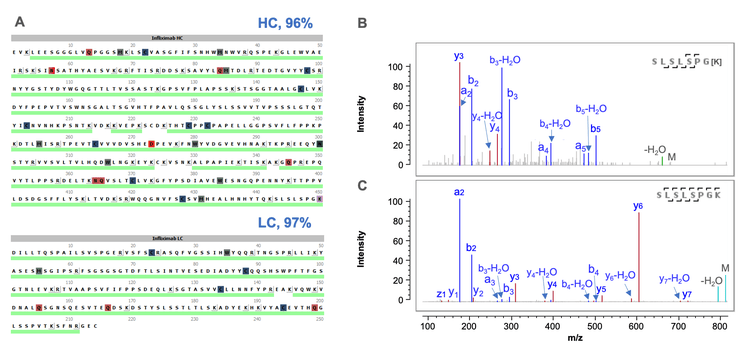
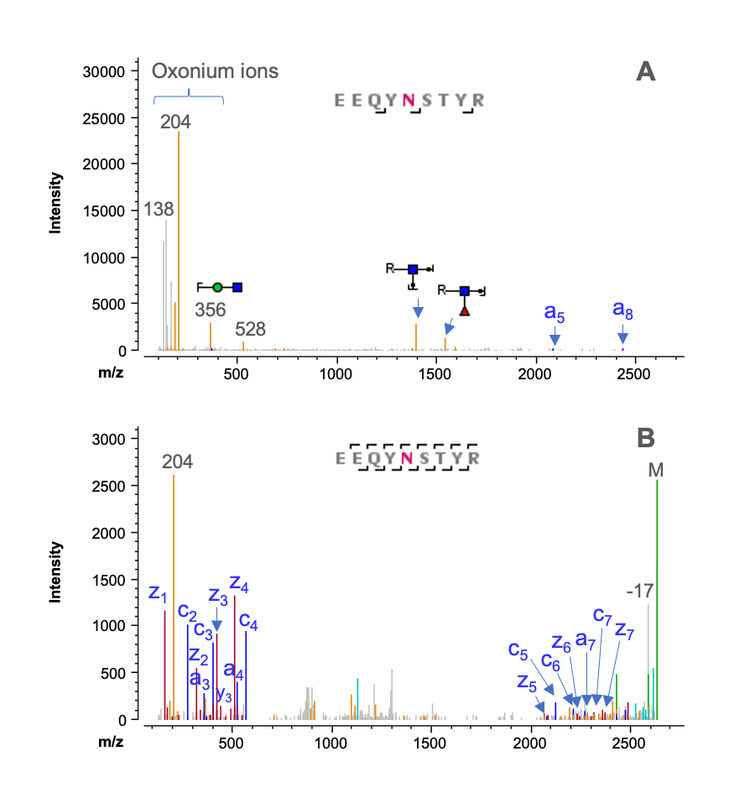
Figure 5 shows selected peptide mapping results obtained using a joint CID/EAD DDA method. The combined CID and EAD result led to >95% sequence coverage of LC and HC in a single injection (Figure 4A). The HC peptides with or without the C-terminal Lys residues were confidently identified by the highly sensitive CID DDA (Figures 5B and 5C). In addition to achieving high sequence coverage, the joint CID/EAD DDA method provided the benefits of 2 fragmentation techniques. While CID provides effective fragmentation of the singly charged short peptides, as was the case for the C-terminal peptide without Lys (Figure 5B). EAD enables accurate localization of glycosylation and unambiguous differentiation of amino acid isomers. Figure 6 shows complementary CID and EAD MS/MS spectra of the G0F-containing glycopeptide EEQYNSTYR from the same data file. EAD produced a series of sequence fragments (e.g. c5- c7 and z5-z7) containing the G0F moiety (Figure 6B), enabling the accurate localization of the glycan.
In summary, the data presented in this technical note demonstrates the power of orthogonal cIEF, icIEF-UV/MS and LC-MS workflows for a complete characterization of biotherapeutics and their charge variants. SCIEX characterization portfolio offers high-throughput cIEF assays for monitoring throughout the development pipeline. icIEF provides proteoform identification for each charge variant, while middle-down and peptide mapping confidently confirm the results. Enabling decisions to be made earlier in the development pipeline while utilizing less resource intensive assays.
The multi-capillary cIEF workflow provides reproducible separation of the charge variants in a high throughput manner. Integrated MS detection in the icIEF-UV/MS workflow leads to simultaneous charge variant separation, accurate quantitation and identification, providing an extra layer of depth in biotherapeutic characterization by identifying the cause of charge heterogeneity. LC-MS based peptide mapping and middle-down workflows offer an added confidence in sequence confirmation on the peptide or subunit level. All the workflows described in this technical note are streamlined and easy to implement separately or jointly for routine charge variant analysis of biotherapeutics. This can help biopharma scientists make informed decisions earlier in the development process.
Conclusion
- SCIEX provides a wide range of analytical tools for biotherapeutic characterization.
- Orthogonal cIEF, icIEF-UV/MS and LC-MS workflows offer an in-depth characterization of biotherapeutics and their charge variants.
- The multi-capillary platform offered by the cIEF workflow provides charge variant separation in a high throughput manner suitable for product monitoring.
- The icIEF-UV/MS workflow provides a 30-min sample analysis which is significantly faster than conventional cIEF and IEX workflows requiring fractionation for the following identification.
- LC-MS based peptide mapping and middle-down workflows offer the advantages of sequence confirmation and PTM localization on the peptide or subunit level.
- All the workflows described in this technical note are streamlined and can be implemented separately or jointly for routine charge variant analysis of biotherapeutics in the realm of biopharmaceuticals.
References
- Anna Robotham and John Kelly. (2020) LC-MS characterization of antibody-based therapeutics: recent highlights and future prospects. Approaches to the Purification, Analysis and Characterization of Antibody-Based Therapeutics. Chapter 1: 1- 33.
- Yi Du et al. (2012) Chromatographic analysis of the acidic and basic species of recombinant monoclonal antibodies. MABS. 4(5):578-585.
- Purity assessment and charge heterogeneity analysis of intact and subunit of etanercept on a single CE platform. SCIEX technical note, MKT-29756-A.
- N-linked glycan analysis of NISTmAb, etanercept and trastuzumab. SCIEX technical note, MKT-27527-A.
- Direct and rapid multi-attribute monitoring of multiple intact monoclonal antibodies with a wide isoelectric-point range of 7.3 to 9.1. SCIEX technical note, MKT-26996-A.
- A comprehensive workflow to characterize deglycosylated NISTmAb using imaged capillary isoelectric focusing (icIEF)- UV/MS. SCIEX technical note, MKT-27945-A.
- Charge variant analysis of antibody-drug conjugates using an icIEF-UV/MS workflow. SCIEX technical note, MKT-29837-A.
- Ostrowski M. Rapid multi-attribute characterization of intact bispecific antibodies by a microfluidic chip-based integrated icIEF-MS technology. Electrophoresis. 2022 Oct;1-9
- A single-injection workflow for enhanced peptide mapping using collision-induced dissociation (CID) and electronactivated dissociation (EAD). SCIEX technical note, MKT-28039- A.
- An enhanced single-injection middle-down workflow to achieve high sequence coverage and disulfide mapping of antibody subunits. SCIEX technical note, MKT-30575-A.
- Differentiation of leucine and isoleucine for enhanced sequence variant analysis using electron activated dissociation. SCIEX technical note, MKT-30799-A.
- Native State Charge Variant Analysis of Commercialized Monoclonal Antibodies in Minutes. SCIEX technical note, RUO-MKT-02-10446-A