Analysis of per- and polyfluoroalkyl substances (PFAS) in aqueous, solid, biosolid and tissue samples following EPA Method 1633
Megumi Shimizu1 , Craig M. Butt1 , Matt Noestheden1 , Karl A. Oetjen1 , Sam Lodge2 and Phil Bassignani3
1SCIEX, USA; 2Phenomenex, USA; 3Alpha Analytical, Inc, USA
Abstract
This technical note demonstrates the performance of EPA Method 1633 for the analysis 40 PFAS in surface water, soil and fish tissue. Using the SCIEX 5500+ system, initial demonstration of capability (IDC) experiments yielded experimental method detection limit (MDL) concentrations lower than the finalized, pooled values for aqueous matrices. Method robustness was demonstrated across 40 hours of extracted matrix and solvent standard injections. Mean accuracy ranged from 88% to 111% and the mean %CV was 4.9%. Further, the method achieved ~3 min resolution of TDCA from PFOS and PFHxS, which is a critical requirement of EPA Method 1633. Finally, analysis of sludge and soil standard reference materials (SRMs) showed comparable concentrations to their certified values, demonstrating good method accuracy.
Introduction
EPA Method 1633 method is an isotope dilution method that is comparable to drinking water PFAS methods (EPA Methods 533 and 537.1). In addition to the compounds in EPA Methods 533 and 537.1, EPA Method 1633 includes long chain perfluorinated sulfonic acids (PFNS, PFDS, PFDoS), fluorooctanesulfonamides (FOSAs), fluorooctanesulfonamidoethanols (FOSEs) and x:3, fluorotelomer carboxylic acids (FTCAs). Unlike the previous EPA PFAS methods, EPA Method 1633 requires monitoring 2 fragment ions for most analytes.
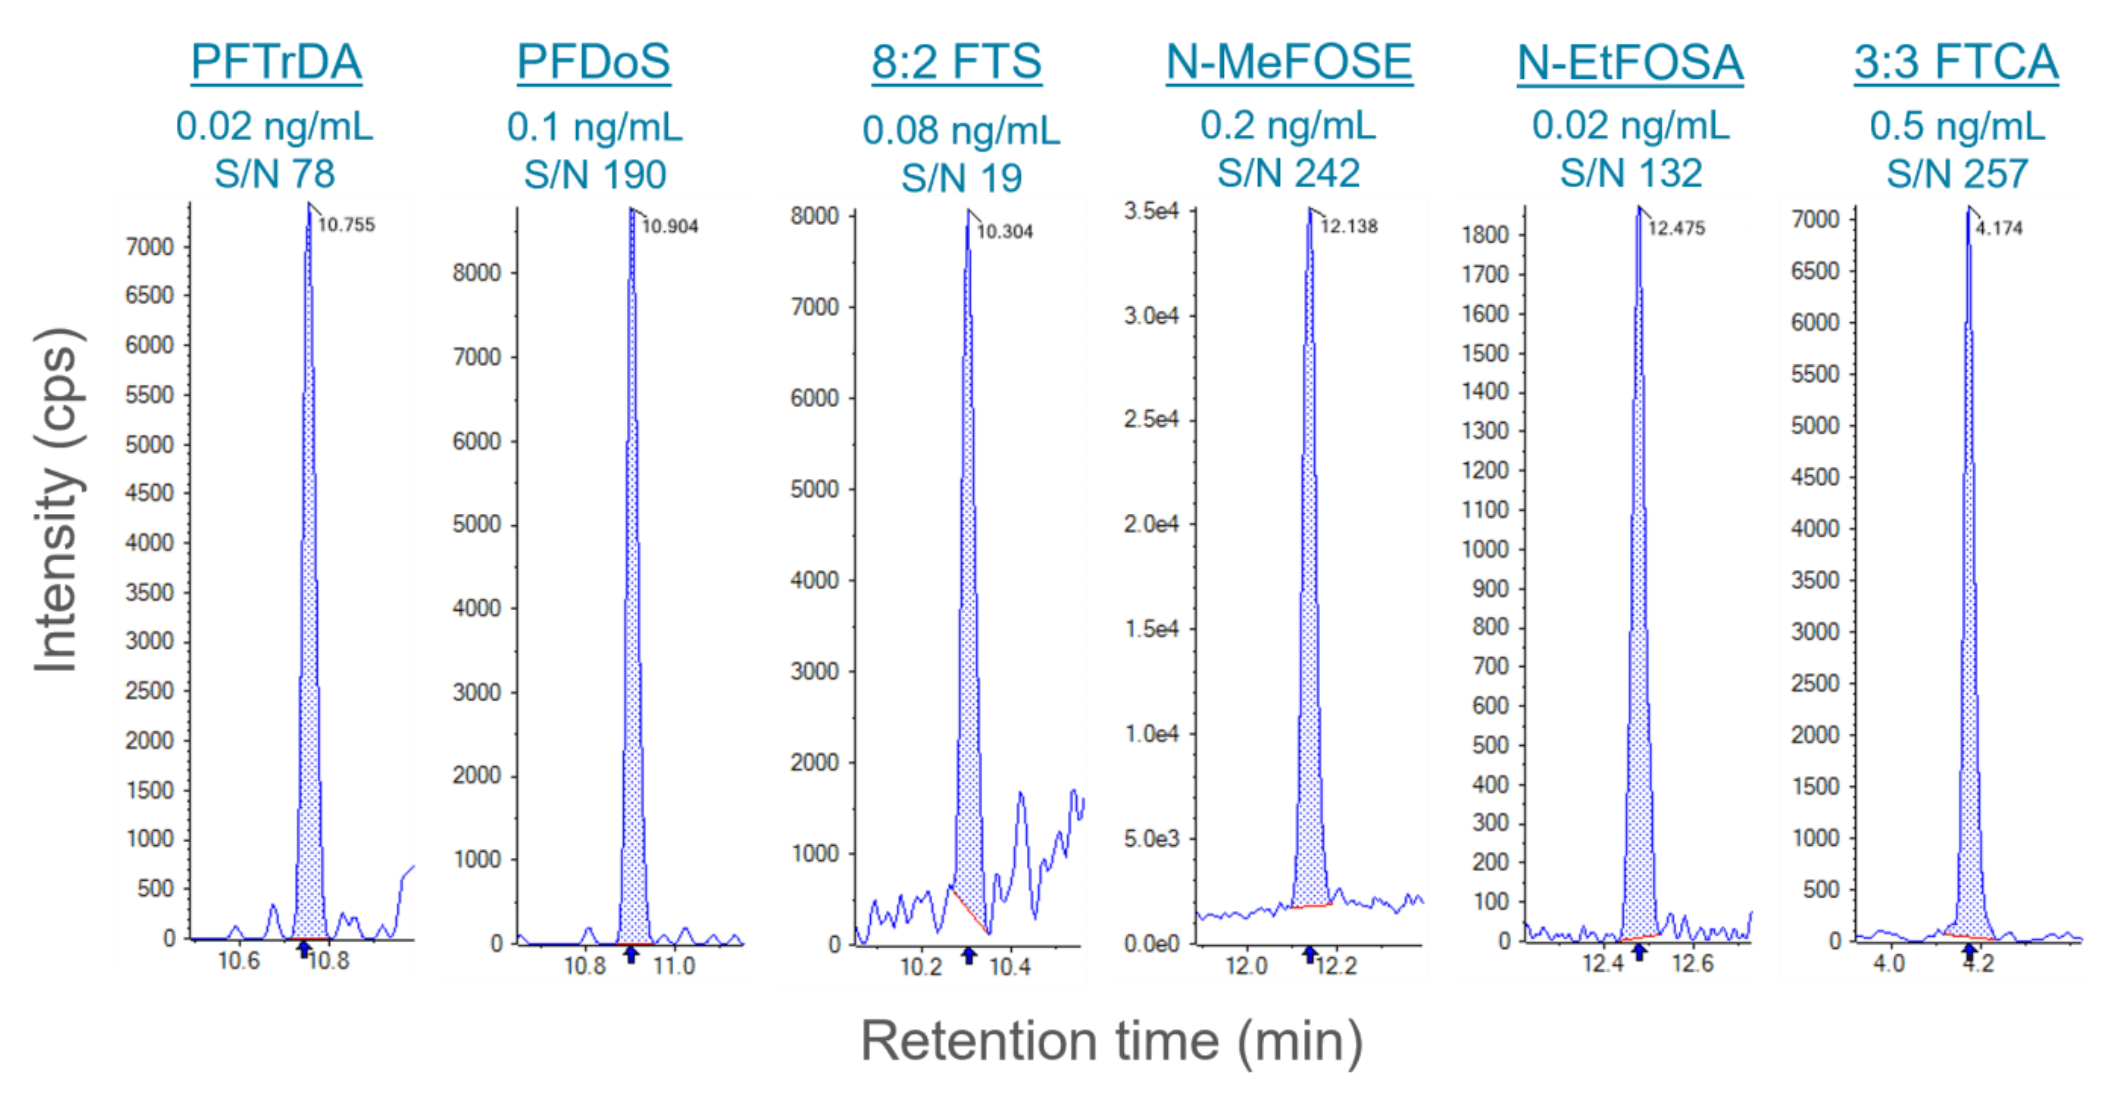
Figure 1. LOQ chromatograms for representative PFAS compounds. In-vial LOQ concentrations were 0.1x to 0.5x lower than the level 1 EPA standard, demonstrating the high sensitivity of the method. The chromatograms shown cover the diverse range of PFAS classes included in EPA Method 1633.
Key benefits of the analysis following EPA Method 1633 on the SCIEX 5500+ system
- The observed limits of quantitation (LOQ) were 0.1x to 0.5x of the EPA level 1 standard (Figure 1), except for PFOSA
- The method showed chromatographic separation of taurodeoxycholic acid (TDCA) from PFOS (>2 min) and other PFAS analytes
- The method showed excellent robustness across ~40 hours of 125 continuous injections of solvent standards and matrix samples. The mean accuracy of the continuing calibration verification (CCV) standard (n=10) was 98%.
- The accurate quantitation with real-world samples was demonstrated using SRMs
Methods
Sample preparation: Methods followed those prescribed by the EPA Method 1633 documentation1 and are briefly described below.
For aqueous matrices (bottled spring water), the samples were spiked with the extracted internal standard (EIS) mixture. The pH was normalized to 6.5 if necessary and the sample was extracted using WAX/GCB solid phase extraction (SPE) cartridges.
For solid matrices (Ottawa sand mixed with reagent water), the samples were spiked with the EIS mixture and extracted 3 times with 0.3% methanolic ammonium hydroxide. The combined supernatants were reduced under nitrogen gas and interferences were removed using the WAX/GCB SPE cartridges.
For the tissue matrix (pollock fillets), homogenized samples were spiked with the EIS mixture and then extracted sequentially with 0.05M potassium hydroxide, acetonitrile and then 0.05M potassium hydroxide in methanol. The combined supernatants were reduced in volume under nitrogen gas and interferences were removed using the WAX/GCB SPE cartridges.
The WAX/GCB extraction and cleanup procedures for all sample matrixes used the Phenomenex WAX/GCB stacked SPE cartridges (P/N: CSO-9207, 200 mg WAX/50 mg GCB, 6 mL). Cartridges were conditioned with 1% methanolic ammonium hydroxide and then 0.3M formic acid. After sample loading, cartridges were washed with water and then 1:1 (v/v), 0.1M formic acid/methanol. The cartridges were eluted with 1% methanolic ammonium hydroxide. The final eluant was spiked with the non-extracted internal standard (NIS) mix.
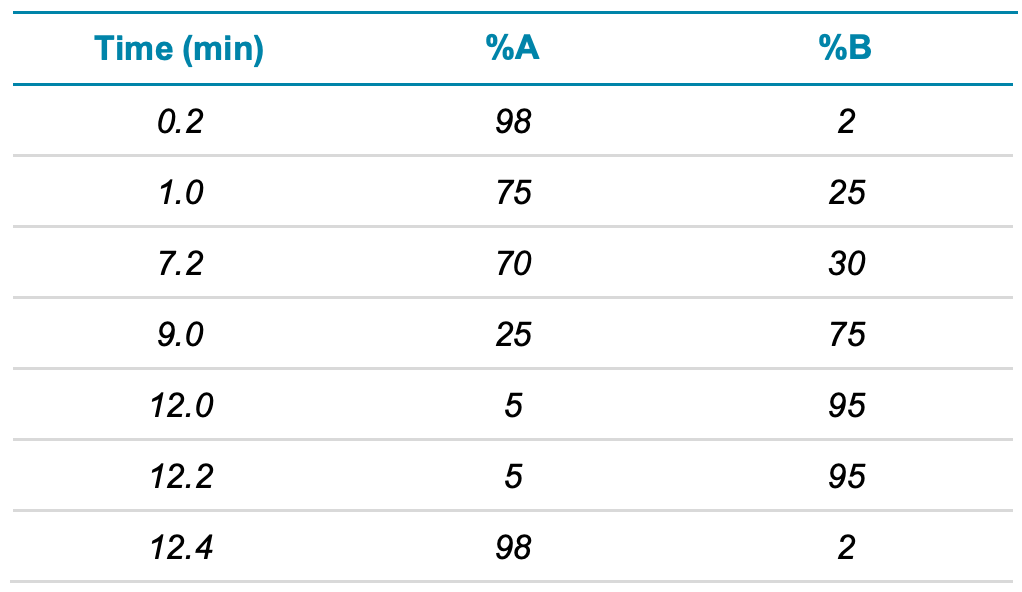
Chromatography: An ExionLC AD system was used that had been modified to remove the fluoropolymer tubing as well as the addition of a delay column (Phenomenex Luna C18). The analytical column was the Phenomenex Luna Omega Polar C18 column (100 mm x 2.1 mm, 3 µm, P/N: 00D-4760-AN) with a SecurityGuard ULTRA guard cartridge (EVO-C18, P/N: AJ0- 9298). Mobile phase A was 2mM ammonium acetate in 95:5 (v/v), water/acetonitrile and mobile phase B was acetonitrile. The flow rate was 0.4 mL/min and the gradient conditions are presented in Table 1. The injection volume was 2 µL and the column oven was set to 40°C.
Table 1. LC gradient.
Mass spectrometry: Samples were analyzed using the SCIEX QTRAP 5500+ system with the Turbo V ion source in negative electrospray ionization mode. The source/gas parameters included: CAD 9 psi, CUR 45 psi, GS1 50 psi, GS2 50 psi, ISV - 4500 V and TEM 450°C. Data were acquired using the Scheduled MRM algorithm with a target scan time of 0.3 s. Compound-specific parameters were optimized for collision energy (CE), declustering potential (DP) and collision exit potential (CXP). Two transitions per compound were monitored except for PFBA, N-MeFOSE, N-EtFOSE, PFMPA and PFMBA, which did not have stable secondary transitions, as allowed by the draft EPA Method 1633 criteria.
Quality control: The initial calibration samples (ICAL) were evaluated by the quality control (QC) criteria listed in the draft EPA 1633 method. For linearity, the relative standard deviation (RSD) values for the calibration response ratio (RR) and response factor (RF) were required to be <20%. The % ion ratio was required to be within 50% of the ion ratio for the level 4 calibrant (2.5–62.5 ng/mL in vial concentration). Finally, % accuracy was required to be within ±30% of the nominal value.
The CCV standard (level 4 calibrant) was injected 10 times during the analysis batch of 125 injections, comprising both solvent standards and matrix samples, to assess the method robustness.
The MDL was calculated as prescribed in 40 CFR 136, Appendix B.2 Briefly, 7 blank and spiked samples were prepared and carried through the extraction process for each of the water, soil and fish tissue matrices. MDL spike levels were 0.1x of the level 1 standard for water and 0.5x of the level 1 standard for soil and fish tissues. The higher MDL in either the blank or spiked sample was selected as the initial MDL.
Data processing: Samples were processed with the Analytics module of SCIEX OS software, version 3.1.6. Analyte responses were normalized to their respective extracted internal standards (EIS). PFTrDA was quantified using the average areas of 13C2- PFTeDA and 13C2-PFDoA, as specified. The mean response factor regression was used for calibration curves, based on method requirements. Three replicates of the calibration standards were performed.
Calibration standards: Sensitivity, accuracy, precision, ion ratio and linear dynamic range
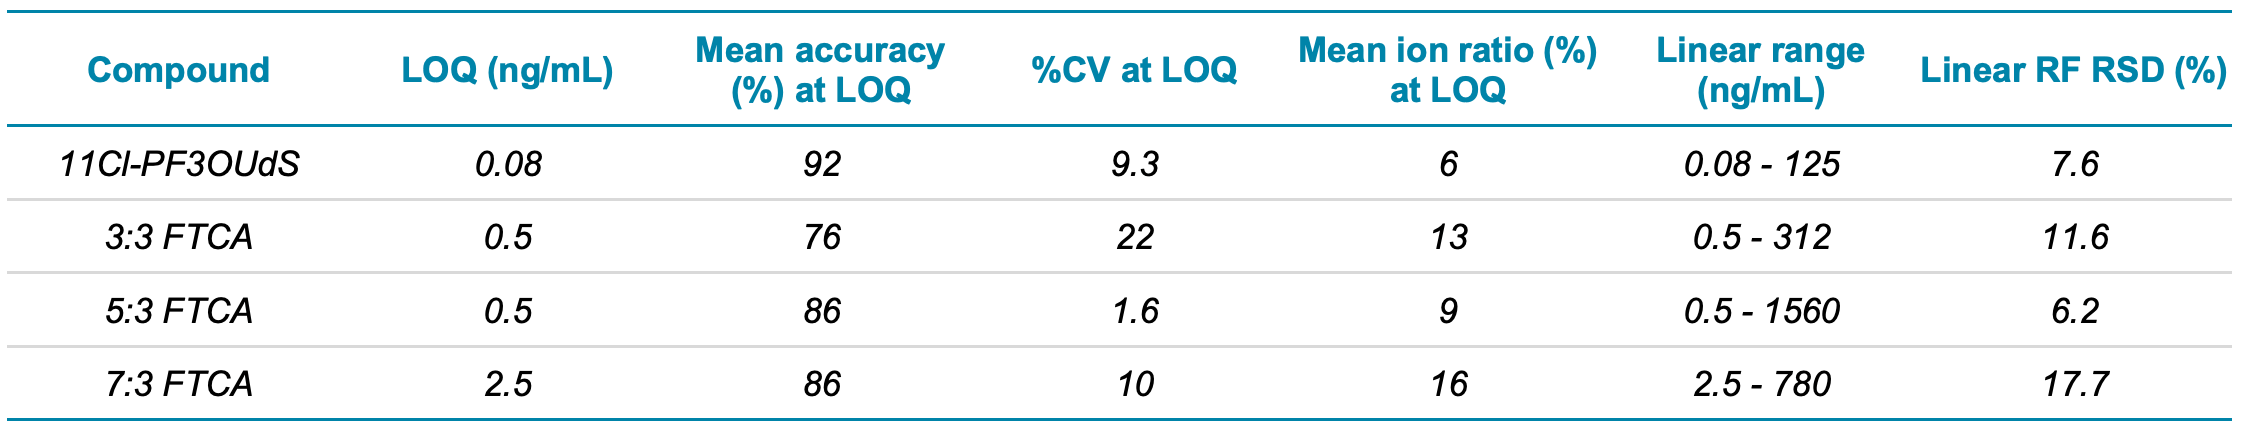
Sensitivity of the calibration standards exceeded the performance described in the EPA Method 1633 document. The LOQ criteria was defined as ±30% accuracy and the ion ratio ±50% of level 4 calibration standard. The observed LOQ concentrations were 0.1x to 0.5x of the EPA level 1 standard, except for PFOSA. LOQs ranged from 0.02–0.1 ng/mL for the PFCAs, PFSAs, sulfonamides, sulfonamide acids and fluorinated ether acids (Table 2). Figure 1 shows representative chromatograms at the LOQ for the new PFAS classes included in the EPA Method 1633. The x:3 FTCAs were prepared at higher levels in the calibration standards and the LOQs ranged from 0.5–2.5 ng/mL.
The calibration curve was run in triplicate to obtain accuracy and precision statistics. At the LOQ concentration, the average accuracy was 106% (76%–128%) and the average %CV was 7% (0.9%–22%), indicating excellent data quality at low levels of quantitation. Observed ion ratios were within 50% of the ion ratios for the level 4 calibrant and linearity (RSD of RF and RR) was below 20% (Table 2).
Table 2. Sensitivity, accuracy, precision, level 4 calibration standard %ion ratio, linear dynamic range and linearity response factor.
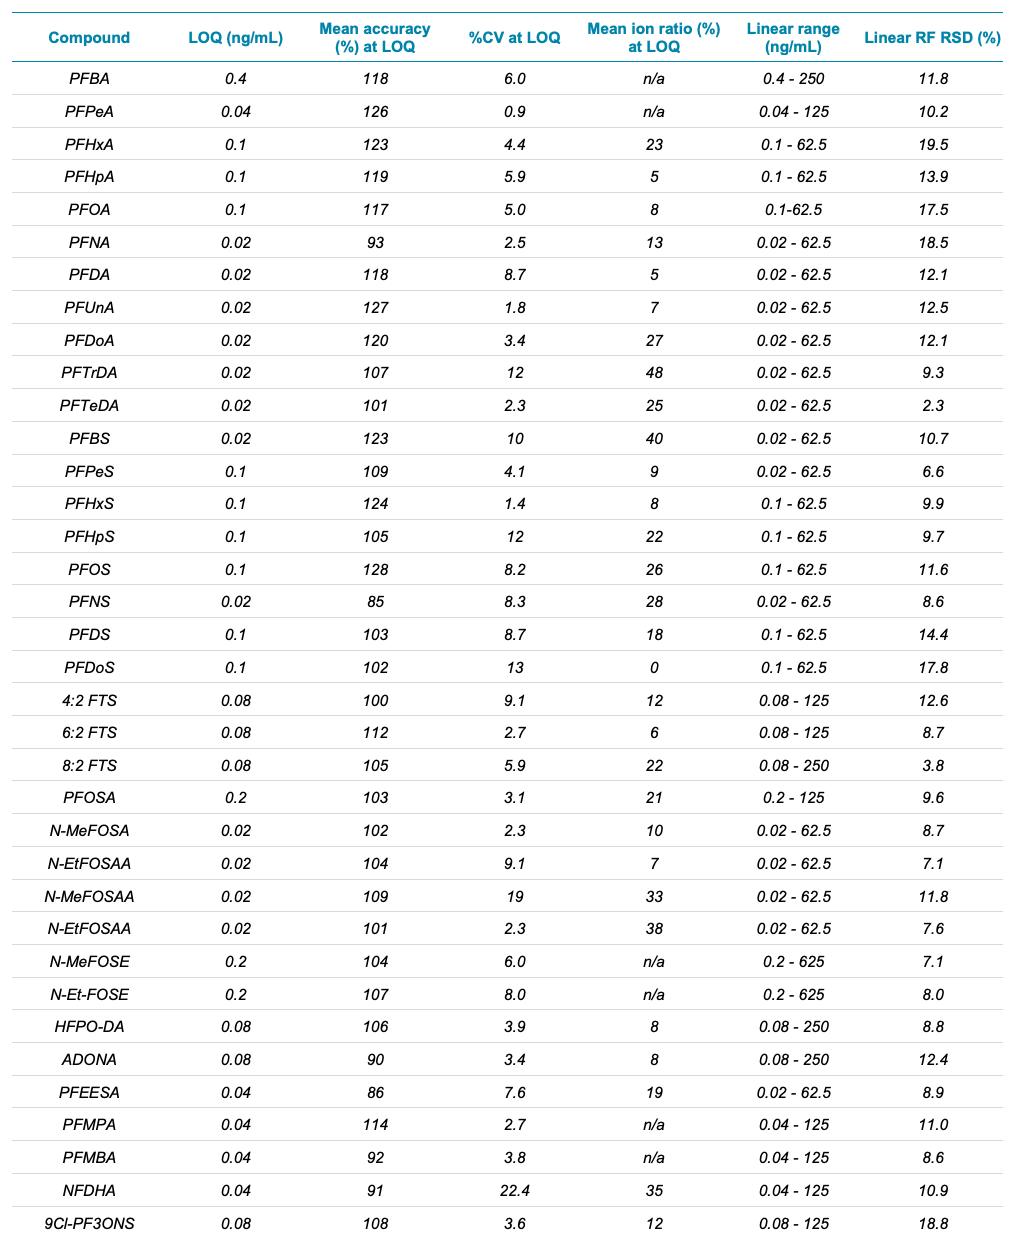
Table 2 (continued). Sensitivity, accuracy, precision, level 4 calibration standard %ion ratio, linear dynamic range and linearity response factor.
Method robustness
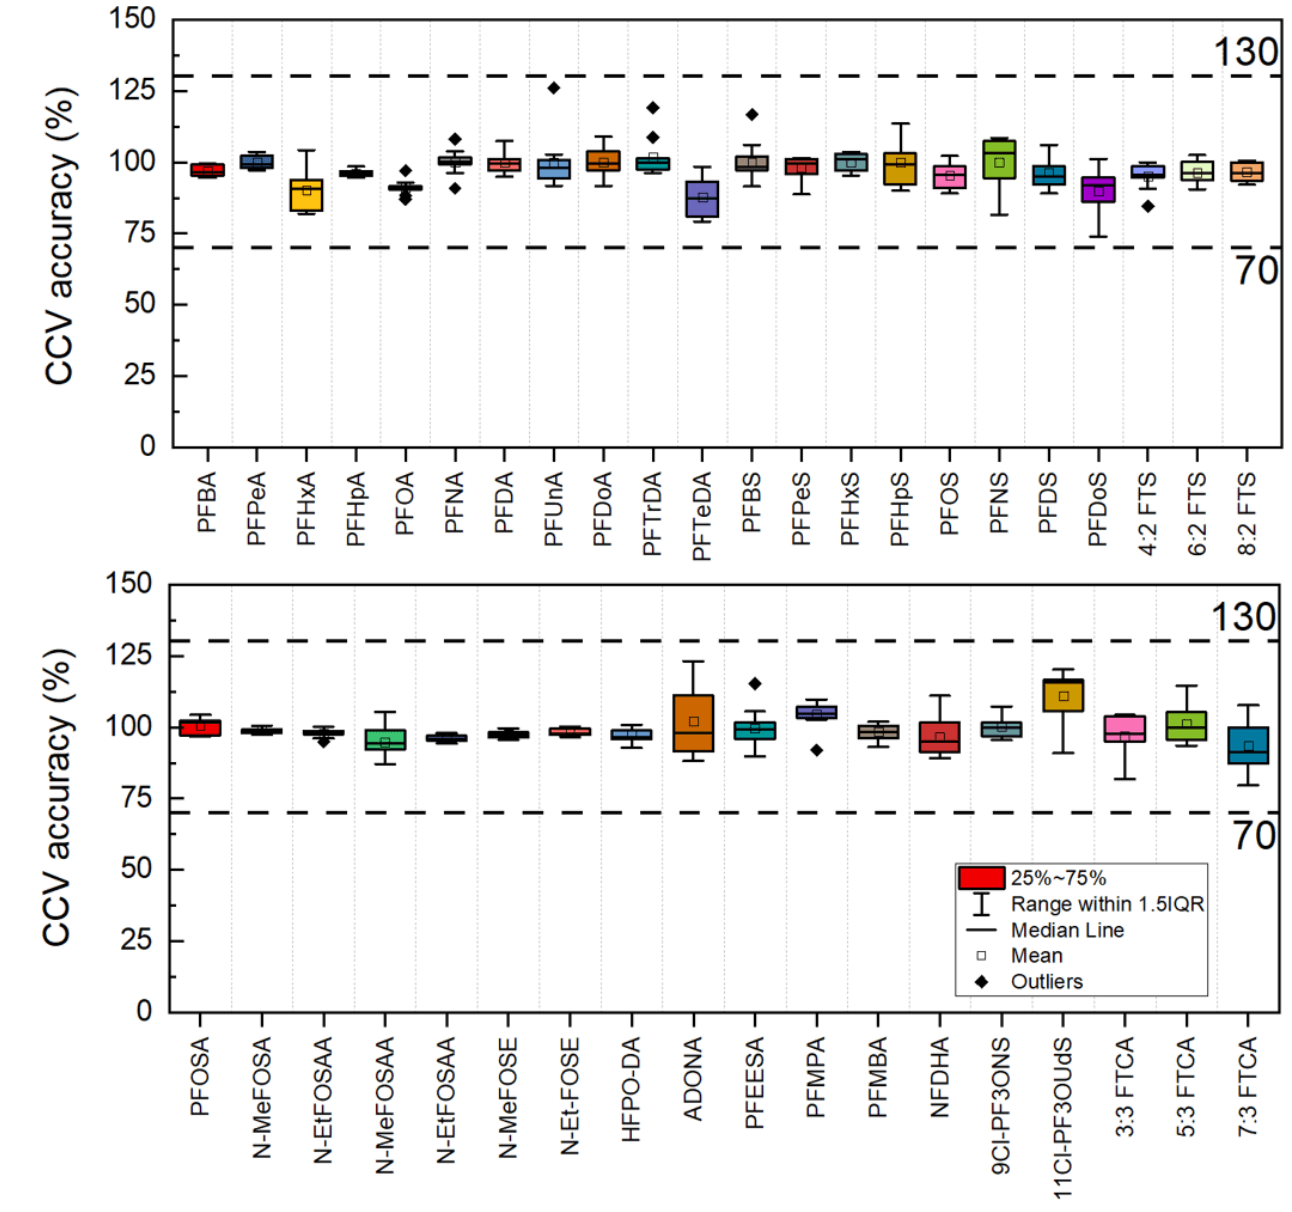
The method showed excellent robustness throughout ~40 hours of continuous instrument analysis and across 125 injections of solvent standards and water, soil and fish tissue. The mean accuracy of the CCV standard (n=10) was 98%, ranging from 88% to 111%. The mean %CV was 4.9%, indicating excellent precision of the CCV standard (Figure 2). These results demonstrate the capability of the SCIEX 5500+ system to analyze the complex matrices included in the EPA Method 1633 with excellent data quality.
Figure 2. Method robustness demonstrated by the CCV standard performance. Mean accuracy (%) and %CV (error bars) of the CCV standard (n=10) were analyzed periodically during the batch of 125 injections.
Method detection limits in soil, fish tissue and water
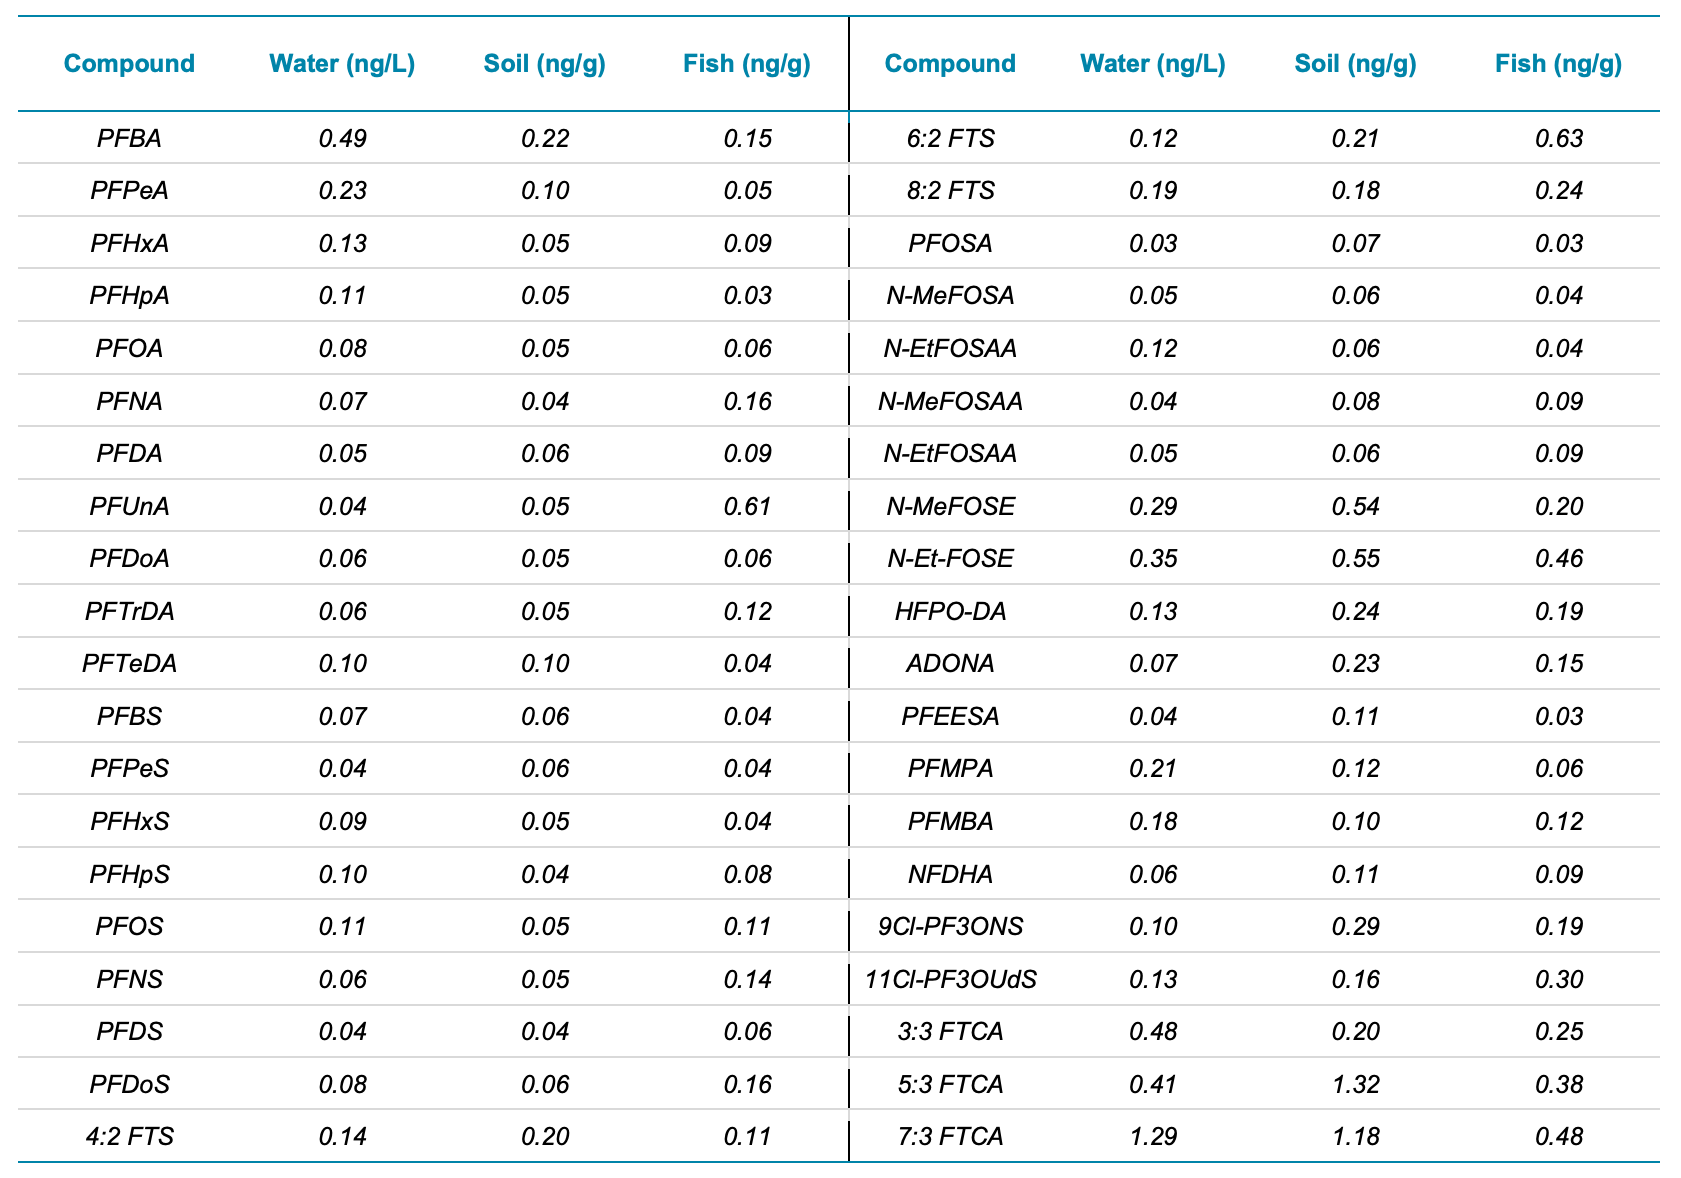
The MDL is defined as the minimum measured level that can be reported with 99% confidence that the measured concentration is distinguishable from the method blank. The MDL must be determined using procedures outlined by the EPA.1 The MDL is a statistic calculated across multiple samples and does not assess raw analyte signal-to-noise. Overall, MDL values for aqueous samples ranged from 0.03–1.29 ng/L in aqueous matrix and met the MDLs specified in the 4th draft of EPA Method 1633 (Table 3). MDL values for soil and tissue samples are tentative at this time and will be updated once the sample preparation procedure is finalized in future EPA Method 1633 documentation.
Table 3. Calculated MDL concentrations for water (ng/L) and tentative MDL concentrations for soil and fish tissue (ng/g).
Bile salts interference check
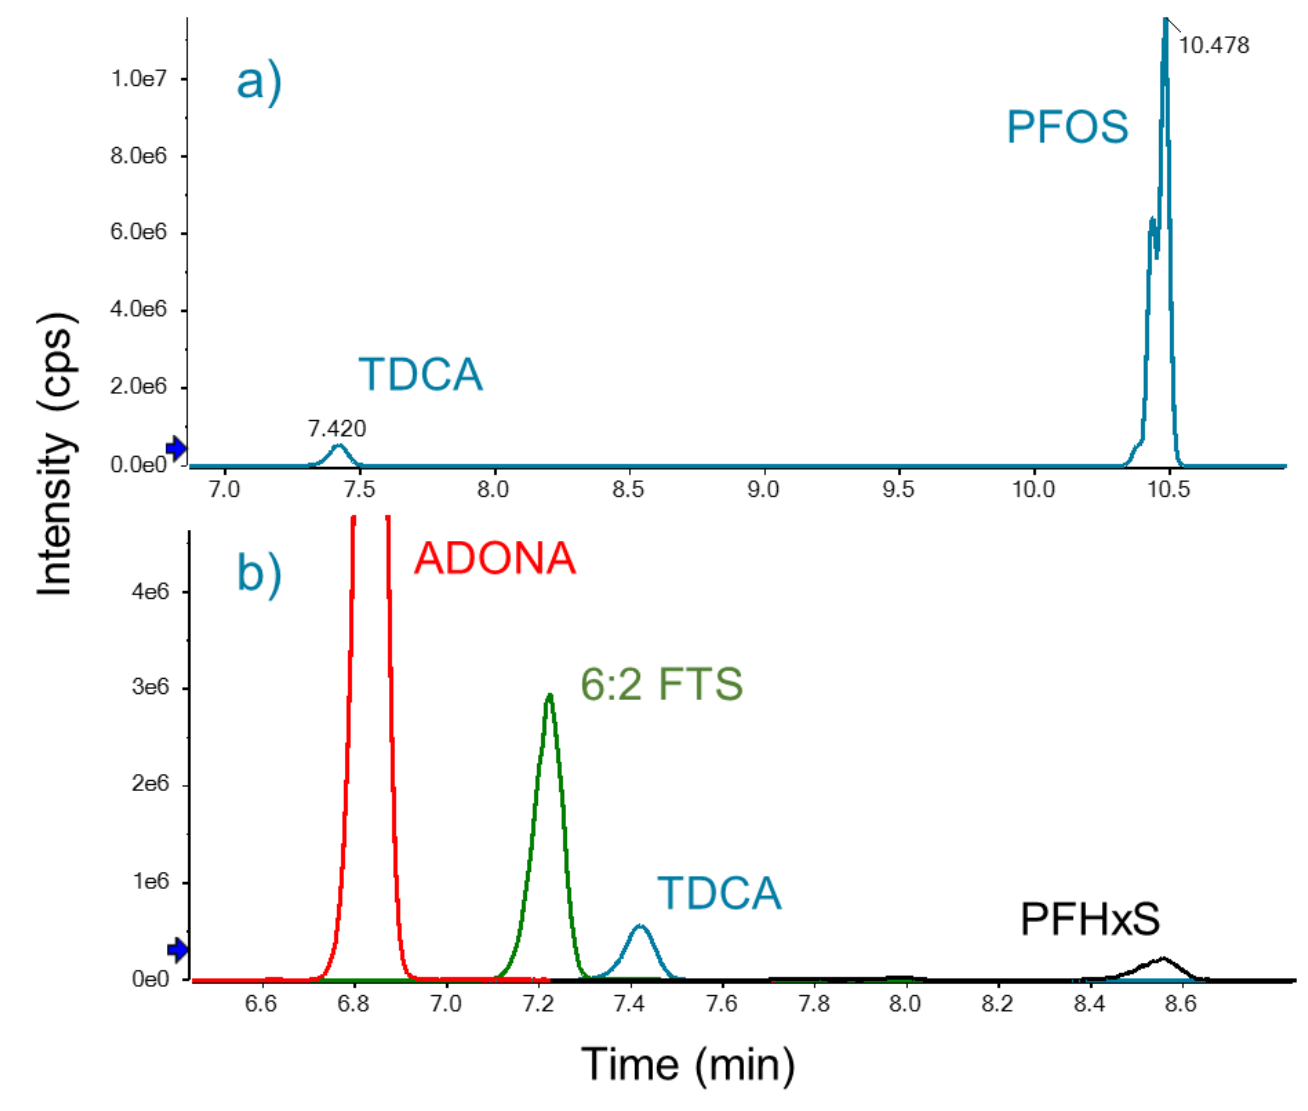
Biological tissues have been shown to contain endogenous interferences for PFHxS and PFOS, which might result in false positives. Specifically, taurodeoxycholic acid (TDCA) is a bile acid with the same m/z 499>80 MRM transition as PFOS and therefore might co-elute depending on chromatographic conditions.3 Therefore, the LC column, mobile phase and chromatographic gradient were carefully chosen to ensure that TDCA did not elute within 1 min of PFOS and to ensure that TDCA did not coelute with any of the target analytes, as established by the EPA Method 1633 requirements (Figure 3). Using this method, TDCA and PFOS were chromatographically separated by ~3 min (Figure 3, top panel). Although the observed chromatographic separation was longer than required, this was necessary to ensure that none of the PFAS analytes coeluted with TDCA (Figure 3, bottom panel).
Figure 3. Chromatographic separation of TDCA bile acid from PFAS analytes. A) TDCA was separated from PFOS by approximately 3 min. B) TDCA did not coelute with any PFAS compounds within a 2 min window. The m/z 499>80 transition is shown for TDCA and PFOS. The quantitation transitions are shown for ADONA, 6:2 FTS and PFHxS.
Accurate quantitation with QC and NIST SRM samples
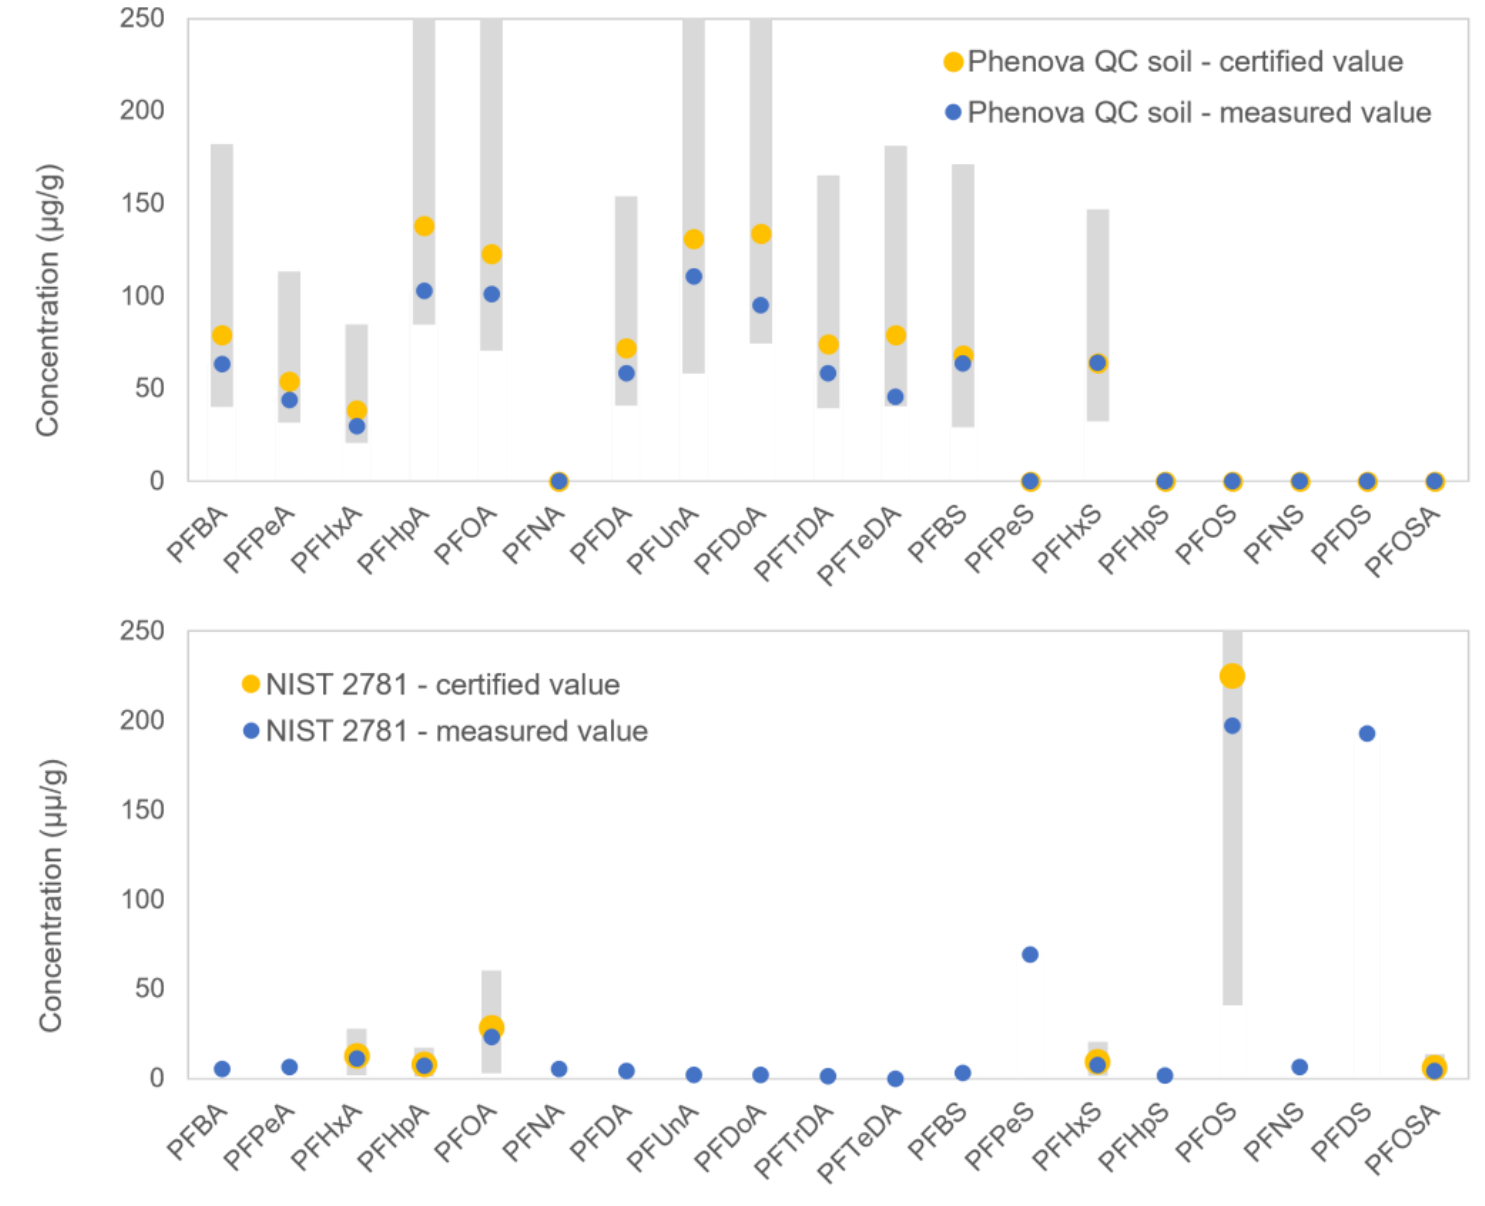
A domestic sludge sample (NIST SRM 2781) and Phenova QC soil sample were analyzed. Our measurement (Figure 4, blue dots) was comparable to and within error of certified values5 (Figure 4, yellow dots). For the NIST SRM, PFPeS and PFDS that were not reported in the literature were also detected in this analysis.
Figure 4. Comparison of measured (blue dots) and certified concentrations (yellow dots) in Phenova QC soil (top) and NIST SRM 2781 domestic sludge samples (bottom). Gray bars represent uncertainties of the certified values.
Near-LOQ level detection in unspiked real-world samples
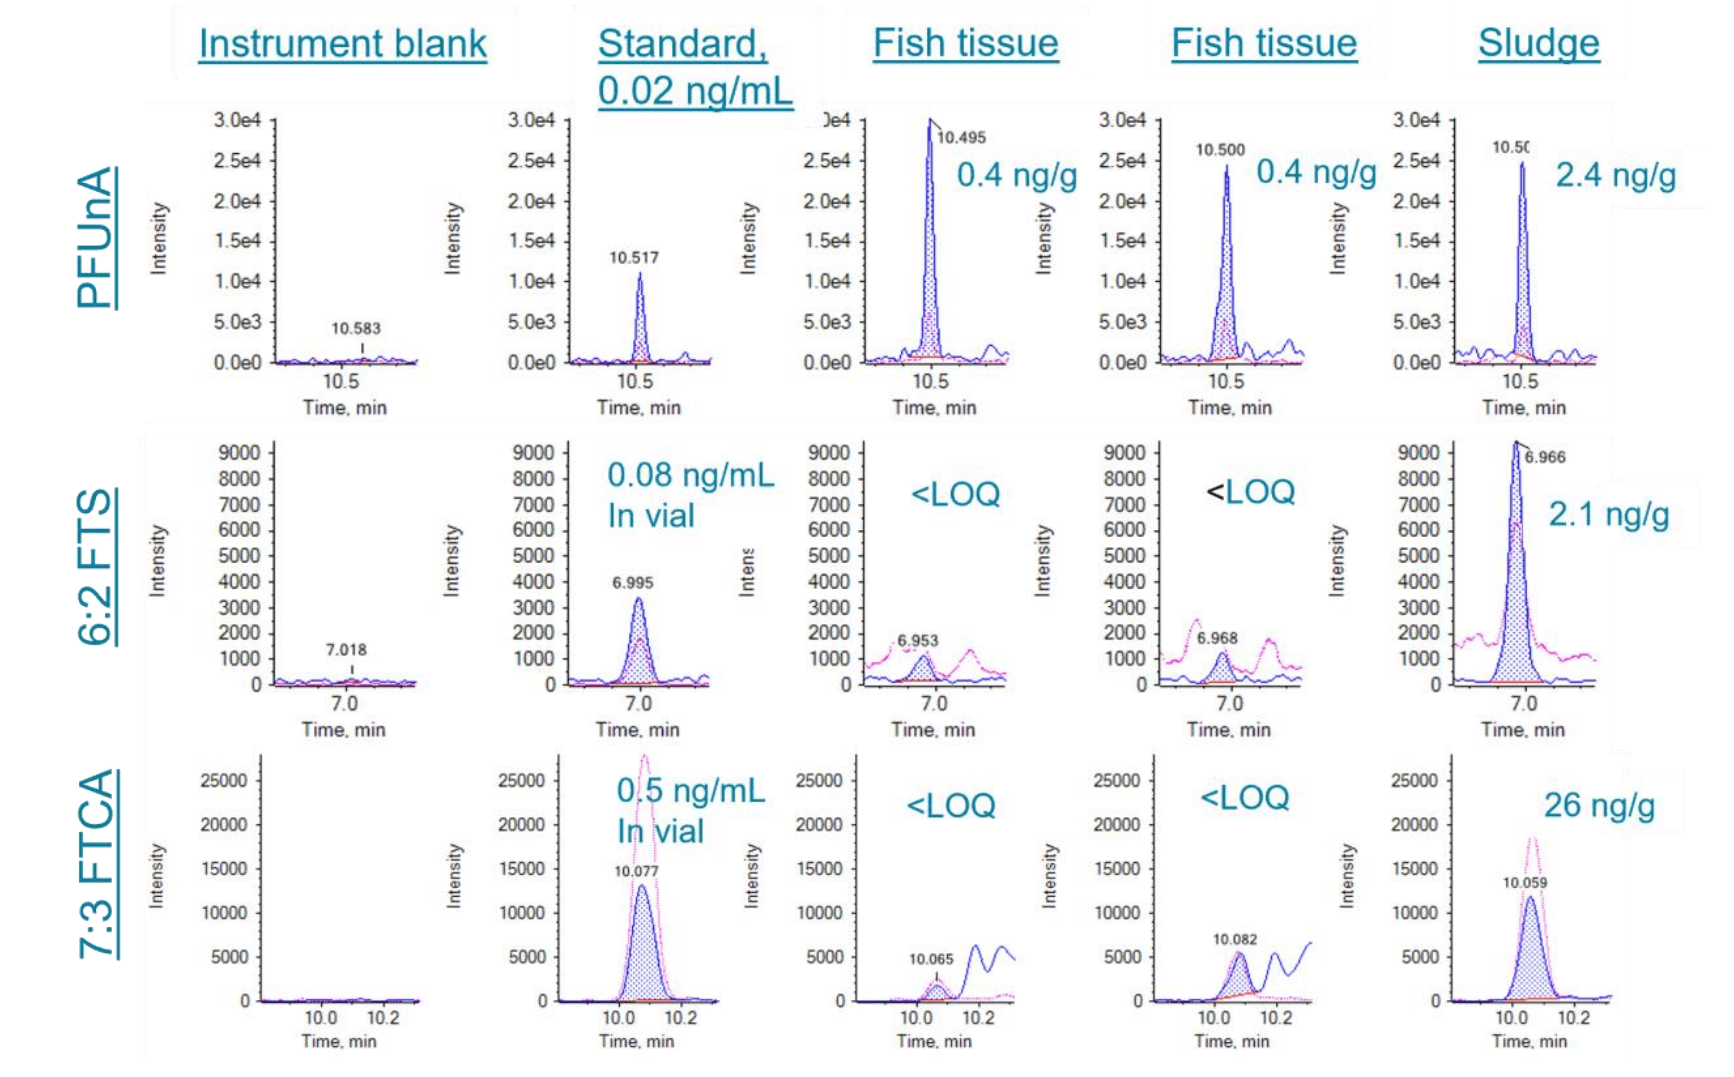
To test the real-world samples, unspiked matrix samples, including well water, groundwater, fish tissues and sludge, were analyzed. A few compounds were detected at near-LOQ level, demonstrating the performance of the method in various matrices. Figure 5 shows example chromatograms of PFCAs in unspiked well water and groundwater samples, which were comparable to the LOQ level standard (0.1 ng/mL in vial). Figure 6 shows example chromatograms of PFUnA, 6:2 FTS and 7:3 FTCA in fish tissue and sludge samples.
Figure 5. Extracted ion chromatograms (XIC) of PFOA, PFHxA, and PFHpA in the lowest calibration point (0.1 ng/mL), method blank, unspiked well water (420 mL) and municipal groundwater (500 mL). Blue trace: XIC of quantitative ion; Pink trace: XIC of qualitative ion.
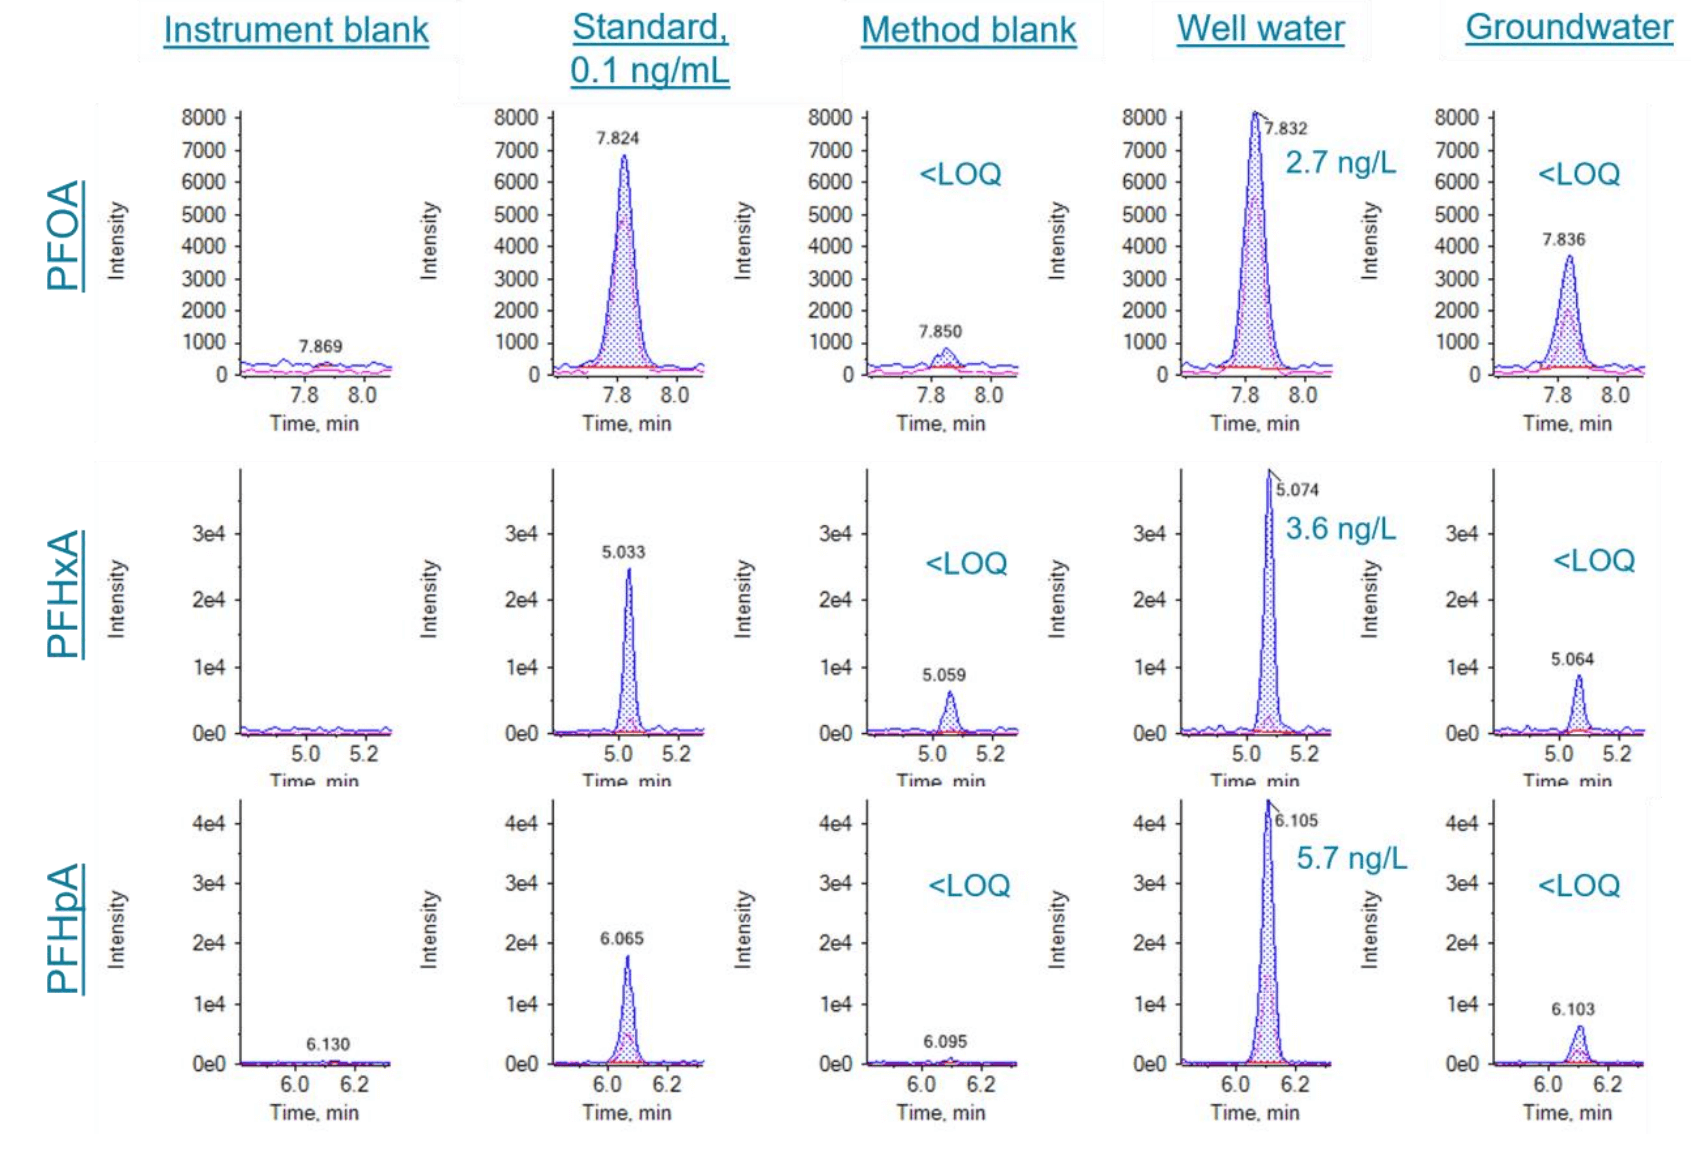
Figure 6. Extracted ion chromatograms (XIC) of PFUnA, 6:2 FTS and 7:3 FTCA in the instrument blank, lowest calibration level (0.02 ng/mL), unspiked fish tissue (2 g) and sludge samples (0.5 g). Blue trace shows XIC of quantitative ion; Pink trace shows XIC of qualitative ion.
Conclusion
This technical note demonstrated the ability to meet the EPA Method 1633 requirements using a method developed on the SCIEX 5500+ system.
- The observed LOQ concentrations were 0.1x to 0.5x of the level 1 EPA standard, except for PFOSA
- Chromatographic separation was achieved to avoid matrix interference by TDCA
- The method showed excellent robustness throughout ~40 hours of 125 continuous injections of solvent standards and matrix samples. The mean accuracy of the CCV standard (n=10) was 98%.
- The accurate quantitation with real-world sample was demonstrated using NIST SRM sludge sample and Phenova QC soil sample
- The performance of the analysis near LOQ level was tested in various real-world unspiked samples
References
- 4th Draft Method 1633. Analysis of per- and polyfluoroalkyl substances (PFAS) in aqueous, solid, biosolids, and tissue samples by LC-MS/MS. U.S. Environmental Protection Agency, Washington, DC, July 2023. EPA Doc. No. 821-D23-001.
- United States Environmental Protection Agency. (2016) Definition and procedure for the determination of the method detection limit, revision 2. EPA 821-R-15-006, 40 CFR 136, Appendix B.
- Benskin JP, Bataineh M, Martin JW. (2007) Simultaneous characterization of perfluoroalkyl carboxylate, sulfonate, and sulfonamide isomers by liquid-chromatography-tandem mass spectrometry. Anal. Chem. 79(17): 6455-6464.
- National Institute of Standards and Technology. (September 15, 2015). Certificate of Analysis. Standard Reference Material 2781.