Global metabolite profiling of leaves and flowers of Ocimum basilicum L. grown in a microcosm under different light wavelengths
Identification of differentially regulated metabolites using SWATH acquisition
Marialuce Maldini1, Kranthi Chebrolu2, Paola Montoro3, Luigi d’Aquino4 and Christie Hunter1
1SCIEX, Italy, 2SCIEX, USA, 3University of Salerno, Fisciano, Italy, 4 ENEA, Portici (NA), Italy
Abstract
As human population growth and urbanization, water scarcity and climate change exert extreme pressure on the world food production capability, indoor plant farming has become an area of intense research. Varying growth conditions and studying the impact on plant macro characteristics as well as changes at the molecular level is key to optimization of plant production. Here a global metabolite profile study was performed on basil plants grown under varied light conditions and the impact on the metabolome in the flowers and leaves was studied. SWATH acquisition was used for data acquisition to ensure confident metabolite identification and reproducible quantification across all samples.
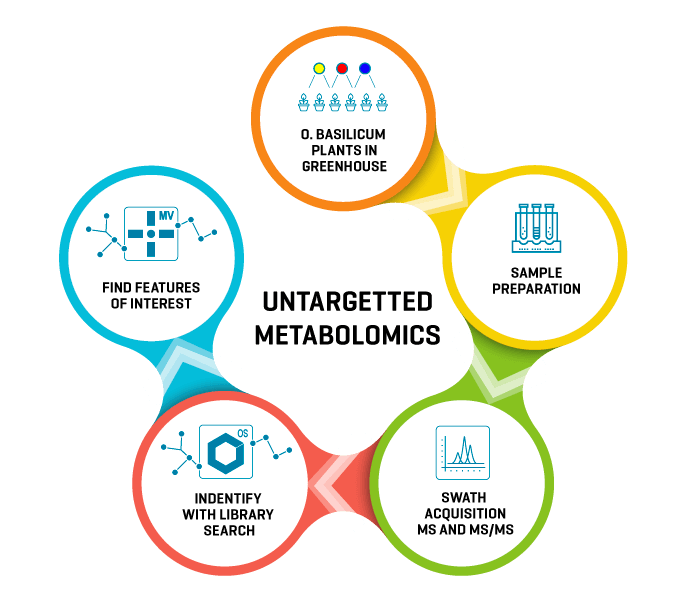
Introduction
Megatrends such as increasing human population and urbanization, water scarcity and climate change have resulted in a decline in fertility and availability of arable land around the world. As a result, plant breeders are increasingly investigating indoor plant farming. Growing plants indoors, however, can be challenging since growth conditions such as soil type, air flow, water and light exposure must be properly provided for optimal plant health. In fact, growing conditions heavily affect many plant characteristics including overall size, nutrient profile, flowering capacity and disease resistance. When observing the impact of these conditions at the molecular level, differences in primary and secondary metabolites can be directly linked with specific growth conditions. For example, plants undergoing drought conditions sense water stress and produce signaling molecules such as abscisic acid.1
In the last decade, many agricultural technologies have been developed to meet the need for growing plants indoors. In the current study, basil plants (Ocimum basilicum L.) were grown from seedling to flowering stages in a new concept microcosm2 (European patent 3236741/2019) in which different light wavelengths were supplied to plants to study the effects on the growth and metabolome of different plant parts. SWATH acquisition was used to generate a comprehensive digital map of the metabolome of each sample. MarkerView software was then used to pinpoint differentiating metabolites (Figure 1) that were subsequently identified using library matching to the Natural Products HR-MS/MS and NIST spectral libraries using SCIEX OS software.3
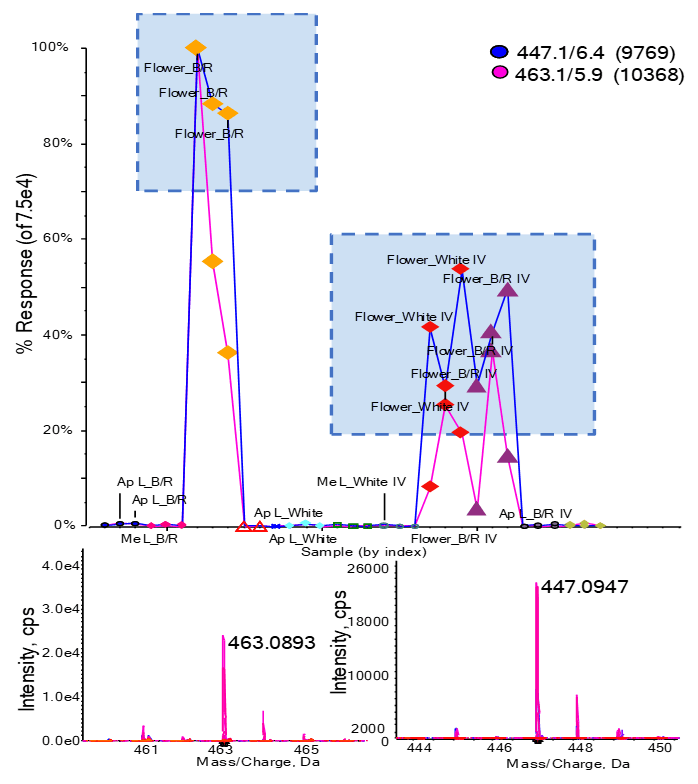
Figure 1. Differential regulation found with principal component analysis. (Top) Responses for m/z 447.1 and 463.1 are plotted for all samples. Both peaks have much higher abundance in flowers than leaves, with flowers from batch 1, grown under blue/red light, exhibiting the highest response. (Bottom) TOF MS data for both features.
Key features of data acquisition and processing workflow
- SWATH acquisition provides high-sensitivity and high-resolution, accurate-mass MS and MS/MS data for quantification and identification in a single injection
- MarkerView software provides statistical data processing with graphical displays to easily pinpoint differentiating features and create interest list
- Natural Products HR-MS/MS spectral library contains high-resolution MS/MS spectra in positive and negative ion mode for the identification of more than 2,500 compounds
- SCIEX OS software and the Natural products HR-MS/MS and NIST libraries have successfully identified key metabolites.
Methods
Sample preparation: Basil plants var. Genovese were grown in the ENEA-FOS microcosm, using 2 separate microcosms. Each device was equipped with 6 cylindrical polycarbonate pots, 60 cm height x 20 cm diameter, spaced about 25 cm from each other. The ratio between the maximum depth reachable by plant roots and the maximum height reachable by plant aerials was about 1.5. The “microcosm white” (W) was equipped on the roof of the epigeal chamber with 8 lamps, each one based on circular printed circuit boards and consisting of 9 white LEDs (Nextsense), whereas the “microcosm blue/red” (B/R) was equipped with 16 lamps, each based on circular printed circuit boards and consisting of 1 LED Oslon SSL LD Deep Blue 450 nm (Osram) and 8 LED Oslon SSL LH HyperRed 660 nm (Osram).
Plants were grown at 18-22°C / 22-26°C (hypogeal/epigeal) and under photoperiod conditions of 16:8 hours, light/dark with a power of 3-4x10⁻⁶ W/nm for both white and blue/red and a PPFD of 160 μmol/m2/s for white and 490 μmol/m2/s for blue/red.
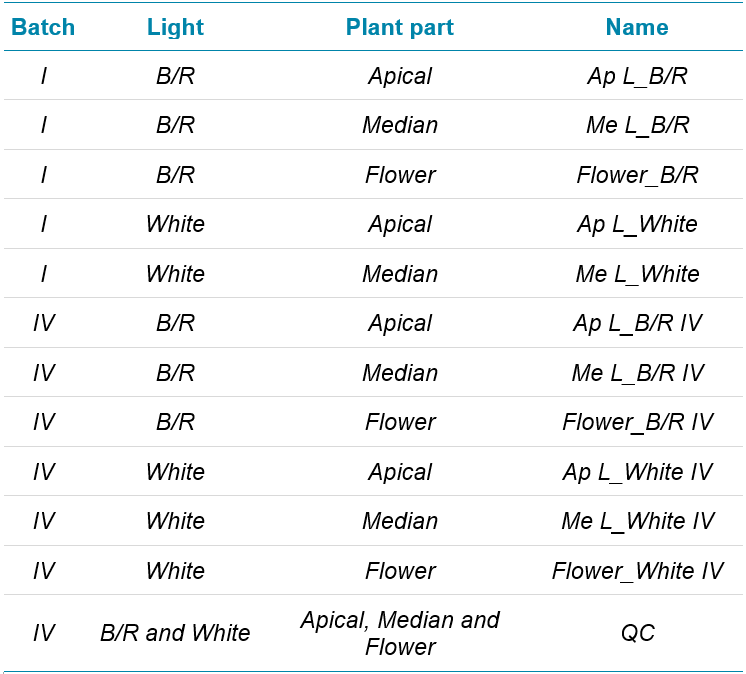
The plants were kept under cultivation for approximately 60 days under either W or B/R light condition. The top leaves (apical, Ap L), middle leaves (median, Me L) and inflorescences (flower) were harvested and extracted with a solution of 1:1, ethanol/water. A Sep-Pak C18 was used to extract chlorophyll. Table 1 lists the samples. Two batches were run (“I” and “IV”), corresponding to 2 different plant source , and each sample was prepared in triplicate. Quality control samples (“QC”) were prepared in triplicate by mixing the extracts from all the plant parts. The QC samples were used to develop and optimize the SWATH acquisition method with variable windows. The final optimized method was then used to acquire all sample data.
Table 1. Basil plant samples.
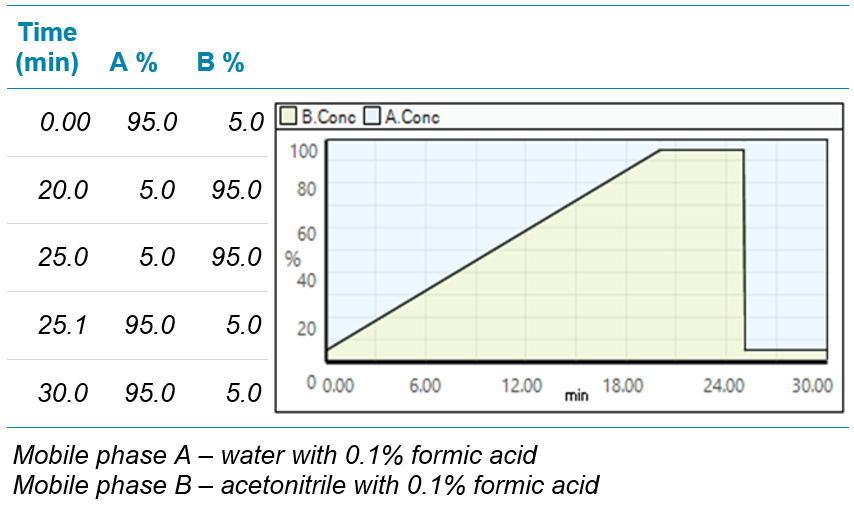
Chromatography: An ExionLC system equipped with an HSS T3 column (100×1.0mm, particle size 1.8μm, Waters) was used for metabolite separation at a flow rate of 0.45 mL/min. The column temperature was 40°C. Injection volume was 5μL in positive ion mode and 8μL in negative ion mode. Gradient conditions are shown in Table 2.
Mass spectrometry: Data were acquired in positive and negative modes using a TripleTOF 6600 system using the data-independent SWATH acquisition approach. The following settings were used: CUR 30; GS1 40; GS2 40; ISV 4500; TEM 500. SWATH acquisition used the following parameters: 25 variable windows, TOF mass range 150-1000 Da; TOF accumulation time 50 ms; MS/MS mass range 50-1000 Da; MS/MS accumulation time 25 ms.
Data processing: Data were processed using SCIEX OS software 1.6 and the Natural Products HR-MS/MS and NIST spectral libraries. Statistical analyses were performed using MarkerView software.
Table 2. Gradient conditions for basil plant metabolite separation.
Comprehensive data collection using SWATH acquisition
Plant metabolomics is a powerful tool for understanding the underlying biological mechanisms that regulate plant growth and stress responses. Ultimately, insights gained from plant metabolomics studies can help to improve crop yield and quality. Plant metabolomes can be extremely complex. While primary metabolites are often conserved across plant species, there is enormous variety in the secondary metabolites and natural products produced by plants, which can complicate analyses.
LC-MS/MS data-dependent acquisition experiments (DDA or DDE) are often used for complex sample analysis, including plant metabolomics studies. Typically, a DDA workflow includes a high-resolution TOF MS full scan, used for differential analysis, followed by a MS/MS scan that is performed based on precursor ion intensity. The MS/MS data is then used to identify compounds with high confidence. Often, the intensity-based stochastic sampling can fail to trigger on low level metabolite ions and thus miss collecting MS/MS scans. Thus, DDA requires long chromatographic separations and multiple injections to obtain MS/MS on a majority precursor ions.
In contrast, the SWATH acquisition system is a data-independent acquisition (DIA) method that acquires high-resolution MS and MS/MS data on all detectable precursors in the sample, regardless of ion intensity. The benefit of this acquisition strategy is that no repeat injections are required, since every TOF MS peak will have associated MS/MS data. The method is sensitive and reproducible and, as used here, provides a comprehensive view of the metabolome from a relatively short 30-minute run.
Identifying differentiating features using MarkerView software
To find differentially regulated metabolites between the plant samples, the TOF MS data from the SWATH acquisition were first processed using statistical tools in the MarkerView software. These tools enable fast discrimination among different sample groups to immediately pinpoint features of interest.
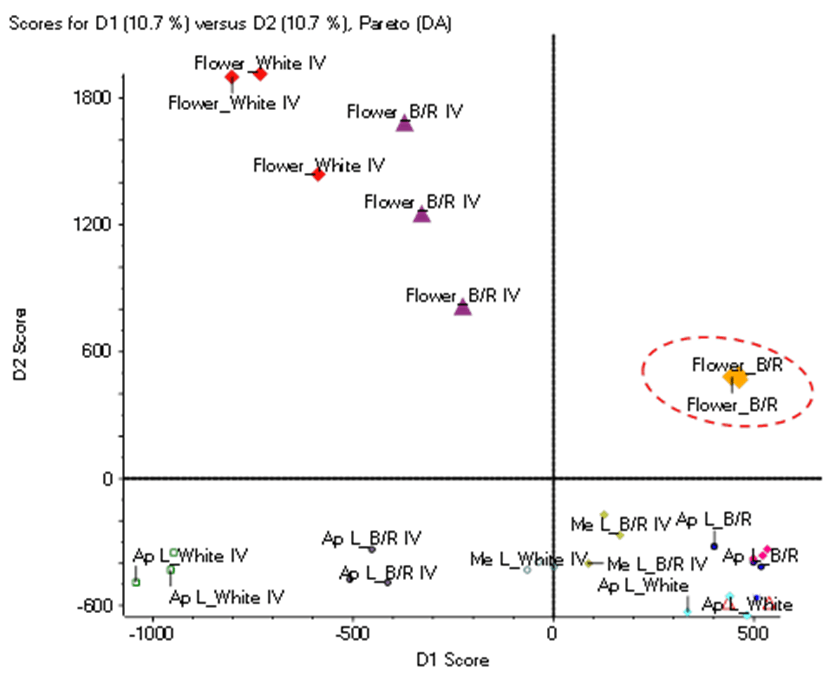
Figure 2 displays the Scores plot for the Partial Least Squares Discriminant Analysis, or PLS-DA, using the TOF MS data from all the samples. Here, the PLS-DA reduces the complexity of multi-dimensional data (in this case, the m/z, retention time and abundance for every TOF MS peak) to allow easier discovery of groups, outliers/markers and trends between samples.4 As shown here, samples are differentiated into groups, with leaf samples segregated below the horizontal line and flower samples above the line. Biological replicates are shown for all sample types and tend to group together with some replicates more closely associated with one another than with other replicates. For example, the flower samples extracted from plants grown under blue/red light (“Flower_B/R”) are tightly grouped and segregated further from other flower samples in the upper right quadrant of the Scores plot (circled in red, Figure 2). These samples are very similar to each other but contain features with abundances that highly differentiate them from other samples.
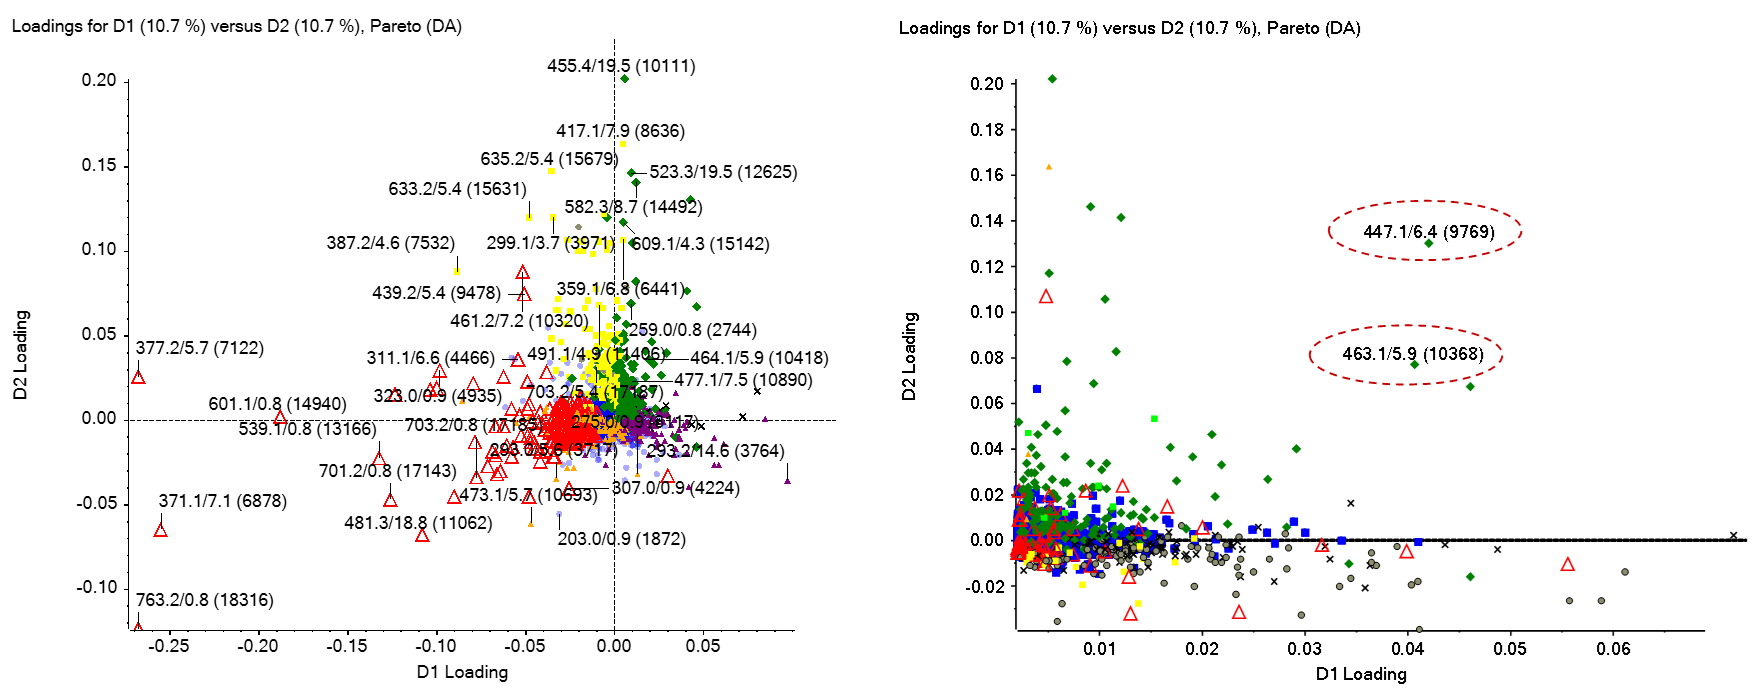
To understand which features are most responsible for the differentiation and separation of sample groups and replicates, the PLS-DA loadings plot was examined. Figure 3 shows the loadings plot for every TOF MS feature plotted within the PLS-DA dimensions, labeled based on their m/z and retention time. Features with higher D1 and D2 loadings are more differentiating. Closer examination of the upper right quadrant shows several features (Figure 3, right) are differentiating for the B/R flower (see Figure 2 scores plot upper right quadrant. The responses for all sample types for 2 of these peaks (“447.1/6.4 (9769)” and “463.1/5.9 (10368)”) are shown in Figure 1. Both peaks are observed with much higher abundance in flower than in leaf samples, with the highest response observed for flowers extracted from plants grown under blue/red light in batch 1. Differentiating features identified from the various PLS-DA quadrants were added to an interest list for further analysis.
Figure 2. PLS-DA Scores plot. Clear separation between the sample types is observed, as all leaf samples are found in the lower half of the plot and all flower samples are in the upper half. The “Flower_B/R” samples in the upper right quadrant, circled in red, are tightly grouped and separated from other flower samples. These samples are investigated further to identify differentiating features between samples.
Figure 3. PLS-DA Loadings plot. (Left) All peaks from the TOF MS data are shown in the PLS-DA loadings plot and provide rationale for the sample separations observed in the Scores plot (Figure 2). Peaks observed in the lower half are more abundant in leaf samples, while peaks in the upper half are more abundant in flower samples. (Right) The upper right quadrant is expanded in the right panel to show peaks responsible for separating “Flower_B/R” samples from other samples. Two peaks strongly differentiating the Flower B/R samples from others are circled and added to an interest list for identification (Figure 5).
T-test analysis
Whereas the PLS-DA groups samples into categories and finds differentiating features that contribute to these groupings, the pairwise t-test finds features that are discriminatory between 2 groups of samples. This can be useful when datasets are complex with many samples and sample types. Here, the pairwise t-test can often narrow down specific features that are more relevant between individual groups.
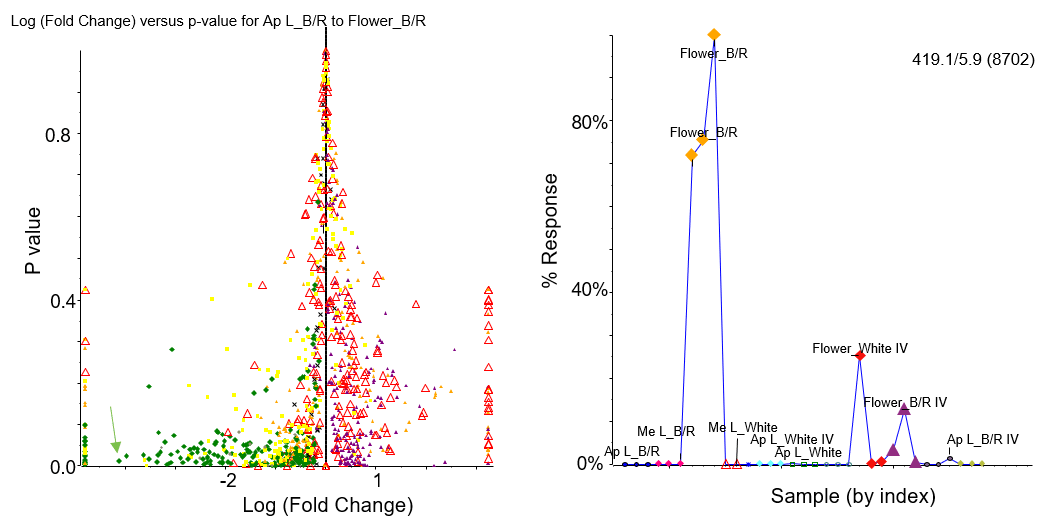
Figure 4 shows the pairwise t-test for 2 groups from batch 1, specifically the apical leaf samples grown under blue/red light (AP L_B/R) and the flower samples grown under blue/red light (Flower_B/R). The top panel shows all the data, such that features with a low p-value and high fold change are ones that differ in abundance between the groups with high confidence; these can be selected and added to an interest list for identification. The profile plot for one of these features, “419.1/5.9 (8702),” indicated by the green arrow is shown in the bottom panel of Figure 4 for all sample types and growth conditions. This peak is much more abundant in flower samples grown using either blue/red light or white light, than leaf samples grown under any conditions.
Figure 4. Pairwise T-test. (Top) The pairwise t-test comparing apical leaves grown under blue/red light (AP L_B/R) and flowers grown under blue/red light (Flower_B/R) is shown. Statistically significant peaks (low P-value) are selected from the graph with a large fold change (absolute value) and are added to an interest list for identification (Figure 5). (Bottom) The profile plot for the peak with m/z 419.1 is shown across all samples where the percent response (percent peak area) is much higher for flower samples versus leaf samples.
Identifying metabolites using library matching
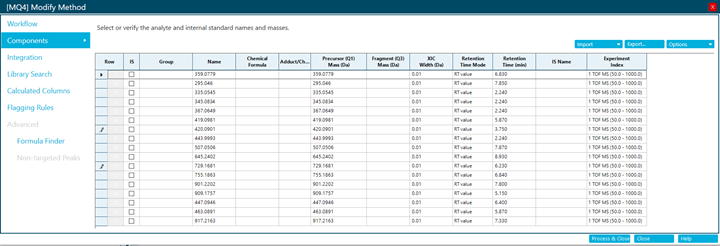
The PLS-DA and t-test analyses is performed on the TOF MS data and the features at this point are just m/z and retention time pairs. Therefore, additional processing steps are necessary to identify the metabolites that may be differentially regulated. The workflow used here was streamlined so that only features that were found statistically significant (p value ≤ 0.05, and fold change) using the statistical tools in the MarkerView software were advanced for further data processing. Here, an interest list is used to capture all relevant features that meet the set criteria of being both different between conditions and statistically significant. These features are added to the interest list by selecting them directly from an analysis graph (for example, PLS-DA or t-test) or by adding them manually. Figure 5 shows an interest list containing peaks selected from either the PLS-DA or t-test analysis.
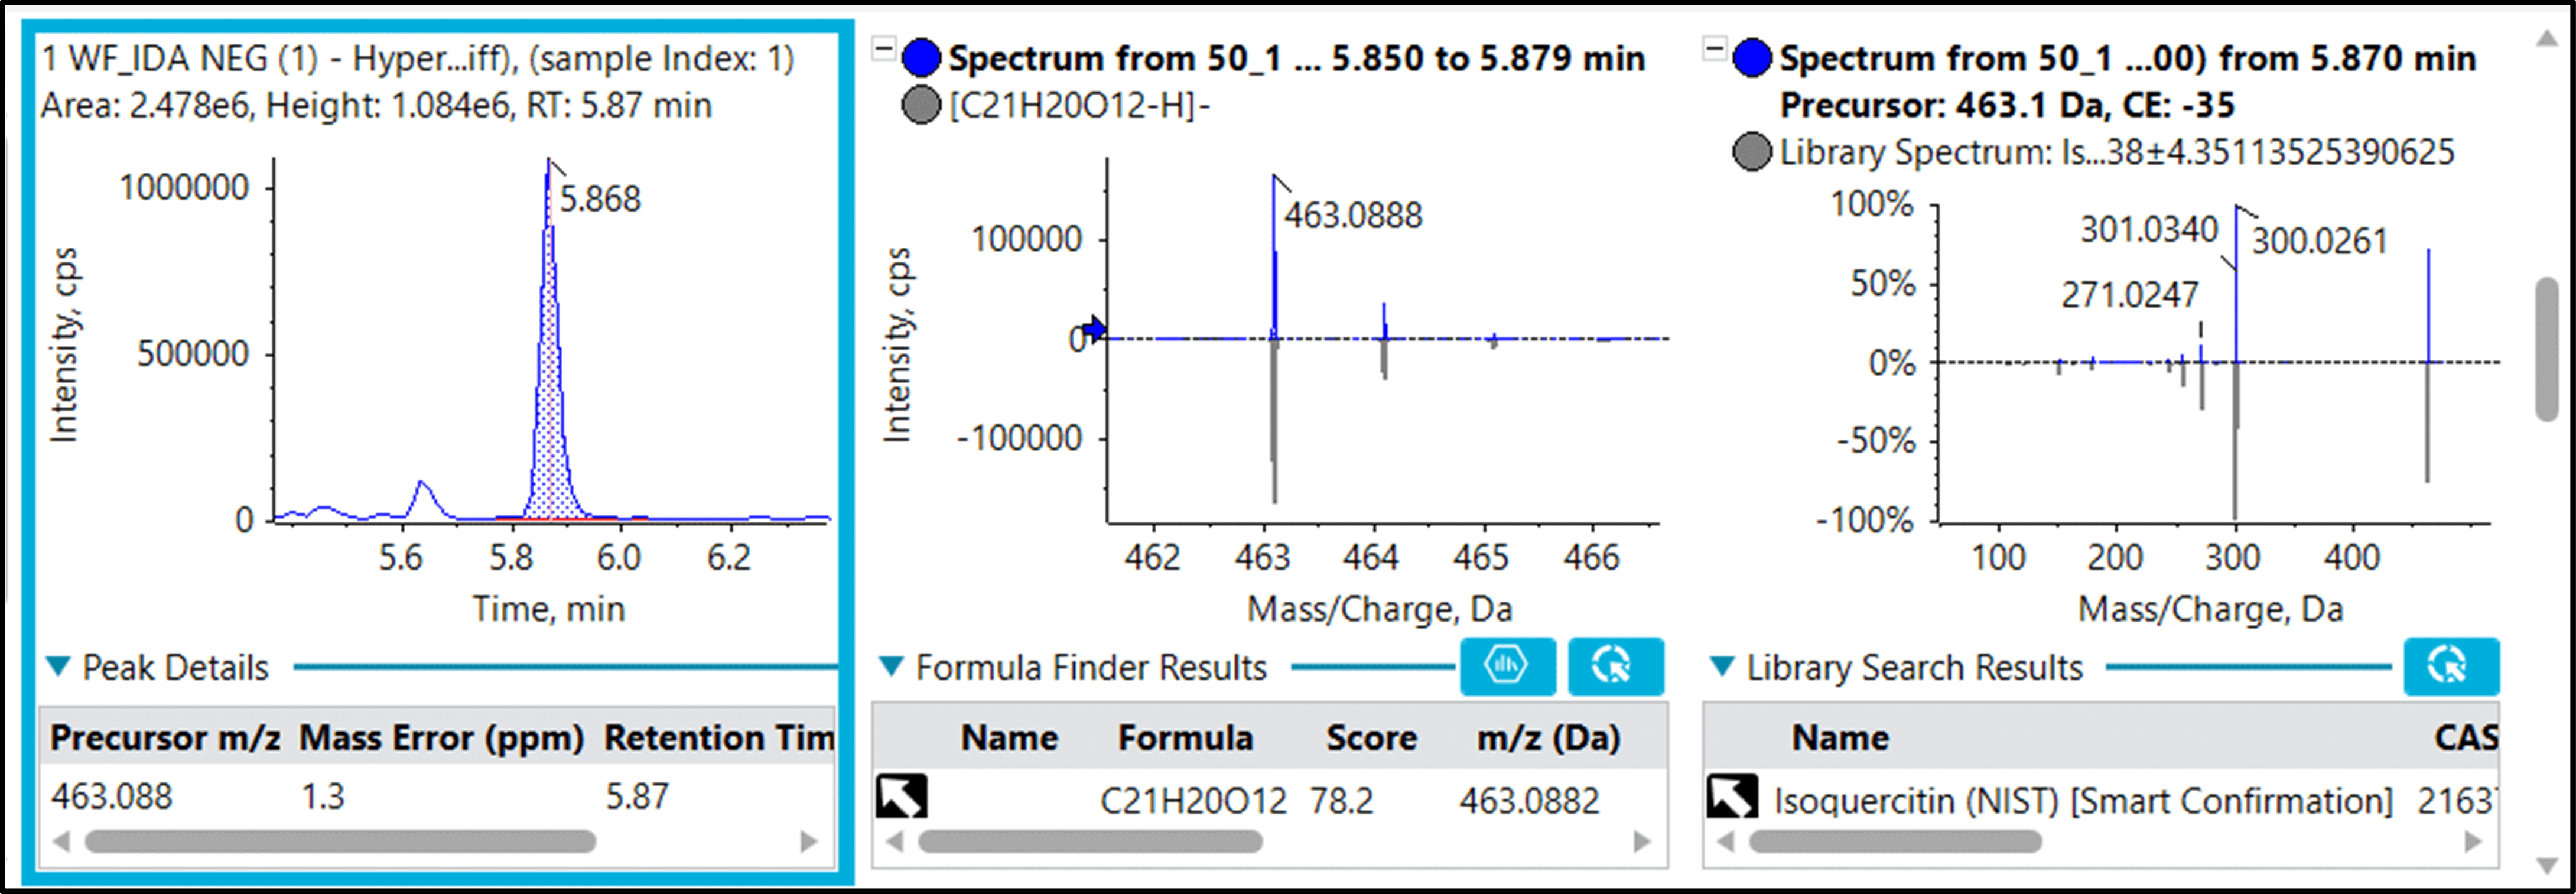
Figure 6 shows the identification of hyperin (isoquercitin) as one of the features that exhibited discriminatory properties between flowers and leaves based on the PLS-DA (Figure 3). Hyperin is a bioflavonoid have shown that it may have antioxidant, anti-inflammatory, anticancer, antiviral, antibacterial, antiparasitic, cardioprotective and hepatoprotective activity.5 Higher levels of hyperin were found in flowers as opposed to leaves in this study.
The SWATH acquisition data contains all the information required for identification, therefore enabling any feature of interest to be directly identified using the embedded MS/MS data. As shown in Figure 6, multiple lines of evidence support the identification including (1) retention time, (2) precursor ion and fragment ion mass error, (3) isotope pattern and (4) MS/MS library match.
Figure 5. Interest list for metabolite identification. With the streamlined workflow used here, only those features that were found to be differentiating between the various samples using MarkerView software were added to the interest list for identification. The interest list can be generated by directly selecting features from a graph (for example, from a PLS-DA or t-test plot) or adding them manually. These features can then be imported into SCIEX OS software for identification, by searching and matching the TOF MS and underlying MS/MS data to a library of compounds. |
Figure 6. Identification of hyperin (isoquercitin), a differentially regulated metabolite. Library matching of the 463.1/5.9 (10368) feature found in PLS-DA using SWATH acquisition data shows identification of isoquercitrin with high confidence. Multiple levels of matching are used, including the retention time (left), the precursor mass, isotope data and low mass error (center and bottom left), and the MS/MS spectrum and library match (right).
Conclusions
In this study, basil plants were grown under different light exposure conditions in a new concept microcosm to examine the metabolic changes that occur in different plant parts. SWATH acquisition, MarkerView software6 and library matching using the Natural Products HR-MS/MS spectral library7 and NIST spectral library provided a streamlined workflow for the discovery of differentially regulated plant metabolites.
- SWATH acquisition for untargeted plant metabolomics provides complete datasets with high-resolution MS and MS/MS data for every precursor in a sample using a single injection workflow
- MarkerView software provides flexibility in the usage of various multivariate statistical analysis and plot generation tools (PCA, PLS-DA, t-test) to distinguish classes, find interesting features/biomarkers and highlight trends
- “Select and click” creation of an interest list directly from statistical graphs provides effortless transfer of interesting features from MarkerView software to SCIEX OS software for library matching
- Library matching of the target list to the Natural Products HR-MS/MS and NIST spectral libraries uses multiple lines of evidence embedded in the SWATH acquisition data for compound identification.
References
- Xinyi Y et al. (2021) Response Mechanism of Plants to Drought Stress. Horticulturae 2021, 7, 50.
- “Innovation: ENEA “Microcosm” arrives on the market thanks to FOS” 3/18/2021.
- d’Aquino L. et al. (2015). Un microcosmo per l’allevamento di piante in condizioni controllate. Energia Ambiente Innovazione – Speciale III-2015 ENEA per EXPO 2015, 98-99.
- d’Aquino L et al. (2018) A new concept field simulator to grow plants in unconventional sites. Proceedings of the Joint AgroSpace-MELiSSA Workshop - Current and future ways to Closed Life Support Systems, Rome, Italy 16-18/05/2018, p. 162.
- Patel K et al. (2018) New insights into the medicinal importance, physiological functions and bioanalytical aspects of an important bioactive compound of foods ‘Hyperin’: Health benefits of the past, the present, the future” Beni-Suef University Journal of Basic and Applied Sciences, 7(1), 31-42.
- MarkerView software - SCIEX community posts.
- Natural Products HR-MS/MS Spectral Library 1.1.
 Click to enlarge
 Click to enlarge
 Click to enlarge
 Click to enlarge
 Click to enlarge
 Click to enlarge
 Click to enlarge
 Click to enlarge