- Home
- Productos de ciencias biológicas e investigación para espectrometría de masas
- Spectral Libraries
- Accurate Mass Metabolite Spectral Library
Accurate Mass Metabolite Spectral Library
For research use only. Not for use in diagnostic procedures.
The Accurate Mass Metabolite Spectral Library is a validated and highly curated collection of high resolution, high mass accuracy MS and MS/MS spectra of natural and non-natural products, common drugs, and metabolites. Created using the TripleTOF® LC-MS/MS system, the library contains over 500 compounds to help you identify and confirm known metabolites with the highest confidence.
- For Targeted Metabolite Screening – Designed to enable targeted screening of known metabolites/pathways from your discovery experiments on the TripleTOF system.
- Unambiguous Identification – The Metabolite Library uses high mass accuracy MS and MS/MS spectra, retention time information, and isotopic information to definitively identify and confirm compounds.
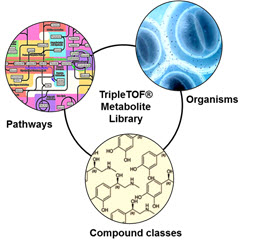
- A Well Rounded Library – With over 500 compounds, the Accurate Mass Metabolite Spectral Library contains spectra from many compound classes, pathways, and organisms.
Status: Available

A Highly Curated Database
The Accurate Mass Metabolite Spectral Library was developed in collaboration with the University of Geneva and contains a highly curated collection of high resolution accurate mass spectra from over 500 compounds specifically chosen for inclusion in the database. With the flexibility to use either IDA or SWATH® acquisition data from the TripleTOF® System, information can be extracted for known metabolites individually or across compound classes, metabolic pathways, or organisms.

Compound Classes
- Natural products and non-natural products, common drugs and metabolites including amino acids, organic acids, sugars, phenolics, small acids, fatty acids, sugar phosphates, common lipids, vitamins, dicarboxylic acids, organic amines, nucleosides, nucleotides, bile acids, flavanoids, carbohydrates, xenobiotics
- and more…
Pathways
- TCA cycle
- Pentose phosphate pathway
- Glycolysis & Gluconeogenesis
- Amino acid/BCAA synthesis/metabolism
- and more…
Organisms
- Human
- Rat
- Mouse
- Plants
A Short Cut from Discovery to Biological Conclusions
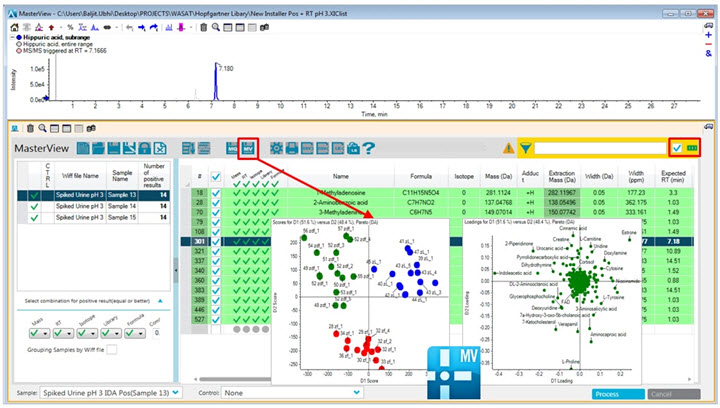
The Accurate Mass Metabolite Spectral Library is a database of MS and MS/MS spectra designed to aid in targeted metabolite screening. By removing the bottleneck of metabolite identification, data processing is quick using the library and MasterView™ Software. Data is quickly turned into knowledge with fast and easy data visualization, targeted review, and a simple transition for quantitation and statistical data analysis with MultiQuant™ Software and MarkerView™ Software.

Figure 1: After identifying metabolites with the Accurate Mass Metabolite Spectral Library in MasterView Software, continue your data analysis in MarkerView Software. In the PCA scores plot there is a difference between the sample groups analyzed (groups highlighted in red, green and blue). In the accompanying loadings plot, which normally shows features as m/z - retention time pairs, the ions are already identified from the Accurate Mass Metabolite Spectral Library, thus instantly enabling biological interpretations. Now a user can read the loadings plot with a metabolite or entire pathway in mind when investigating the differential regulation of metabolites. In this case proline (an amino acid) is increased in the red group whereas cinnamic acid is decreased in this group.
 Download Now
 CONTACT SUPPORT