XCMSPlus Software
For research use only. Not for use in diagnostic procedures.
XCMSplus software is a powerful solution for the analysis of untargeted metabolomics data. It uses retention time alignment, feature detection and matching, as well as statistical analysis to identify up- and down-regulated endogenous metabolites without the need for internal standards. Backed by intuitive visualization tools and a database containing over 240,000 analytes, XCMSplus software can identify even rare metabolites with high confidence.
- One Powerful Solution - Raw data processing and retention time alignment are combined with statistical analysis tools for identification of important up- and down-regulated metabolites across sample sets simultaneously
- An Interactive Workspace - A single intuitive workspace enables simplified data processing and visualization
- A Proven Track Record - With over 6000 users, XCMS is the most cited metabolomics software package for finding and identifying metabolites, and moving your research to the next level

Streamlined data processing and visualization
XCMSplus software directly processes SCIEX LC/MS and LC/MS/MS *.wiff data files for feature detection and comparison. With the ability to process multiple jobs all at once, the software provides a single interactive workspace for monitoring job status and for reviewing results.
Figure 1: XCMSplus software workspace.

A single interactive workspace: Multiple jobs can be submitted at once and their status monitored within a single interactive workspace. Extracted ion chromatograms, spectrum details, interactive plots, and statistical data visualization plots are all easily accessible within the workspace.
Powerful algorithms and graphs
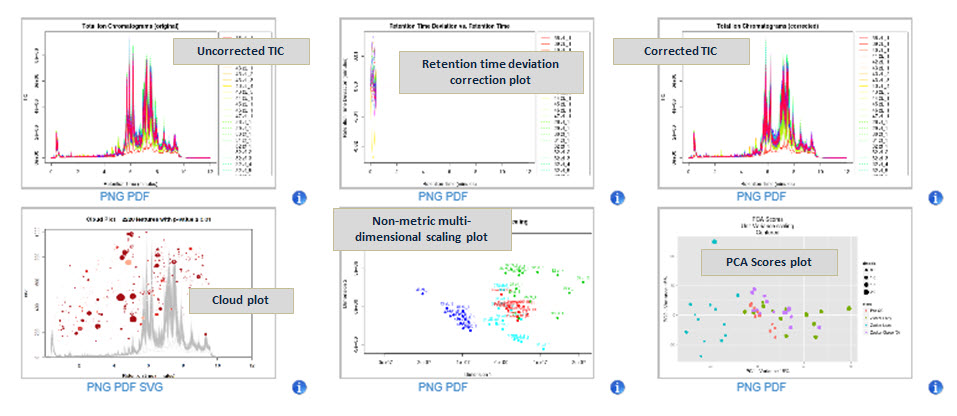
Simultaneous quantitation and identification of 1000s of features across 10s of data files requires powerful algorithms for turning raw data into relevant biological conclusions. Accordingly, the data can be displayed in a variety of plots for visualization and interaction.
Principal Component Analysis (PCA) results: In the study at right, the data from three rat phenotypes (lean, fatty, and obese) were compared using Principal Component Analysis. The sample clustering by phenotype indicates the presence of differentially regulated metabolites between the groups.
Figure 2: XCMSplus software PCA results.

Figure 3: XCMSplus software Cloud Plot.

Cloud Plot results: A Cloud Plot displays features whose intensities are altered between sample groups. Up-regulated features are represented as circles on the top of the plot and down-regulated features are represented as circles on the bottom of the plot, where the size and the degree of color saturation corresponds to the (log) fold change of the feature. Circles with black outlines indicate hits in the METLIN database. The lighter or darker the color of the circle relates directly to the significance of the p-value. The cloud plot is completely interactive, where you can filter p value, m/z value, as well as retention time to allow the viewer to see more/less features based on filtering criteria.
METLIN database
The METLIN database is a library containing over 240,000 metabolites, with mass, chemical formula, and structural data available. It also contains high resolution MS/MS data for thousands of these metabolites and has the capability to accept new user data.
XCMSplus - optimized for global metabolomics screening
Large data files are typical for global discovery experiments. XCMSplus software can accelerate project completion time from weeks to days with local processing and batch analysis. With unlimited data storage capacity, unlimited data sharing capacity, and the security of a local desktop package, XCMSplus offers the complete solution for metabolomics research.