Abstract
This technical note demonstrates a sensitive profiling method for analysis of secreted metabolites in cell culture media. Over 110 cell culture metabolites were monitored in under 20 min using a single method featuring fast polarity switching on the SCIEX 7500 system. Statistically significant quantitative trends demonstrated which components were upregulated or downregulated over the cell growth stages.
Introduction
Human adipose derived stem cells (hASCs) are multipotent cells capable of differentiating into multiple cell lineages. Unique ability of hASCs to specialize into specific cell types when placed under select experimental conditions has increased their functional importance in regenerative medicine. hASCs secrete various metabolites that can affect cellular function and activity. Therefore, secretome analysis of hASCs has become a key procedure in the development of cell and/or tissue based therapeutics for regenerative medicine to monitor their therapeutic potential.1
Common approaches for the secretome analysis, such as, NMR and IR are unable to provide a comprehensive analysis of the secreted metabolites. Considering the multitude of possible secreted metabolites, LC MS/MS provides a strong solution with high sensitivity, selectivity, speed and robustness enabling profiling of multiple analytes using a single analytical platform.2
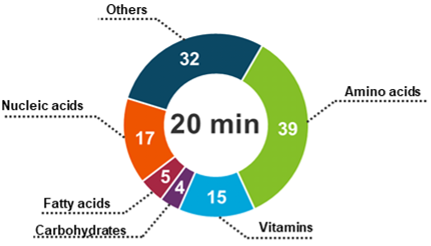
Herein, a comprehensive profiling of cell culture metabolites secreted from hASCs was performed using a highly sensitive LC-MS/MS workflow (Figure 1). Over 110 cell culture analytes were monitored under a 20 min run time using the SCIEX 7500 system.
Key features of the cell culture media analysis workflow for secreted metabolite profiling on the SCIEX 7500 system
- Achieve sensitive profiling of over 110 cell culture metabolites secreted from hASCs in under a 20 min run time
- Utilize a single platform method with fast polarity switching for comprehensive analysis of metabolites in positive and negative modes using the SCIEX 7500 system
- Deduce statistically significant quantitative trends from secreted metabolites to demonstrate cell growth behavior at different stages using MarkerView software with t-test and partial least squares-discriminant analysis (PLS-DA)
- Easily acquire, process and manage data using a streamlined interface using the SCIEX OS software

Methods
Sample preparation: The hASCs were grown in cell culture medium and collected as following day 1, 3, 7, 14, 21 and 28. The hASCs were cultured in cell culture medium up to 95% confluence. After 3 expansion cycles, the cells were trypsinized, centrifuged and cultured up to 28 days as 3D pellets. Media samples were diluted in 100 µL of 50:50 (v:v) 0.1% formic acid (FA) in water and 0.1% FA in acetonitrile and centrifuged. The supernatant was diluted 60-fold with 0.1% FA.
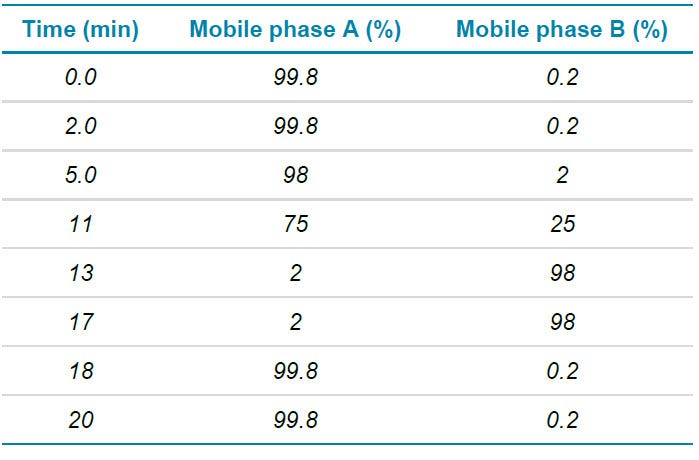
Chromatography: Analytes were separated using a Phenomenex Kinetex F5 column (150 mm x 2.1 mm, 2.6 µm, 100 Å). Total method time was 20 min at a flow rate of 200 µL/min. Mobile phase A was composed of 0.1% FA in water while mobile phase B was composed of 0.1% FA in acetonitrile. Operating column temperature was 40ºC. Injection volume was 5 µL. The LC method details are summarized in Table 1.
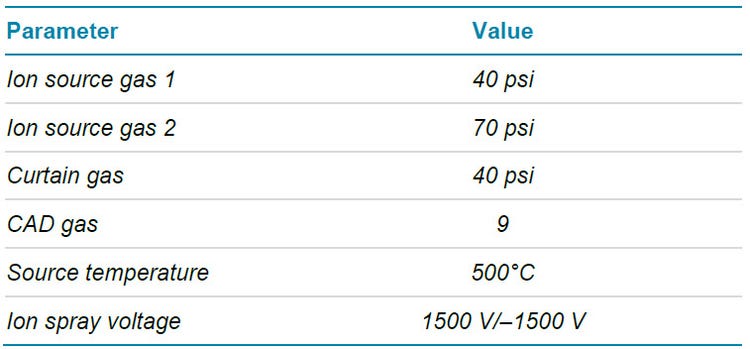
Mass spectrometry: For each component, 2 MRM transitions were monitored with a few exceptions when only 1 MRM was available for analytes ionized in positive and negative mode. This allows for comparisons of ion ratios to help identify potential peak integration issues.
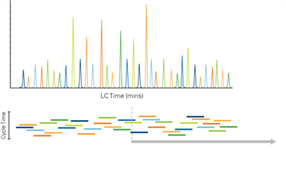
Scheduled MRM algorithm pro was used to optimize cycle times and maximize dwell times for each MRM transition (Figure 3). By scheduling transitions around the expected retention time of an analyte, the sMRM method enables monitoring of significantly more MRMs simultaneously without sacrificing superior analytical precision.
Workflow overview
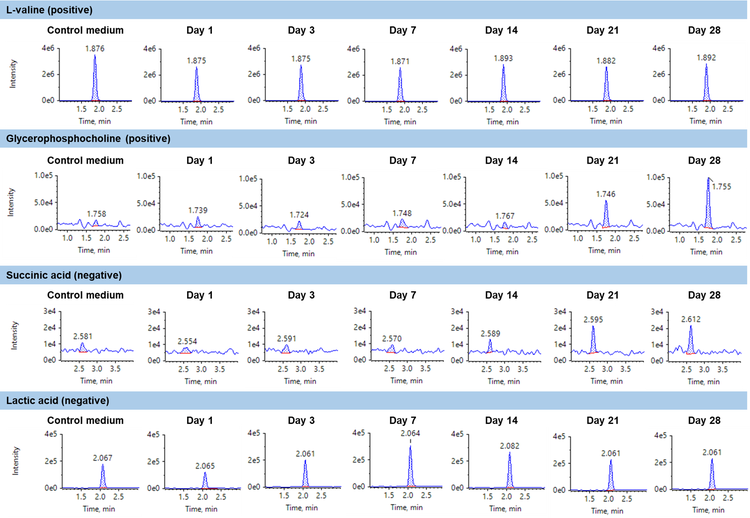
The developed method was successfully applied for the analysis of secreted metabolites in the hASCs cell line. Components were monitored at day 1, 3, 7, 14, 21 and 28. Each sample was analyzed in 4 replicates. A control media was also analyzed separately to monitor components and changes from the initial stages of the experiment.
The fast polarity switching and the high sensitivity on the SCIEX 7500 system enabled monitoring of 196 transitions in positive ion mode and 76 transitions in negative ion mode within a single run. The most sensitive transition was applied for all the analyses. In the following results, representative examples were chosen to showcase the quantitative trend components and statistical comparisons using t-test.
Statistical analysis and quantitative trends at different stages of cell growth
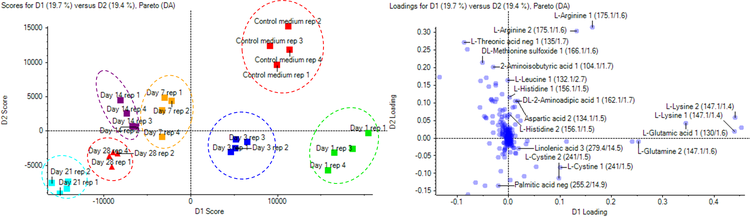
PLS-DA was performed and loading plots were generated for the dataset. Figure 4 distinguishes groups by each growth day (1, 7, 14, 21 and 28 days) and grouped by initial growth days (1 and 3) which are located at highest positive values of D1 score (red and purple), middle growth days (7 and 14), at positive values of D2 score (green and blue) and end days (21 and 28) at highest negative values of both D1 and D2 (yellow and orange). There is a clear difference between the control cell culture media and the spent media from day 3 to 28.
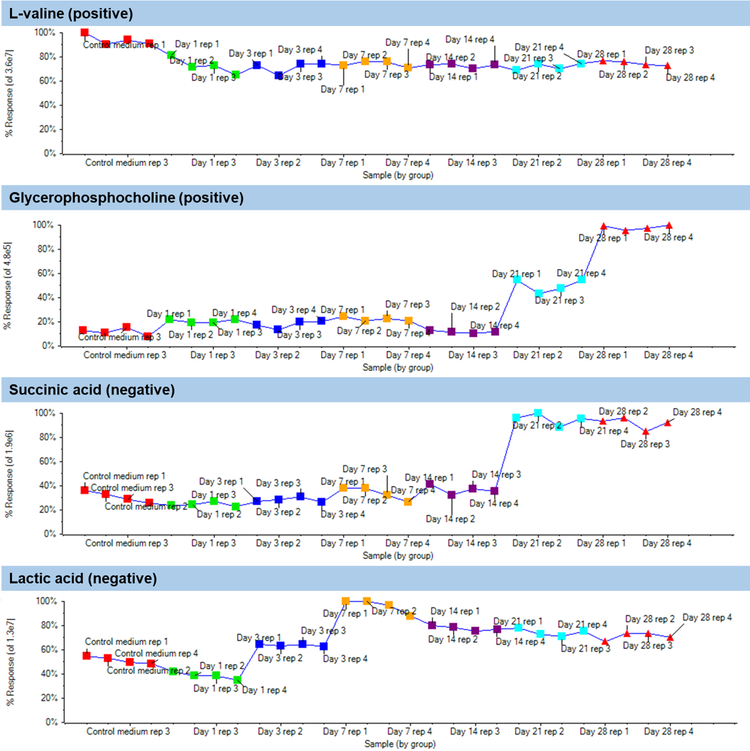
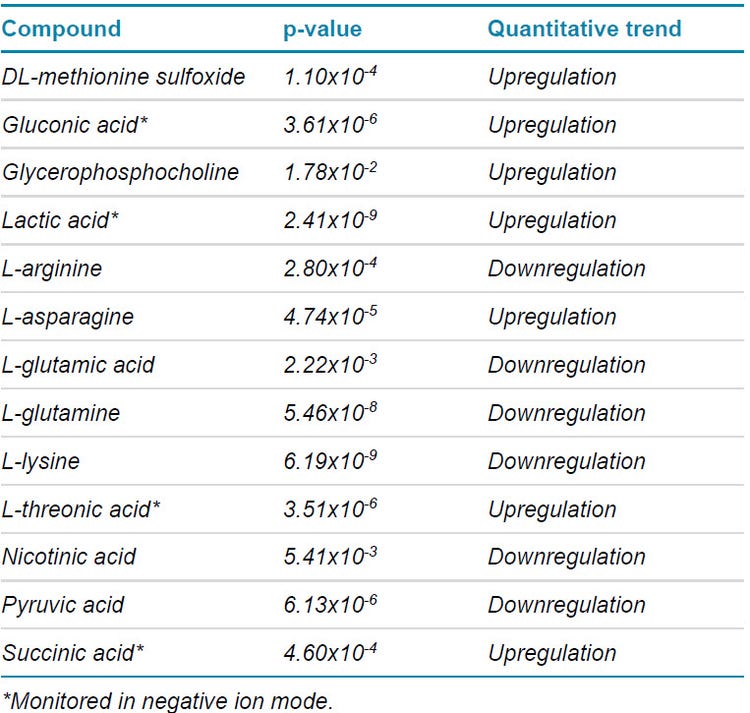
An overall summary of the t-test results for components which indicated a defined and statistically significant quantitative trends are shown in Table 3. Statistically significant quantitative trends were indicated by a p-value of less than 0.05. A total of 7 components were upregulated during the cell growth stages including DL-methionine sulfoxide, gluconic acid, glycerophosphocholine, lactic acid, L-asparagine, L-threonic acid and succinic acid.
Moreover, 6 components were downregulated during the stages of cell growth which involved L-arginine, L-glutamic acid, L-glutamine, L-lysine, nicotinic acid and pyruvic acid. The remaining metabolites had p-values greater than 0.05 indicating no significant quantitative trend over the course of growth.
Studying the biological relevance of the observed trends
Statistically significant quantitative trends were examined for biological relevance over the course of cellular growth. Lactic acid, pyruvic acid and gluconic acid are involved in glycolysis and fermentation which are the main energy production pathways in 3D culture systems. In particular, lactic acid increases as the result of pyruvic acid reduction.3 L-arginine, L-glutamic acid, L-glutamine and L-lysine decrease as the in vitro culture proceeds. These are proteinogenic amino-acids which get incorporated in proteins under biosynthetic conditions, such as in 3D culture and differentiation, given the demand for extracellular matrix (ECM) protein synthesis to maintain pellet stability and functionality.4 Glycerophosphocholine is involved in cellular signaling pathways during cellular differentiation5 and therefore, indicates an upregulation behavior.
As a result, through this analytical approach, the observed variation in metabolite levels were in agreement with the known biological activity.
Conclusion
- Sensitive monitoring of over 110 cell culture metabolites secreted from hASCs was achieved in under a 20 min run time
- A single platform method was applied with fast polarity switching for comprehensive analysis of metabolites in positive and negative modes using the SCIEX 7500 system
- Statistical analysis and quantitative trends were performed and generated using MarkerView software with capabilities of PLS-DA scoring and loading plots to demonstrate data correlation
- Statistically significant quantitative trends were in agreement with the biological activity over the course of cellular growth
References
- Phanette Gir, Spencer A Brown, Georgette Oni, Nathalie Kashefi, Ali Mojallal, Rod J Rohrich (2012). Fat grafting: evidence-based review on autologous fat harvesting, processing, reinjection, and storage. Plastic and Reconstructive Surgery130(1):249-258.
- Kambiz Gilany, Mohammad Javad Masroor, Arash Minai-Tehrani, Ahmad Mani-Varnosfaderani, Babak Arjmand (2019). Metabolic Profiling of the Mesenchymal Stem Cells’ Secretome. Genomics, Proteomics, and Metabolomics 67-81.
- Manoj Arra, Gaurav Swarnkar, Ke Ke, Jesse E. Otero, Jun Ying, Xin Duan, Takashi Maruyama, Muhammad Farooq Rai, Regis J. O’Keefe, Gabriel Mbalaviele, Jie Shen, Yousef Abu-Amer (2020). LDHA-mediated ROS generation in chondrocytes is a potential therapeutic target for osteoarthritis. Nature Communications11(3427).
- Robert A J Signer, Jeffrey A Magee, Adrian Salic, Sean J Morrison (2014). Haematopoietic stem cells require a highly regulated protein synthesis rate. Nature509(7498):49-54.
- Yuri Okazaki, Keishi Nakamura, Shuto Takeda, Ikumi Yoshizawa, Fumiyo Yoshida, Noryasu Ohshima, Takashi Izumi, Janet D. Klein, Thanutchaporn Kumrungsee, Jeff Sands, Noriyuki Yanaka (2019). GDE5 inhibition accumulates intracellular glycerophosphocholine and suppresses adipogenesis at a mitotic clonal expansion stage. American Journal of Physiology Cell Physiology 316(2): C162-C174.