A powerful processing workflow for the analysis of intact AAV8 capsid proteins with challenging chromatography
Featuring the SCIEX X500B QTOF system and Biologics Explorer software
Heather Mallory1, Ebru Selen2, Dilipkumar Reddy2, Lei Xiong2 and Kerstin Pohl2
1GeneLeap Biotech, Woburn, MA, USA; 2SCIEX, USA
Abstract
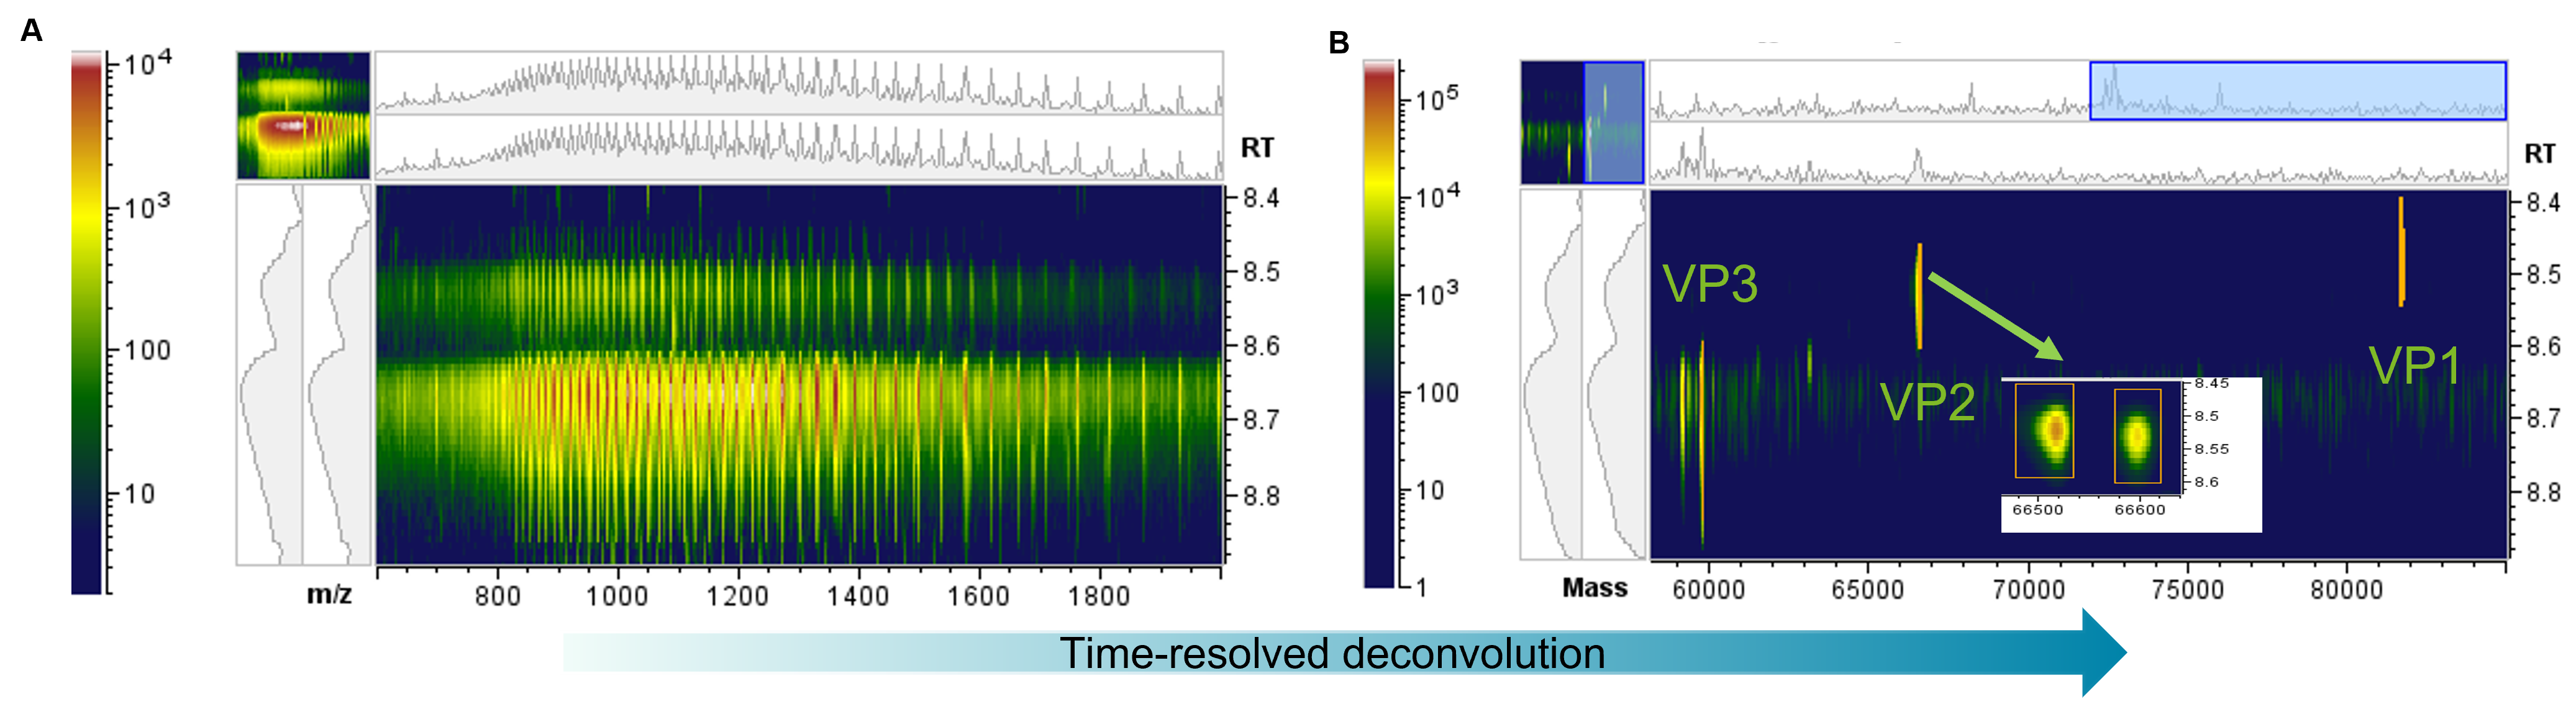
This technical note highlights how to overcome challenges linked to the intact analysis of adeno-associated virus (AAV) viral proteins (VP), where baseline chromatographic separation might not be achievable. Two AAV samples derived from different cell lines (human HEK293 and insect cell line SF9) were used to compare their capsid proteins and differences in their post-translational modifications (PTM). The powerful time-resolved deconvolution (TRD) option in the Biologics Explorer software was leveraged to deconvolute raw data from the intact viral proteins (VP) scan-by-scan (Figure 1) and enable quantification with high performance.
Introduction
AAVs are widely used non-pathogenic vectors for in vivo gene therapy due to their low immunogenicity and long-term gene expression.1 These viruses are composed of a shell of protein called a capsid, encompassing a single stranded DNA. AAV capsids contain a mixture of 3 VPs with shared sequences (Figure 2).1–3 Stoichiometry of the VPs, which has been shown to be dependent on the production system2 and the levels of PTMs are critical factors influencing vector potency and infectivity.2–5 can be challenging. The similarity in sequence and therefore physical properties can lead to partial or full co-elution posing a challenge for chromatographically separating VPs. Optimization of reversed-phase liquid chromatography (RPLC) methods might require ion-pairing agents (such as, difluoroacidic acid or trifluoroacidic acid), which reduce the sensitivity by suppressing ionization in MS.6 Since the amount of sample for the analysis of AAV therapies is very limited compared to traditional protein-based therapies, ion suppression is a concern. However, a reliable intact characterization of the VPs is imperative for ensuring the quality, safety and consistency of AAV products.
In this technical note, challenges in AAV8 capsid protein chromatography were overcome by using a powerful deconvolution option, TRD. A 3D visualization tool based on intensity, molecular weight and retention time (RT) offers a superior view of data and enables users to easily assess VPs while it avoids missing low abundant impurities. Furthermore, the TRD workflow provides better relative peak quantification using peak volume over the entire elution time, allowing users to perform comparisons of percentages of modification between samples such as here between 2 assembly systems, HEK293 and SF9 cells.
Key features of AAV VP characterization with TRD
- Increased confidence in deconvolution and peak detection leading to an accelerated gene therapy product development even in cases of challenging chromatography
- Data review and detection of impurities is facilitated by new and versatile 3D visualization options for TOF MS data as well as scan-by-scan deconvoluted data (TRD)
- Reliable relative quantification of protein species based on peak volume and TRD offers better comparisons of proteins and PTM ratios derived from different batches or sources
Figure 1. Biologics Explorer software with versatile visualization tools and powerful deconvolution algorithm. A heatmap of capsid proteins derived from HEK293 cells showing the intensity of the TOF MS data based on color code, the m/z range and the retention time at the same time (A). A 3D display of 3 capsid proteins before (TOF MS data) and after deconvolution scan-by-scan using the TRD activity node (B). Both plots can be used as powerful tools to examine signals from capsid proteins, PTMs and impurities which enable a fast assessment of sample quality.
Methods
Sample preparation: 100 µL of AAV virions at a concentration of 1x10¹² gene copies per mL were first concentrated with an Amicon Ultra filter (0.5 mL, 10 kDa MWCO) and then buffer exchanged with 25 mM of Tris, pH 8.0 (0.5 mL, 3 times) at 4,000×g. The concentrated AAV virions (30 µL) were denatured by adding 70 µL of 10% acetic acid ensuring disassembled VP1, VP2 and VP3 (Figure 2).
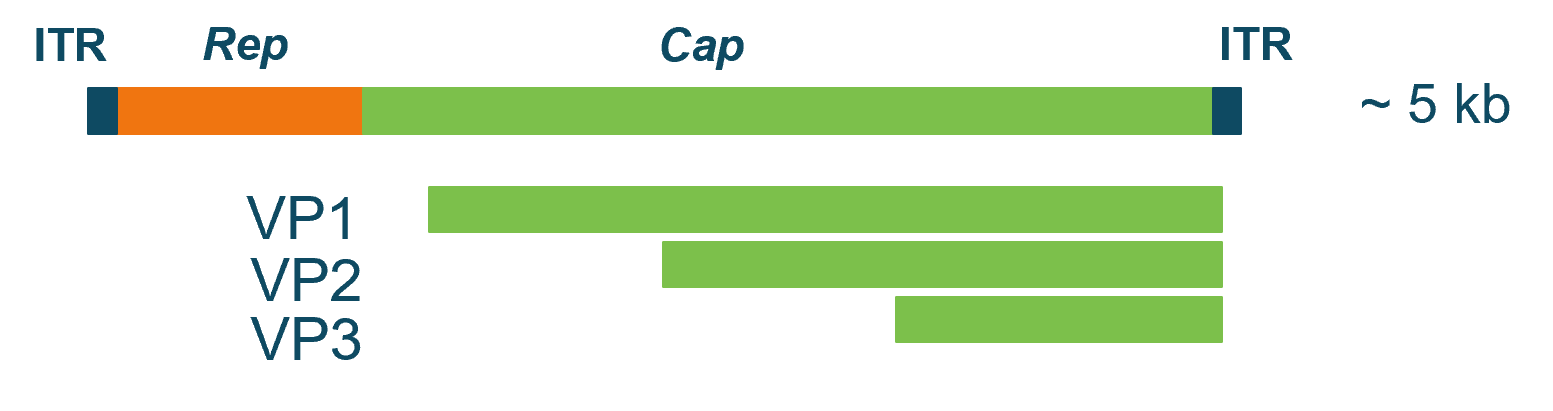
Figure 2. Schematic genome map of AAVs. AAVs contain linear single stranded DNA of ~5 kilobases. ITR: Inverted terminal repeat sequence. Rep: replication, coding for regulatory proteins. Cap: capsid, coding for capsid proteins. VP1, VP2 and VP3 are derived from the same Cap gene through alternative splicing. The proteins share the same C-terminus but differ in their N-terminus of their proteins, resulting in molecular weights between ~60–82 kDa.
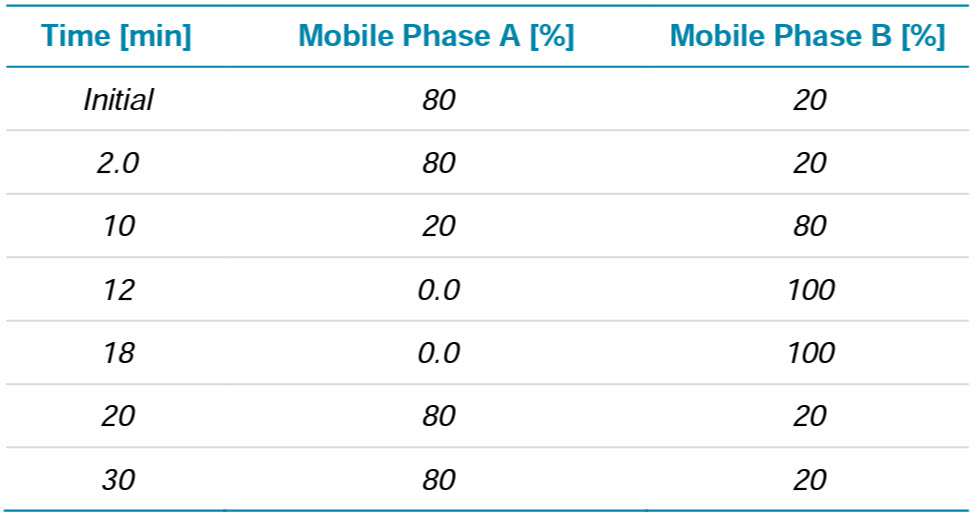
Chromatography: The separation was accomplished using a SCIEX ExionLC system fitted with a Waters BEH C8 column (2.1×100 mm, 1.7 µm, 130 Å). Mobile phase A consisted of 0.1% formic acid in water while mobile phase B was 0.1% formic acid in acetonitrile. A flow rate of 250 µL/min was used with the gradient shown in Table 1. The column temperature was held at 80°C. The injection volume was set to 50 µL, which correspond to approximately 0.5 µg on column.
Table 1. Chromatography for intact mass analysis.
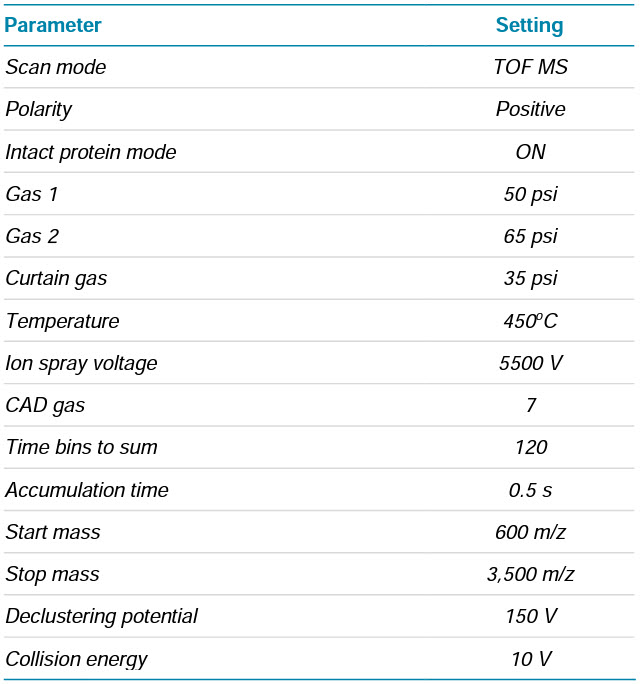
Mass spectrometry: AAV data were acquired using the SCIEX X500B QTOF system. Detailed MS settings can be found in Table 2.
Table 2. MS parameters for intact mass analysis.
Data processing: Data were processed and visualized using Biologics Explorer software version 1.0.2. Biologics Explorer software is compatible with all data from SCIEX accurate mass systems in WIFF and WIFF2 format. In this technical note, AAV8 capsid protein data collected with the SCIEX X500B QTOF system were processed using Biologics Explorer software. The template workflow “Intact_TimeResolvedDeconvolution_MS” was used, which includes predefined activity nodes being optimized for SCIEX data files.
Processing intact AAV8 capsid protein data using TRD
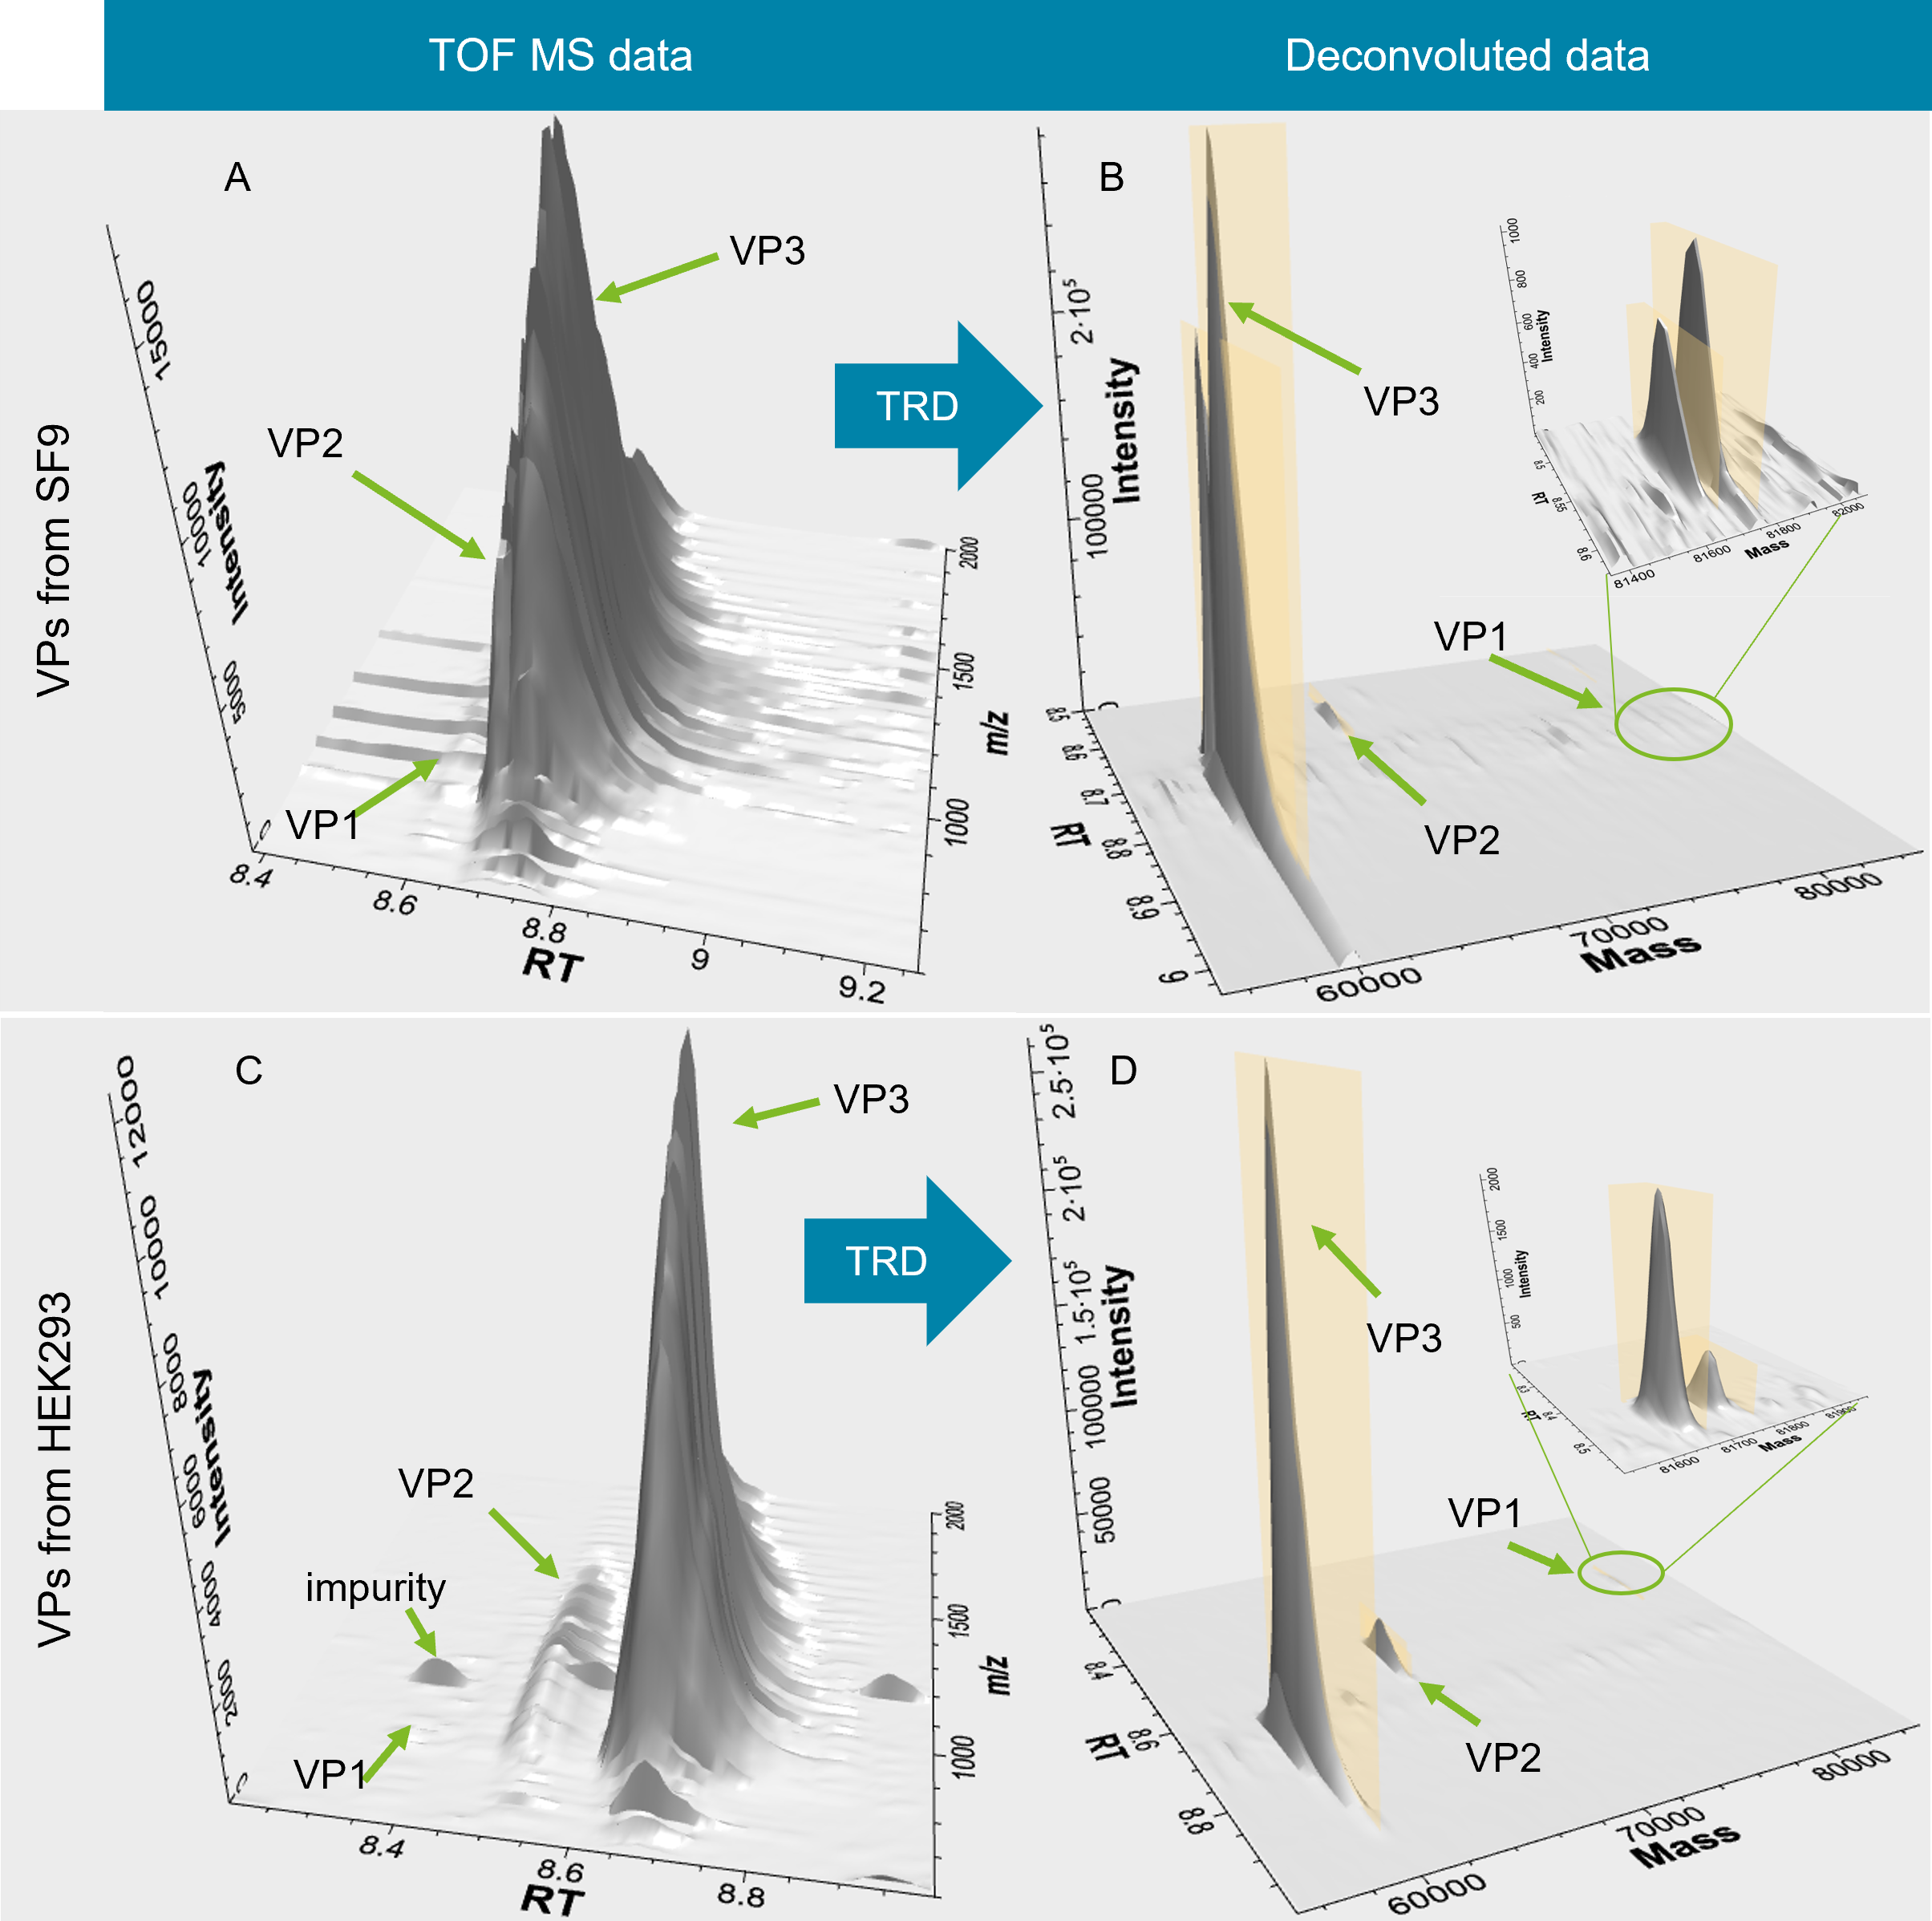
Challenges around data processing and data interpretation arise when peaks are chromatographically inadequately resolved. The TRD activity node in Biologics Explorer software is particularly suited to accurately deconvolute components that are chromatographically poorly resolved by deconvoluting data scan-by-scan. In addition, unexpected low-abundance protein impurities, which might not be visible as peaks in the total ion chromatogram, can be deconvoluted and found leveraging powerful 3D plots (Figure 3). While for traditional deconvolution approaches MS scans over a defined RT range are summed or averaged, the algorithm used for the TRD activity node enables deconvolution of each TOF MS scan across the retention time range separately. Therefore, information on deconvoluted masses and corresponding retention times is preserved and connected for all species, further enabling users to detect expected alongside unexpected species. AAV8 capsid proteins extracted from HEK293 (VPHEK293) andSF9 (VPSF9) assembly systems were analyzed using TRD. Initial inspection was done on 3D raw data to assess peaks and potential impurities (Figure 3A and C). TRD offers pre‑processing nodes to filter noise (to emphasize relevant peaks) and correct the baseline, (to correct the baseline drifts due to gradient changes). Pre-processing of MS data is imperative to ensure accurate peak detection and interpretation of data after deconvolution including correct annotation (Figure 3B and D).
Figure 3. Visualization of TOF MS and deconvoluted data of VPs from SF9 and HEK293 cells. TOF MS data of VPs from SF9 cells (A) and deconvoluted data of VPs (B) were visualized as 3D plots. TOF MS data of VPs from HEK293 cells (C) and deconvoluted data of VPs (D) as 3D plots. Green arrows indicate the individual VPs as well as detected impurities. 3D axis is showing peak intensity, retention time and m/z or mass for TOF MS and deconvoluted data, respectively. Insets in B and D highlight the power of TRD for low-abundance signals.
Protein mapping, annotation and relative quantification
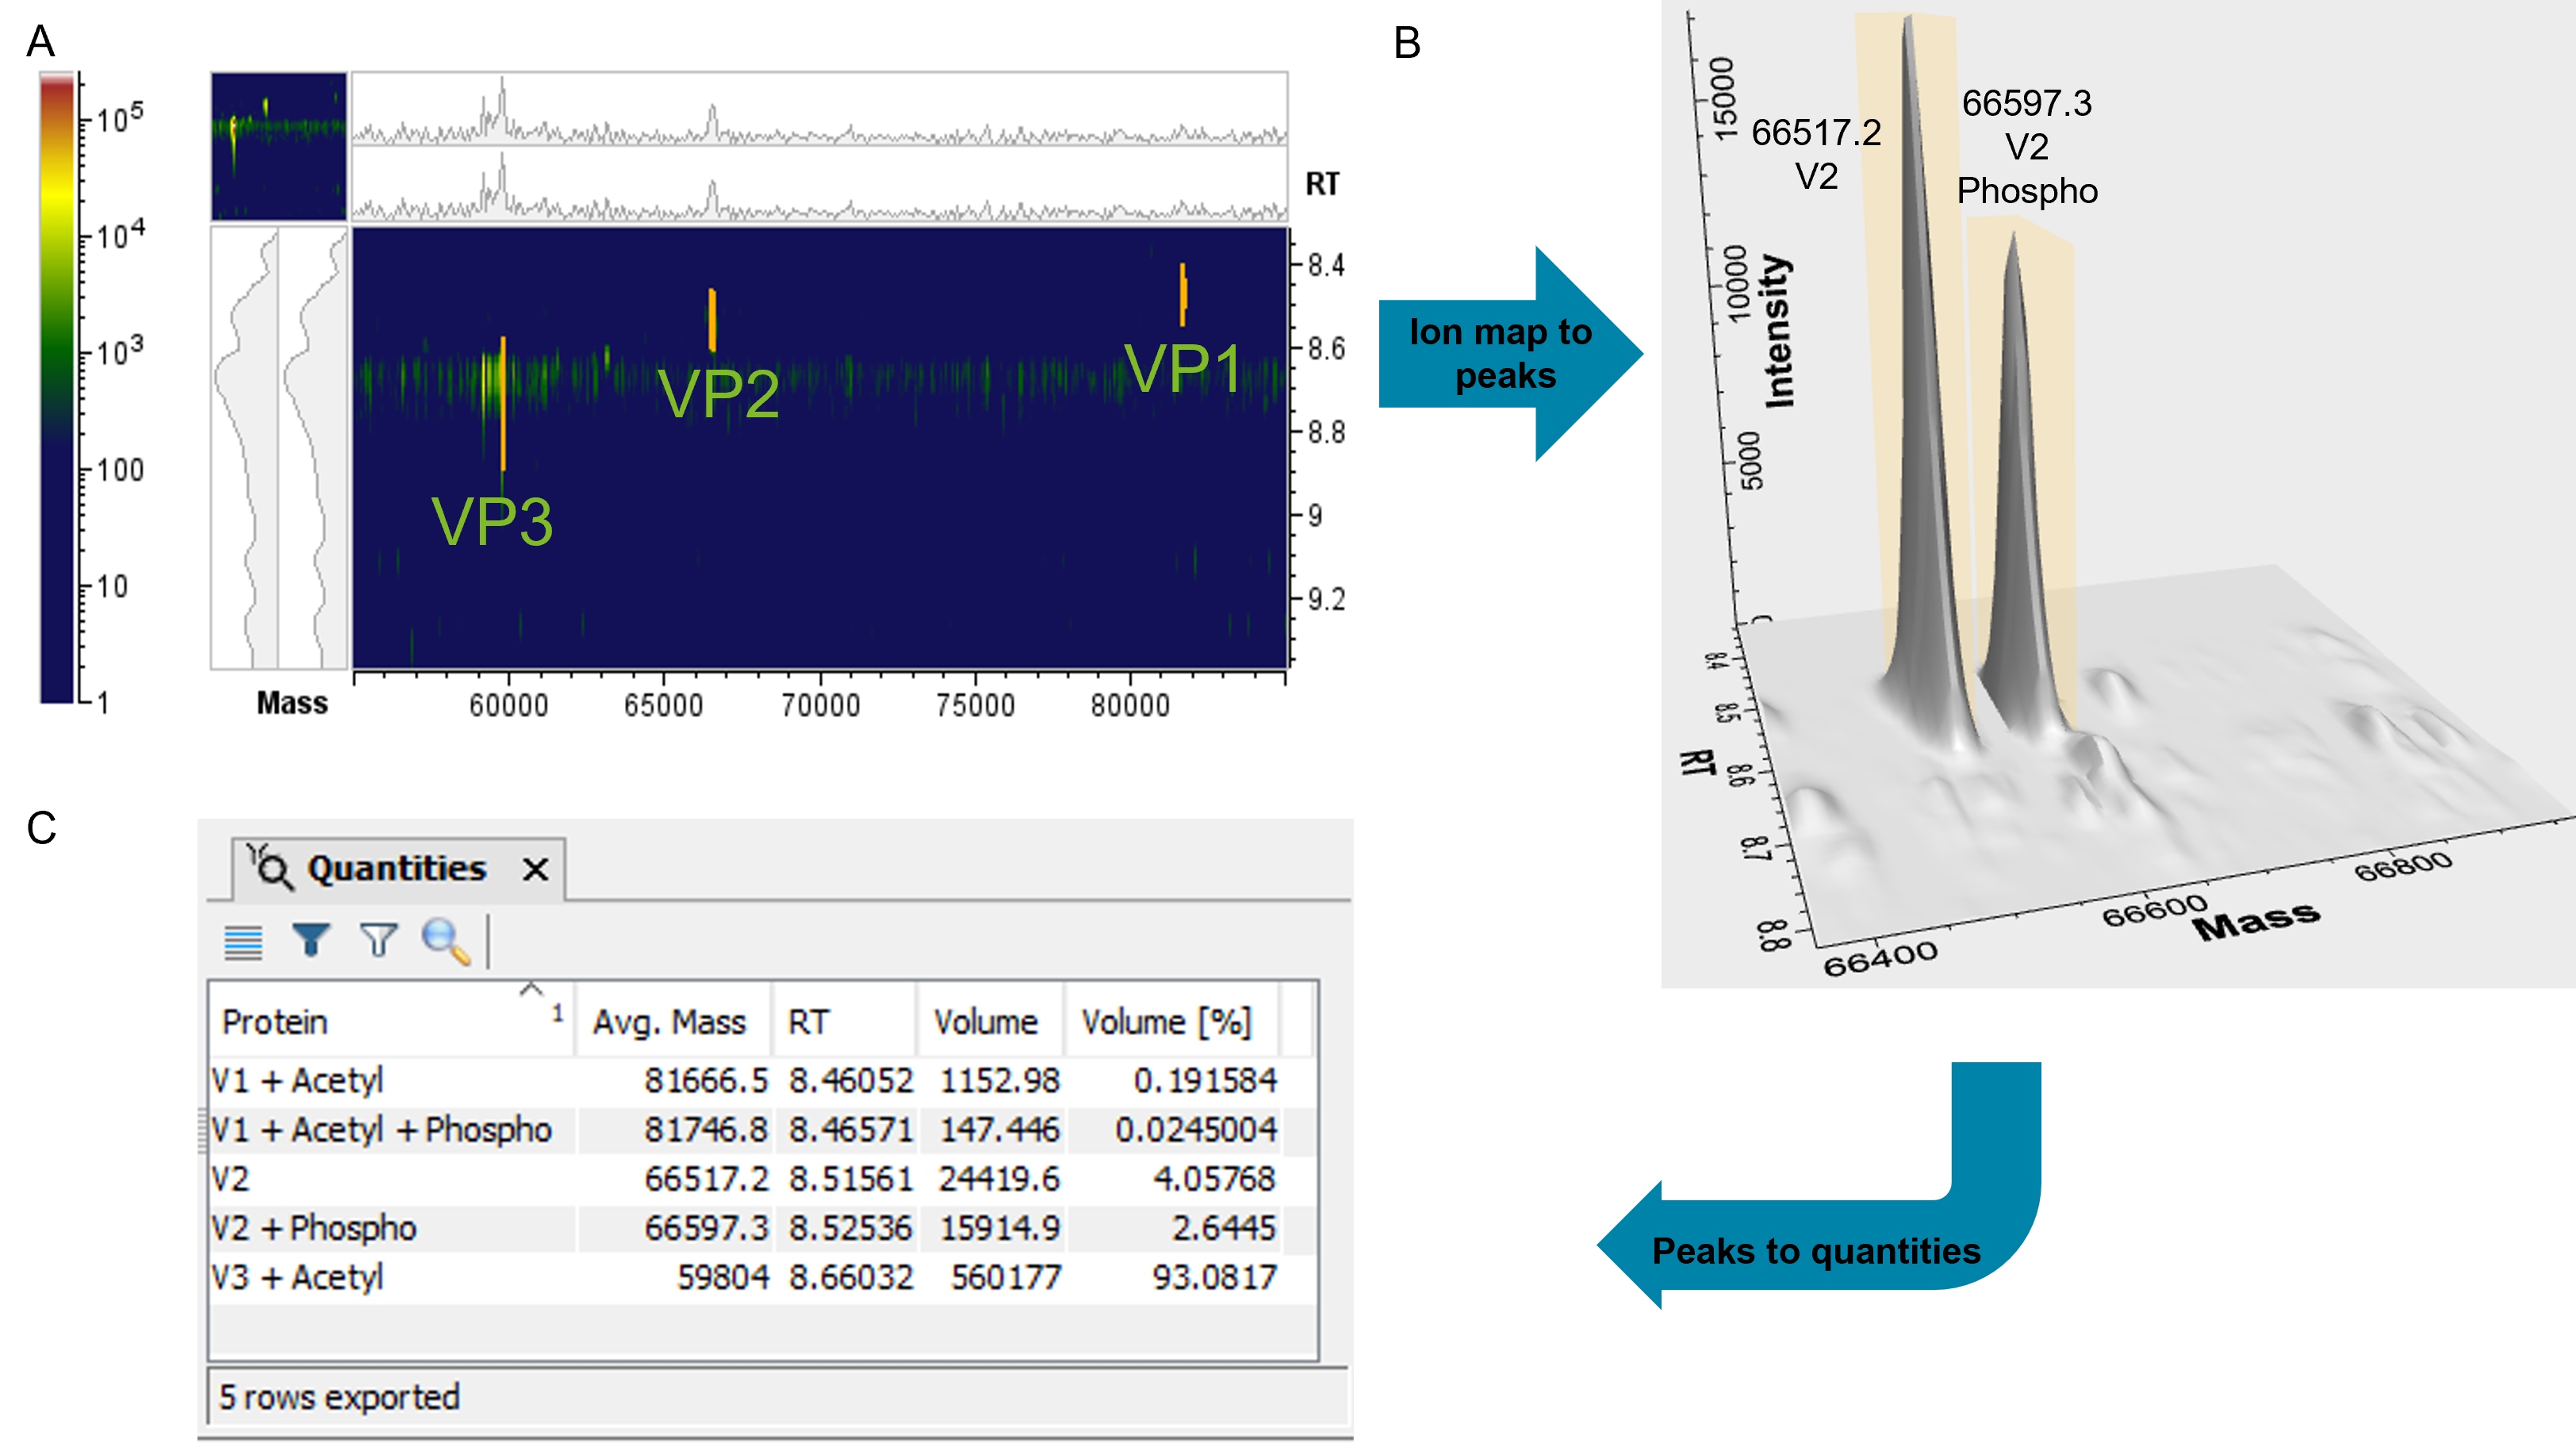
Peaks detected using TRD were annotated based on protein sequence and selected modifications automatically. Excellent mass accuracies (<10 ppm) were obtained for all major species detected in both experiments. Figure 4 shows the reconstructed spectra of VPHEK293 and VPSF9 peaks detected and annotated using TRD. The intact mass analysis of VP1SF9, VP1HEK293 and VP2HEK293 showed high-abundance peaks with a mass shift of +79 Da and +123 Da compared to the theoretical sequence. This mass shift can be linked to phosphorylation (+79 Da) and to phosphorylation and acetylation (+123 Da) as a known modification for AAV VPs5 and was automatically annotated in the software (Figure 4A, D and E). Adversely, VP2 SF9 did not show any phosphorylation (Figure 4B). Neither the VP3 from HEK293 or SF9 showed any evidence for phosphorylation (Figure 4C and F). To validate the annotation of phosphorylation, samples from HEK293 were treated with alkaline phosphatase as an example (Figure 4G–I). In case of VP1HEK293 the peak with the mass shift of +79 Da completely disappeared and only the unmodified VP1HEK293 was detected. This result confirms that the mass shift is indeed linked to a phosphorylation, which was successfully removed by the alkaline phosphatase. The abundance of the VP2HEK293 peak showing a +79 Da mass shift decreased from ~70% to 10% relative to the non-modified VP2HEK293 (Figure 4E and H), which can be contributed to a partial removal of phosphorylation. Longer incubation time or higher enzyme concentration are expected to result in full removal of the respective phosphorylation peak. The acetylated VP3HEK293 did not show any change in mass after phosphatase treatment, as expected (Figure 4F and I). Acetylation, causing a mass shift of +44 Da was found for VP1 and VP3, but not for VP2 for both samples. Significant differences in the ratios of PTMs between the 2 assembly systems were found. Since PTMs can affect vector potency2–5, it emphasizes the importance of selecting the right cell line for producing effective high-quality viral carriers and thoroughly characterizing the VPs during development. To be able to easily compare the ratios of PTMs, Biologics Explorer software offers different relative quantification options based on deconvoluted data. The scan-by-scan deconvolution (Figure 5A) can be used for volume-based quantification (Figure 5B), which increases the accuracy of quantification compared to other approaches based on averaging or summing spectra of a defined RT range. Volume percentages for user-defined species are available in an exportable table format (Figure 5C), which enable a quick assessment of the abundances of protein forms or PTMs.
The workflow of time-resolved deconvolution in Biologics Explorer software together with sophisticated quantification options based on %volumes can be used as reliable tools for the analytics of gene therapy vectors and therefore assist with the development of safe and efficient AAV-based therapeutics.
Figure 4. Annotation of deconvoluted data of VP1-3 from SF9 and HEK293 cells. Deconvoluted masses were annotated with the protein name and matched modification. A–C show VPs derived from SF9 cells. D–F show VPs derived from HEK293 cells. G–I show VPs derived from HEK293 after phosphatase treatment. Y-axis in all figures shows %intensities.
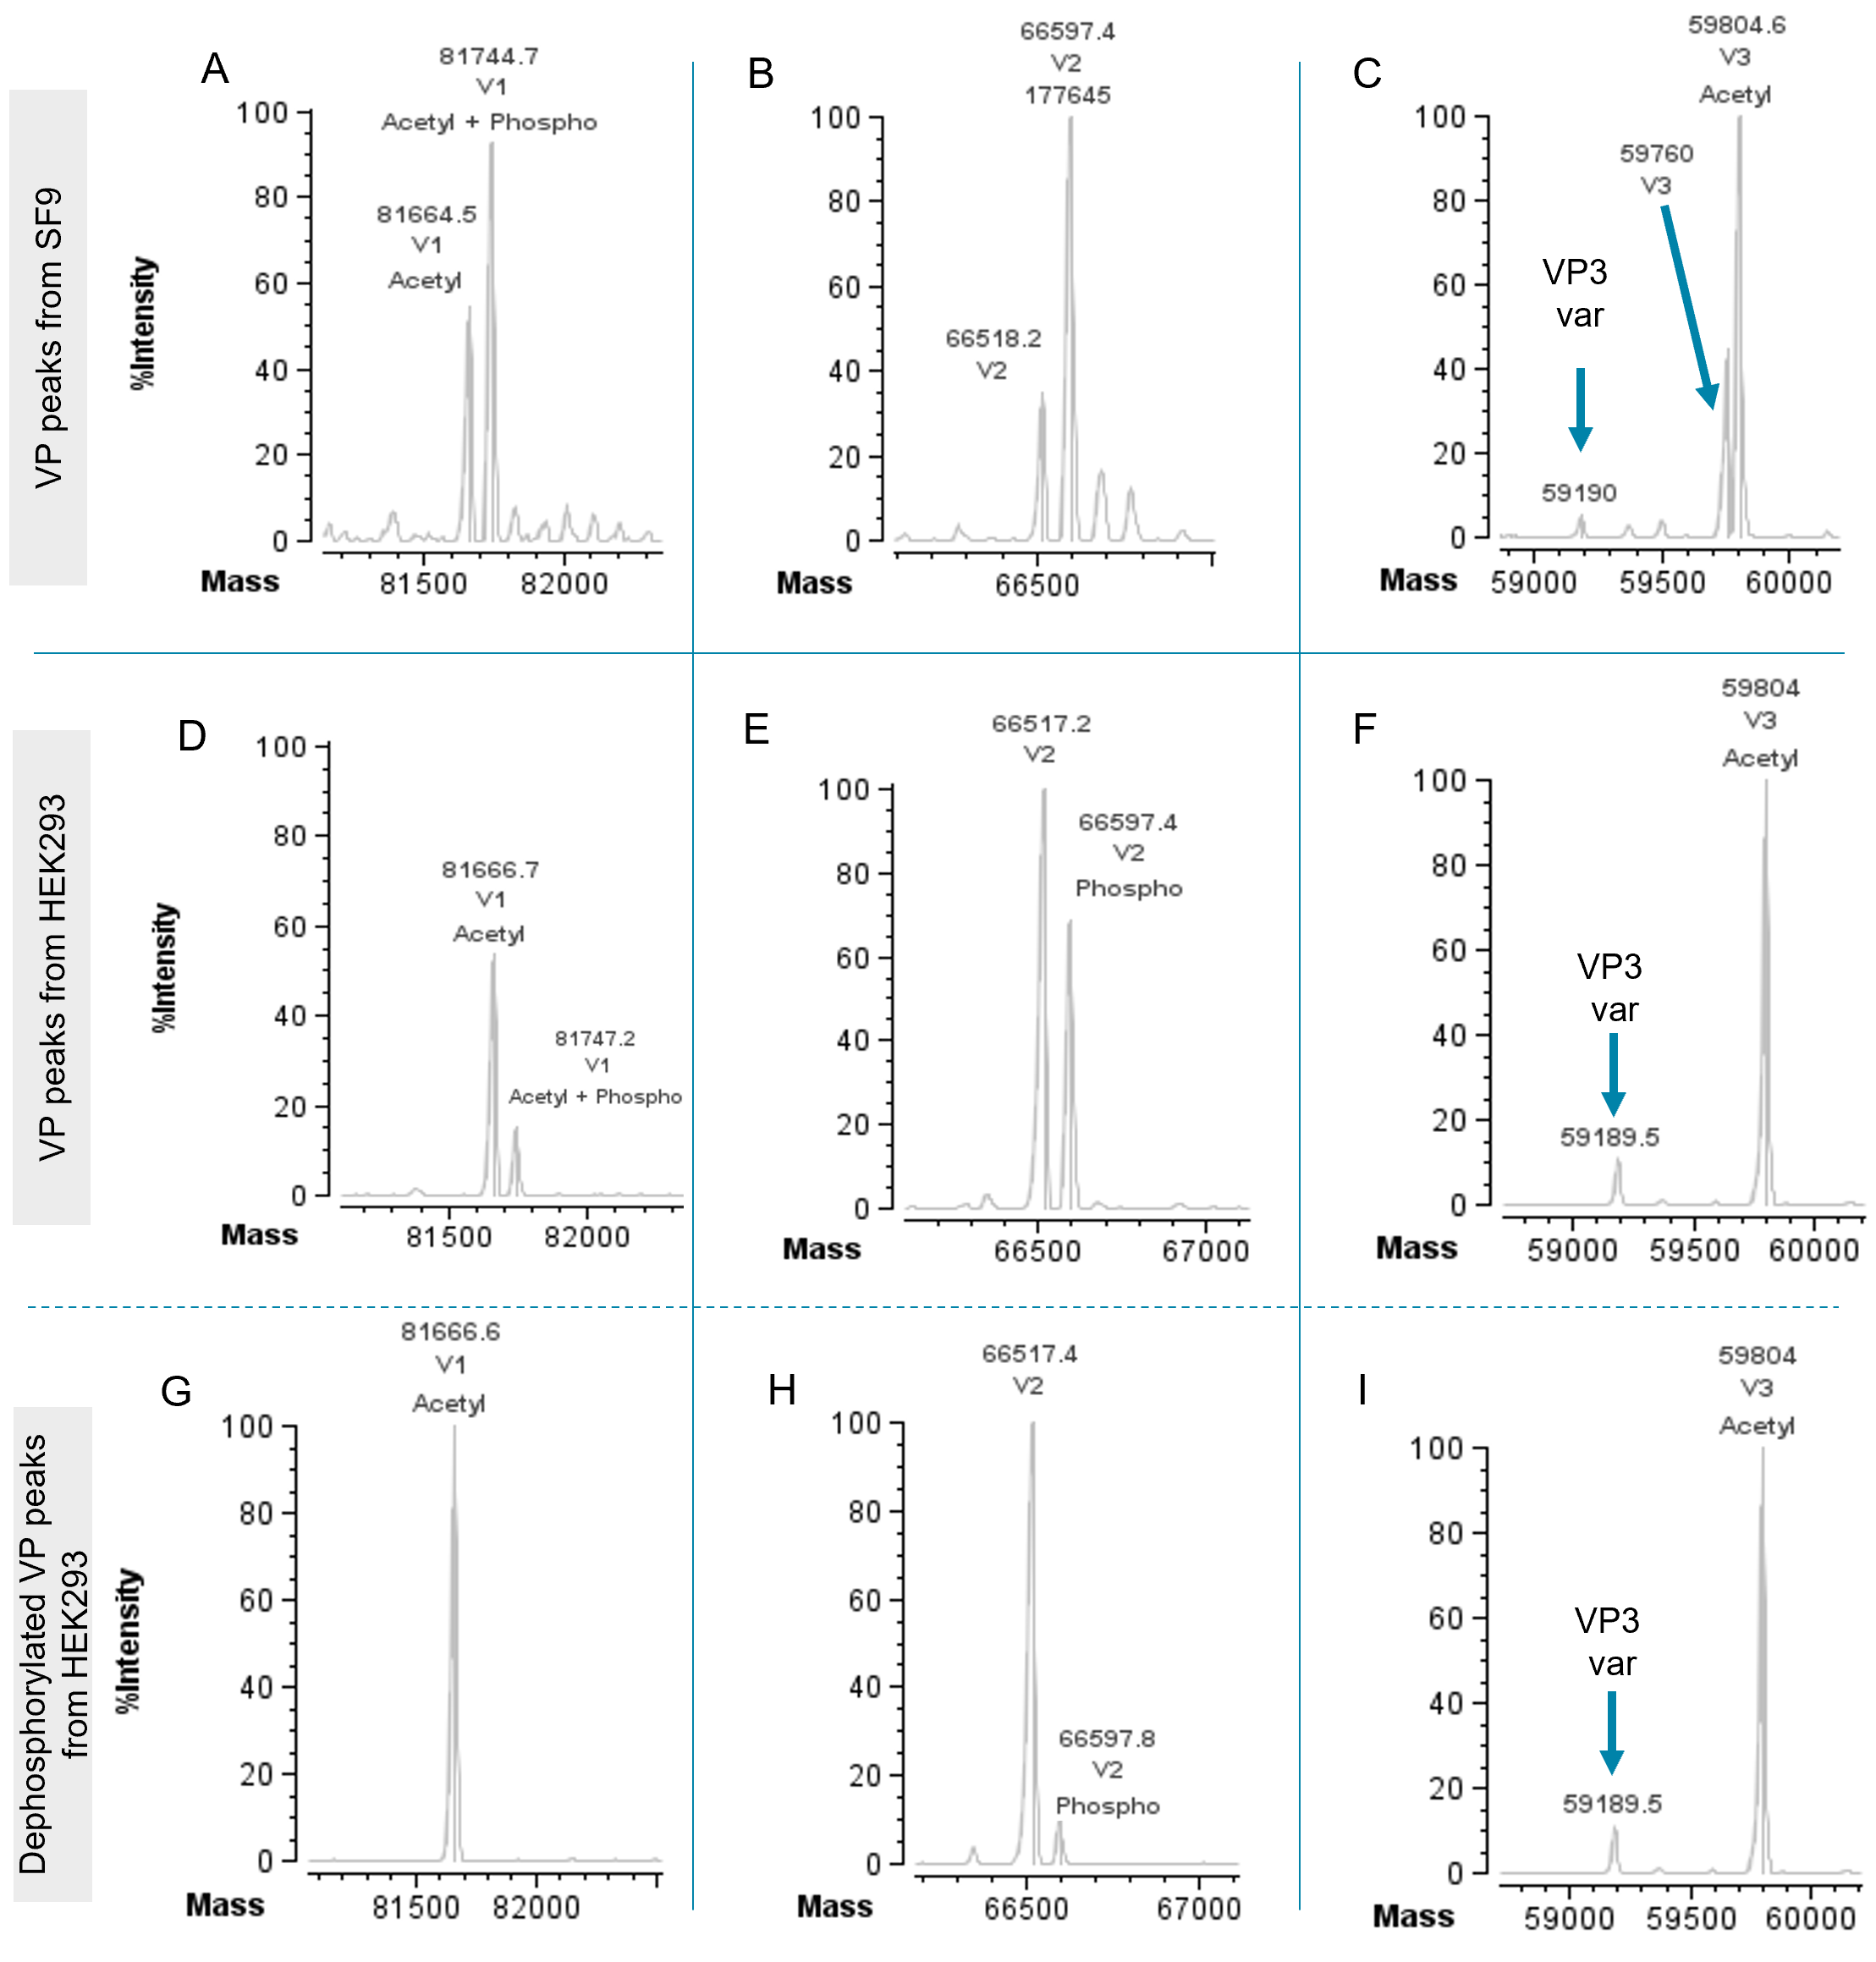
Figure 5. Quantification of VPs from HEK293 cells. Ion map of TRD of VP data (A). Representative example of detected and annotated VP2 protein and PTMs peaks using TRD (B). Quantification table including the peak volume in percentages for all three VPs and their PTMs based on the TRD data (C).
Conclusion
- Accurate deconvolution for VPs can be achieved even in cases of co-elution by using a superior scan-to-scan deconvolution algorithm in the TRD activity node of the Biologics Explorer software
- The risk of missing low-abundance peaks is mitigated by a 3D representation for TOF MS and deconvoluted data which serves as a great visualization tool facilitating data review
- Reliable quantification of VPs and their PTMs can be achieved through deconvoluted 3D peak volumes as opposed to traditional peak areas or intensity-based quantification
References
- Li C, Samulski RJ (2020). Engineering adeno-associated virus vectors for gene therapy. Nat Rev Genet. 21(4):255-272.
- Bosma, B., du Plessis, F., Ehlert, E. et al. (2018). Optimization of viral protein ratios for production of rAAV serotype 5 in the baculovirus system. Gene Ther 25, 415-424.
- Wörner TP, Bennett A, Habka S, Snijder J, Friese O, Powers T, Agbandje-McKenna M, Heck AJR (2021). Adeno-associated virus capsid assembly is divergent and stochastic. Nat Commun. 12(1):1642.
- Oyama H, Ishii K, Maruno T, Torisu T, Uchiyama S (2021). Characterization of adeno-associated virus capsid proteins with two types of VP3-related components by capillary gel electrophoresis and mass spectrometry. Hum Gene Ther. 32(21-22):1403-1416.
- Bertin Mary, Shubham Maurya, Sathyathithan Arumugam, Vikas Kumar, Giridhara R. Jayandharan (2019). Post‐translational modifications in capsid proteins of recombinant adeno‐associated virus (AAV) 1‐rh10 serotypes. FEBS 286(24):4964-4981.
- Zhang X, Jin X, Liu L, Zhang Z, Koza S, Yu YQ, Chen W (2021). Optimized reversed-phase liquid chromatography/mass spectrometry methods for intact protein analysis and peptide mapping of adeno-associated virus proteins. Hum Gene Ther. 32(23-24):1501-1511.