Accurate identification and robust quantification of intact and subunits of monoclonal antibodies (mAb) using LC-UV-MS
Highly confident identification and powerful LC-UV data processing enabled by the ZenoTOF 7600 system in combination with Biologics Explorer software
Ebru Selen, Zoe Zhang and Kerstin Pohl
SCIEX, USA
Abstract
In this technical note, a workflow for monoclonal antibody identification and quantification with MS and UV, using Biologics Explorer software is shown. This workflow merges excellent LC-MS identification and annotation with reliable, lean and quantifiable LC-UV to offer a robust and flexible methodology in antibody characterization and control processes.
Introduction
Liquid chromatography coupled to UV (LC-UV) detection is an important analytical technology extensively used throughout the biopharmaceutical development process, which enables detection and quantification of protein species. Despite its power, LC-UV lacks the capability of identifying species. Offering excellent sensitivity, mass accuracy and high resolution, QTOF MS technology can address the gap of identification. Utilizing a hybrid method of LC-UV-MS combines the best of 2 worlds for accurate, robust identification and quantification of biotherapeutics as well as protein impurities and degradation products. Efficient utilization of all information available requires accurate and flexible software to link MS and UV data and to enable quantification addressing user needs.
Here, subunits of a mAb sample and an intact mAb spiked with different levels of protein impurities were used to investigate automatic identification and relative quantification with an LC-UV-MS workflow, using Biologics Explorer software. The modules within the software allow for correct annotation and quantification of LC-UV peaks based on deconvoluted and matched MS data. Moreover, manual peak selection offers flexibility in qualitative and quantitative analyses of LC-UV chromatograms.
Key features of UV-MS data processing in the Biologics Explorer software
- Accuracy, sensitivity and quantitative flexibility for biotherapeutic protein identification and quantification in a single LC-UV-MS run
- Accurate MS identification through powerful deconvolution algorithms can be linked to reliable UV-based quantification including automated signal alignment between MS and UV
- High flexibility and accuracy in quantification of proteins and protein impurities with full transparency in data processing
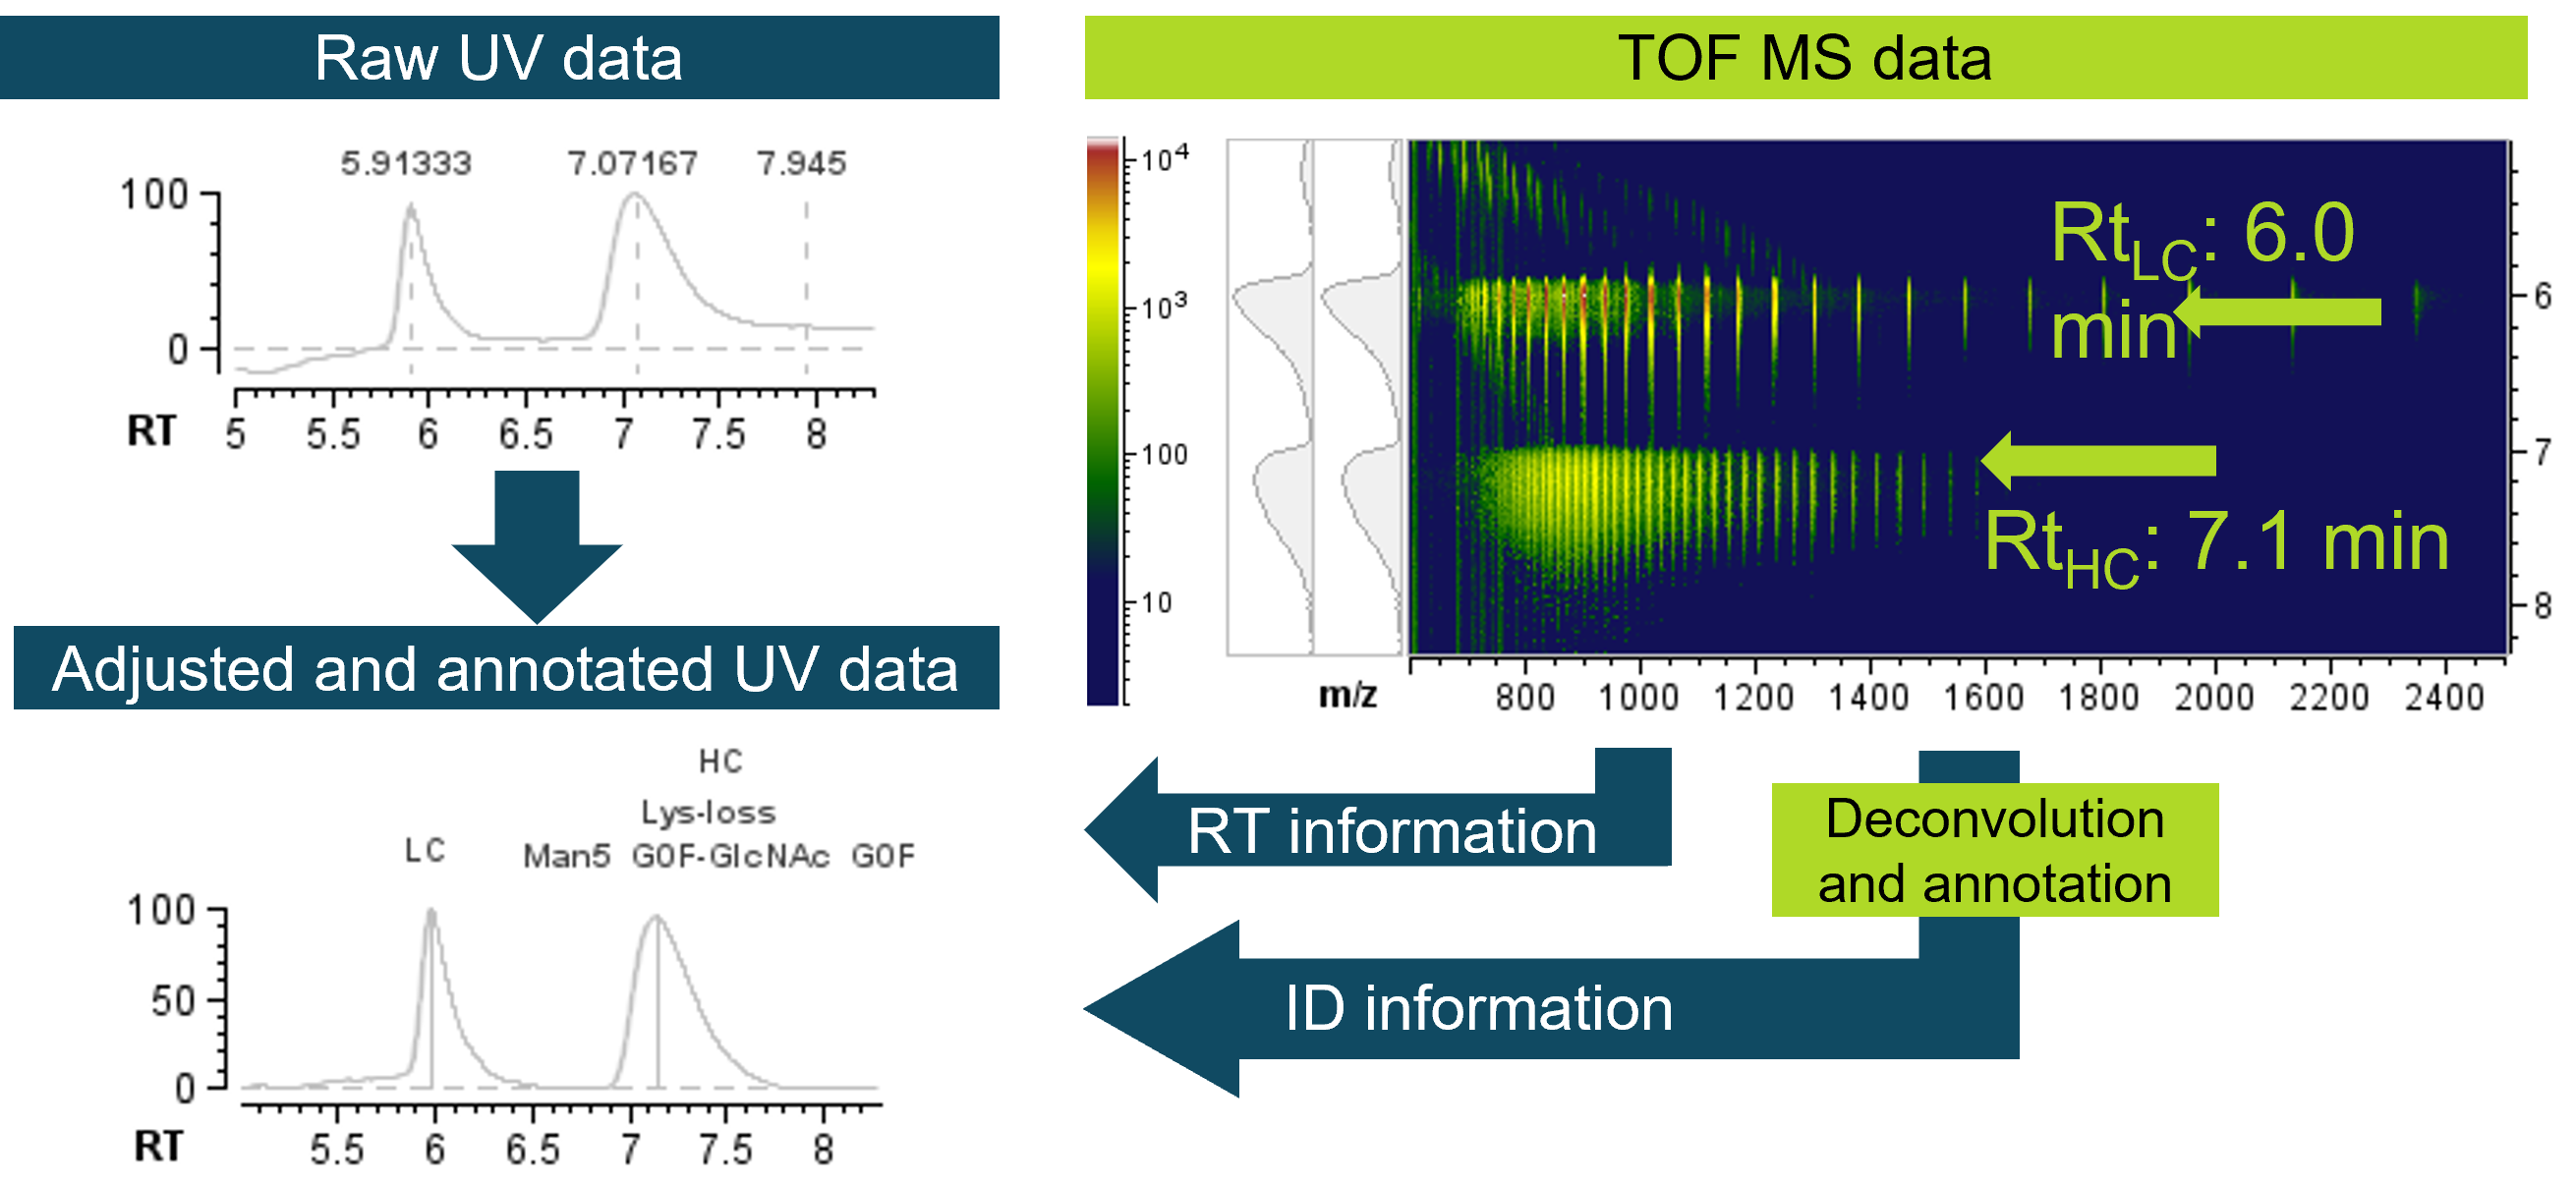
Figure 1. Precise retention time alignment between UV and MS data enables accurate identification of peaks in UV chromatograms. Heavy chain (HC) and light chain (LC) subunits of adalimumab were used to highlight the UV-MS processing in the Biologics Explorer software. The raw UV chromatogram was aligned with regards to retention time (RT) and labelled with the identity of each peak based on the MS information. QTOF MS data was used for deconvolution and matching against theoretical sequences, enabling the annotation of UV data.
Methods
Sample preparation: Adalimumab mAb sample (40 µg/µL) was diluted to 1 µg/µL for intact and subunit analysis. For subunit analysis, sample was reduced as follows: 150 µl denaturing reagent (7.2M guanidine in 50mM Tris, pH 7-8) was added to 50 µL of sample and vortexed. Dithiothreitol (DTT) was added at a final concentration of 100mM and the mixture was incubated at 60ºC for 30 mins. The sample was diluted by a factor of 2 with 0.1% formic acid prior to LC-UV-MS analysis. In addition, intact mAb was spiked with different concentrations of β-lactoglobulin, referred to as “protein impurity” in different amounts to demonstrate relative UV-based quantification of potential impurities.
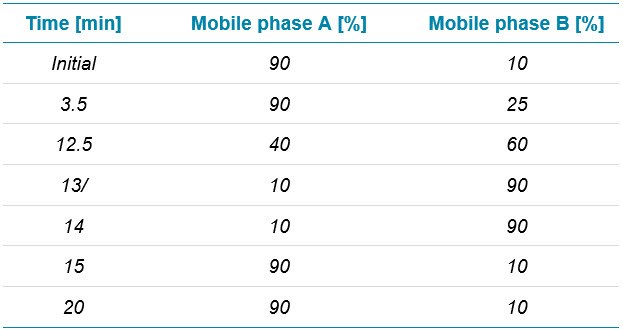
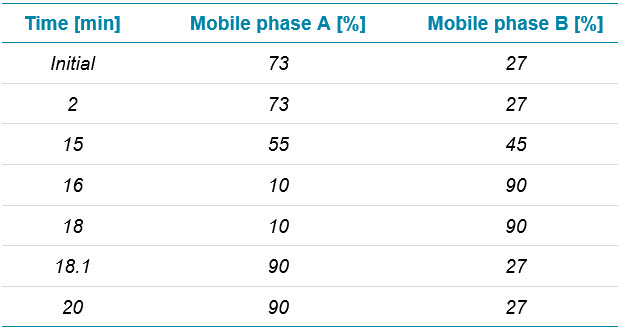
Chromatography: Reversed-phase liquid chromatography (RPLC) separation of intact and subunit samples was achieved using an Acquity UPLC BEH C4 column (2.1 mm × 50 mm, 1.7 µm, 300 Å, Waters). Five microliters were injected. UV detection was enabled at 280 nm for both chromatographic separations. Separation of adalimumab spiked with protein impurities was achieved with a BioResolveRP, mAb Polyphenyl 450 Å, column (2.1 mm × 50 mm, 2.7 µm, Waters). One microliter was injected for spike-in analyses, whereas 5 µL were injected for all other experiments. Flow rate was set to 0.25 mL/min. Table 1 and 2 show the RPLC conditions. Chromatographic separations were achieved using mobile phase A with 0.1% formic acid in water and mobile phase B at 0.1% formic acid in acetonitrile.
Table 1. Chromatography for subunit analysis.
Table 2. Chromatography for intact analysis.
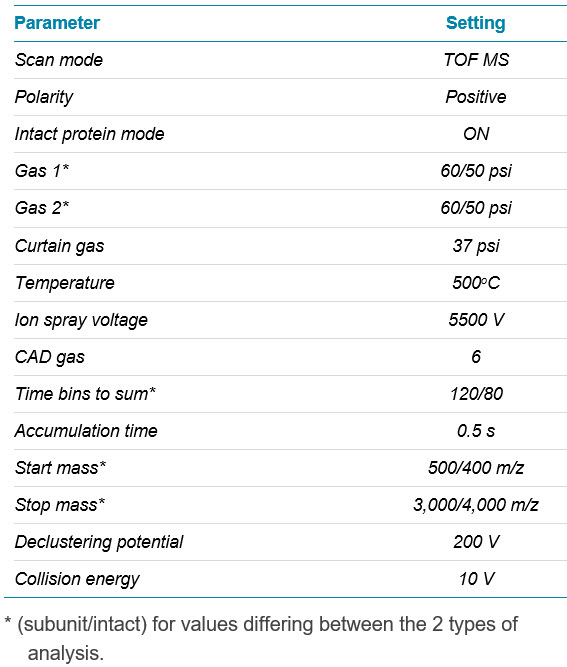
Mass spectrometry: Data were acquired in TOF MS mode using positive ionization with a ZenoTOF 7600 system with intact protein mode enabled. MS parameters are shown in Table 3.
Table 3. MS parameters for subunit and intact mass analysis.
Data processing: Data were processed and visualized using Biologics Explorer software version 1.0.2. The software is compatible with all SCIEX accurate mass spectrometry and data in .WIFF and .WIFF2 format.
Identification of adalimumab subunits
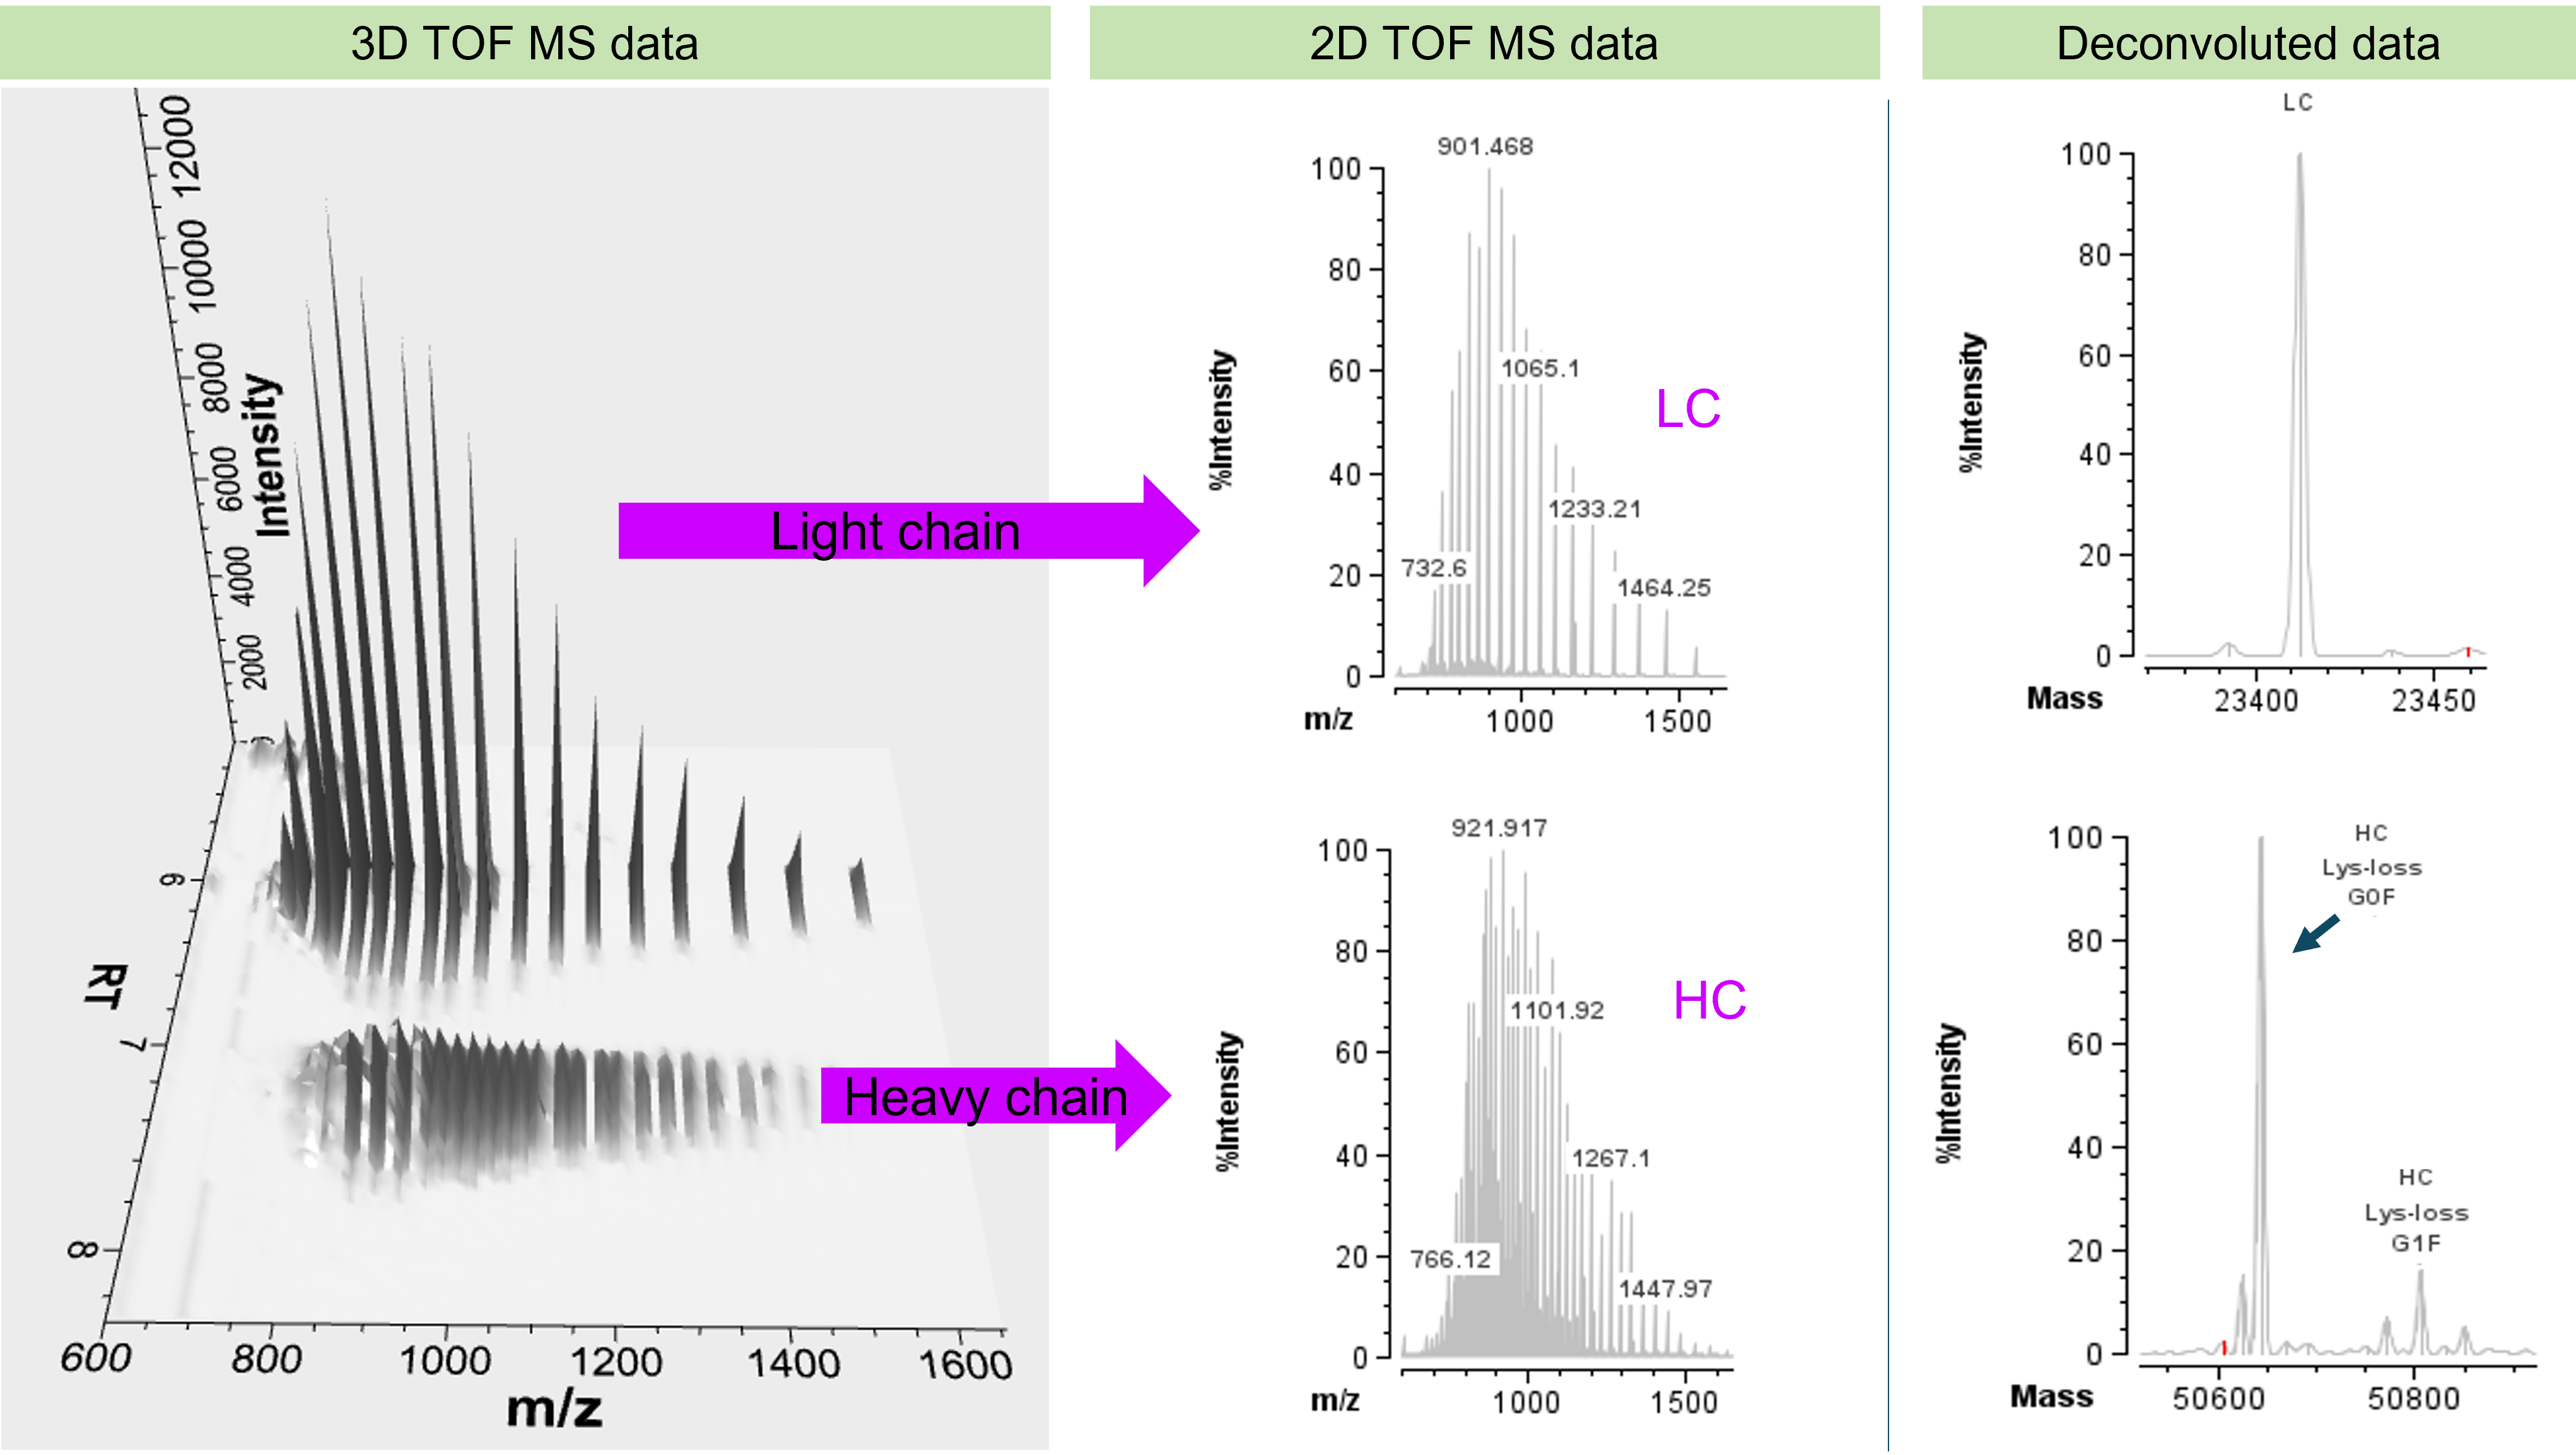
Adalimumab was reduced to its HC and LC subunits using DTT and analyzed with the described LC-UV-MS workflow. To enable detection and confirmation of protein identities, TOF MS data were subsequently imported to the Biologics Explorer software. Prior to deconvolution, raw data were pre-processed to remove potential chemical or electronic noise. Initial inspection can then be performed using the 3D representation of the TOF MS data of the adalimumab subunits to assess data quality and potential protein or small molecule impurities (Figure 2, left). While 2D plots are available as well (Figure 2, middle), the 3D plots reduce the risk of missing any low abundance impurities by providing access to the m/z signals across the RT range. Since the 3D plot did not show any evidence of impurities, TOFMS data of the subunits were subsequently deconvoluted for accurate mass determination of subunits (Figure 2, right) using the standard deconvolution option in the software. Following the deconvolution, peaks were identified and annotated by linking the deconvoluted mass of each peak to respective theoretical sequence information of adalimumab subunits, considering potential modifications, such as, glycosylation on the HC (Figure 2, right).
Figure 2. MS processing and annotation workflow of adalimumab subunits. 3D TOF MS display shows the charge state envelopes of LC and HC on a time-resolved basis (left). Any time slice can be used for the 2D visualization of the TOF MS data (middle section). Upon deconvolution of the TOF MS data of subunits, matching and identification of modifications can be performed based on theoretical sequence information (right).
MS-to-UV retention time alignment and UV peak identification
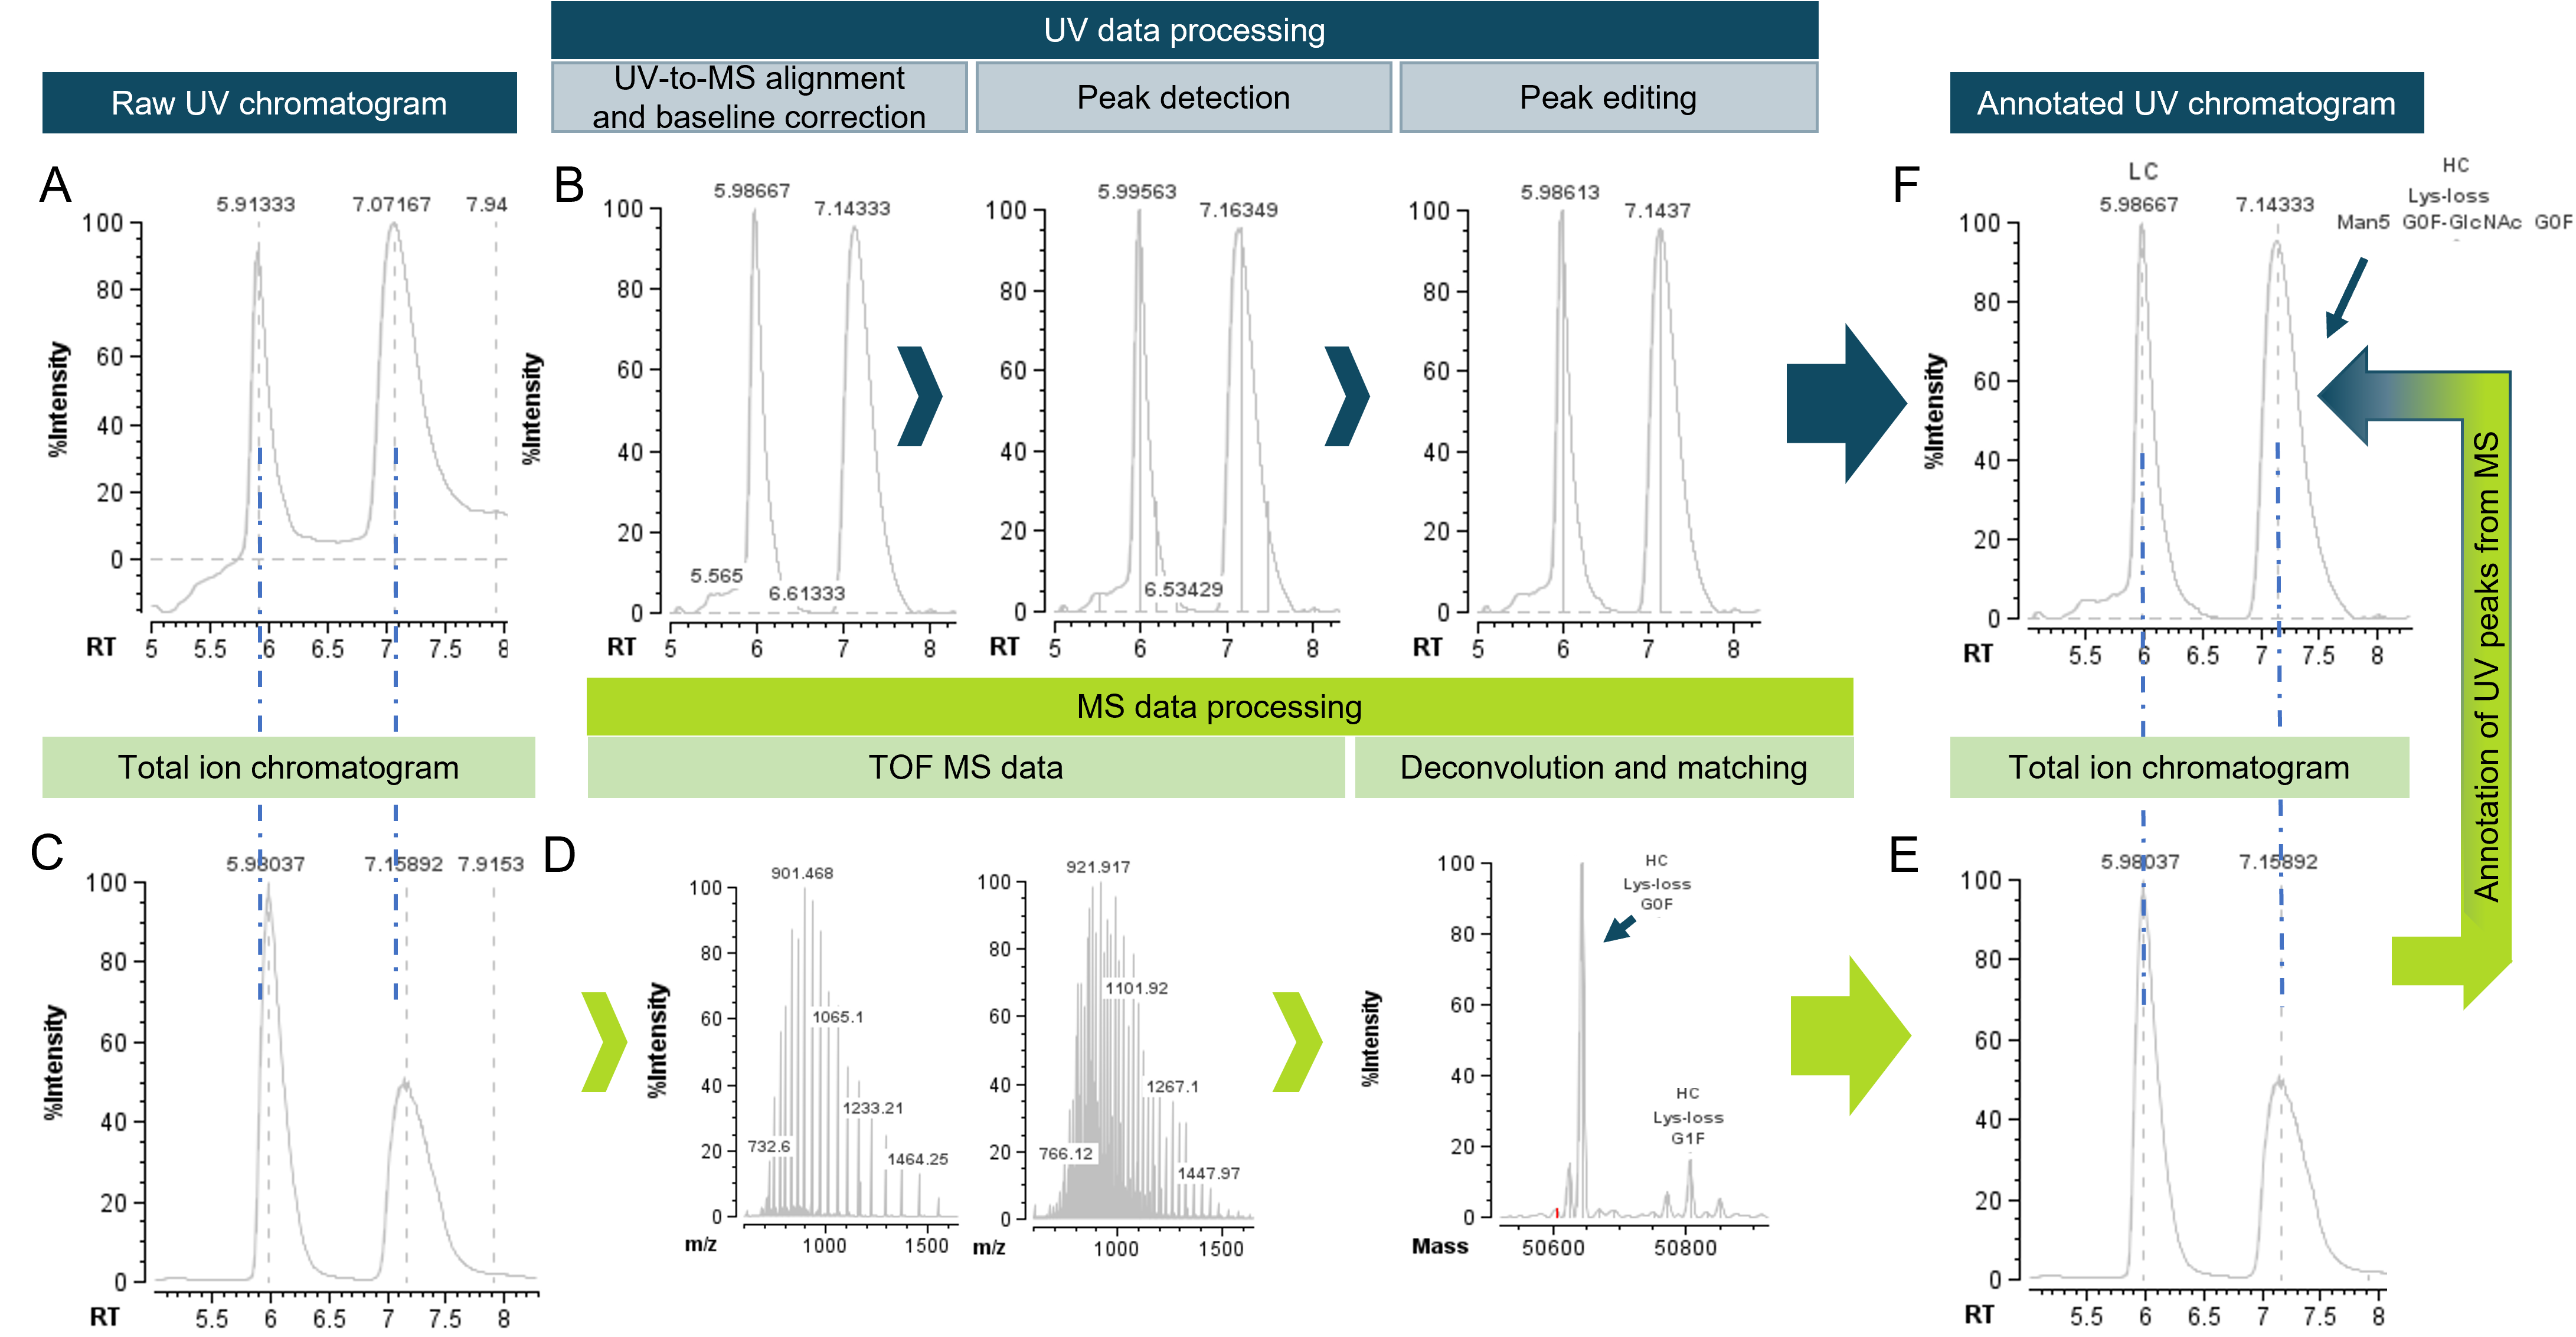
Robust UV methodology is widely used as a detection method when fast and routine analyses are desired, despite its inability in identifying species. The workflow offered by Biologics Explorer software is synergistically linking accurate identification of TOF MS to the robust quantification of LC-UV. The workflow was designed to align retention times of UV data to the total ion chromatogram (TIC) of the corresponding MS data, enabling subsequent linkage of identity information. Due to the sample reaching the UV detector prior to the MS in the presented setup, retention times of the peaks in UV chromatograms were slightly earlier than the retention times of TIC. To achieve the synergy offered by a hybrid LC-UV-MS method, the retention times between UV and MS therefore need to be aligned. Figure 3 demonstrates the UV to MS retention time alignment process on the subunits of adalimumab as an example. The raw UV chromatogram and the TIC clearly demonstrate deviation in retention times (Figure 3A and C), which were aligned after processing (Figure 3F and E) of UV and MS data in the automatic workflow. Accurate quantification of the peaks in UV chromatogram is ensured by several steps, such as, baseline correction, peak detection and peak editing functions (Figure 3B). The baseline subtraction ensures all components of the UV chromatogram being on a relative scale. Therefore, baseline correction constitutes a crucial step in the representation of peaks in a chromatogram, as well as in the quantitative analysis (Figure 3B). The automated peak detection algorithm provides a basis for manual peak editing. While all peaks are automatically recognized and used for relative quantification, a user can exclude peaks used for relative quantification (peak editing step). MS-derived identity of the peaks, demonstrated in the previous section (Figure 2 and Figure 3D), are then linked to the processed, retention-time-aligned UV chromatogram (Figure 3E and F) by the software.
Figure 3. UV-MS data processing workflow for adalimumab subunits. Retention time differences of UV chromatogram (A) compared to TIC (C) prior to processing. Representative UV processing nodes include baseline correction, peak detection and optional peak editing in order to exclude peaks manually from subsequent quantification (B). TOF MS data of LC and HC is used for deconvolution and matching with theoretical sequence information (D). The retention time from the MS data (E) is used for aligning the UV data (F). Additionally, MS annotation of identity of peaks is linked to the processed UV chromatogram (F).
Relative quantification of impurities
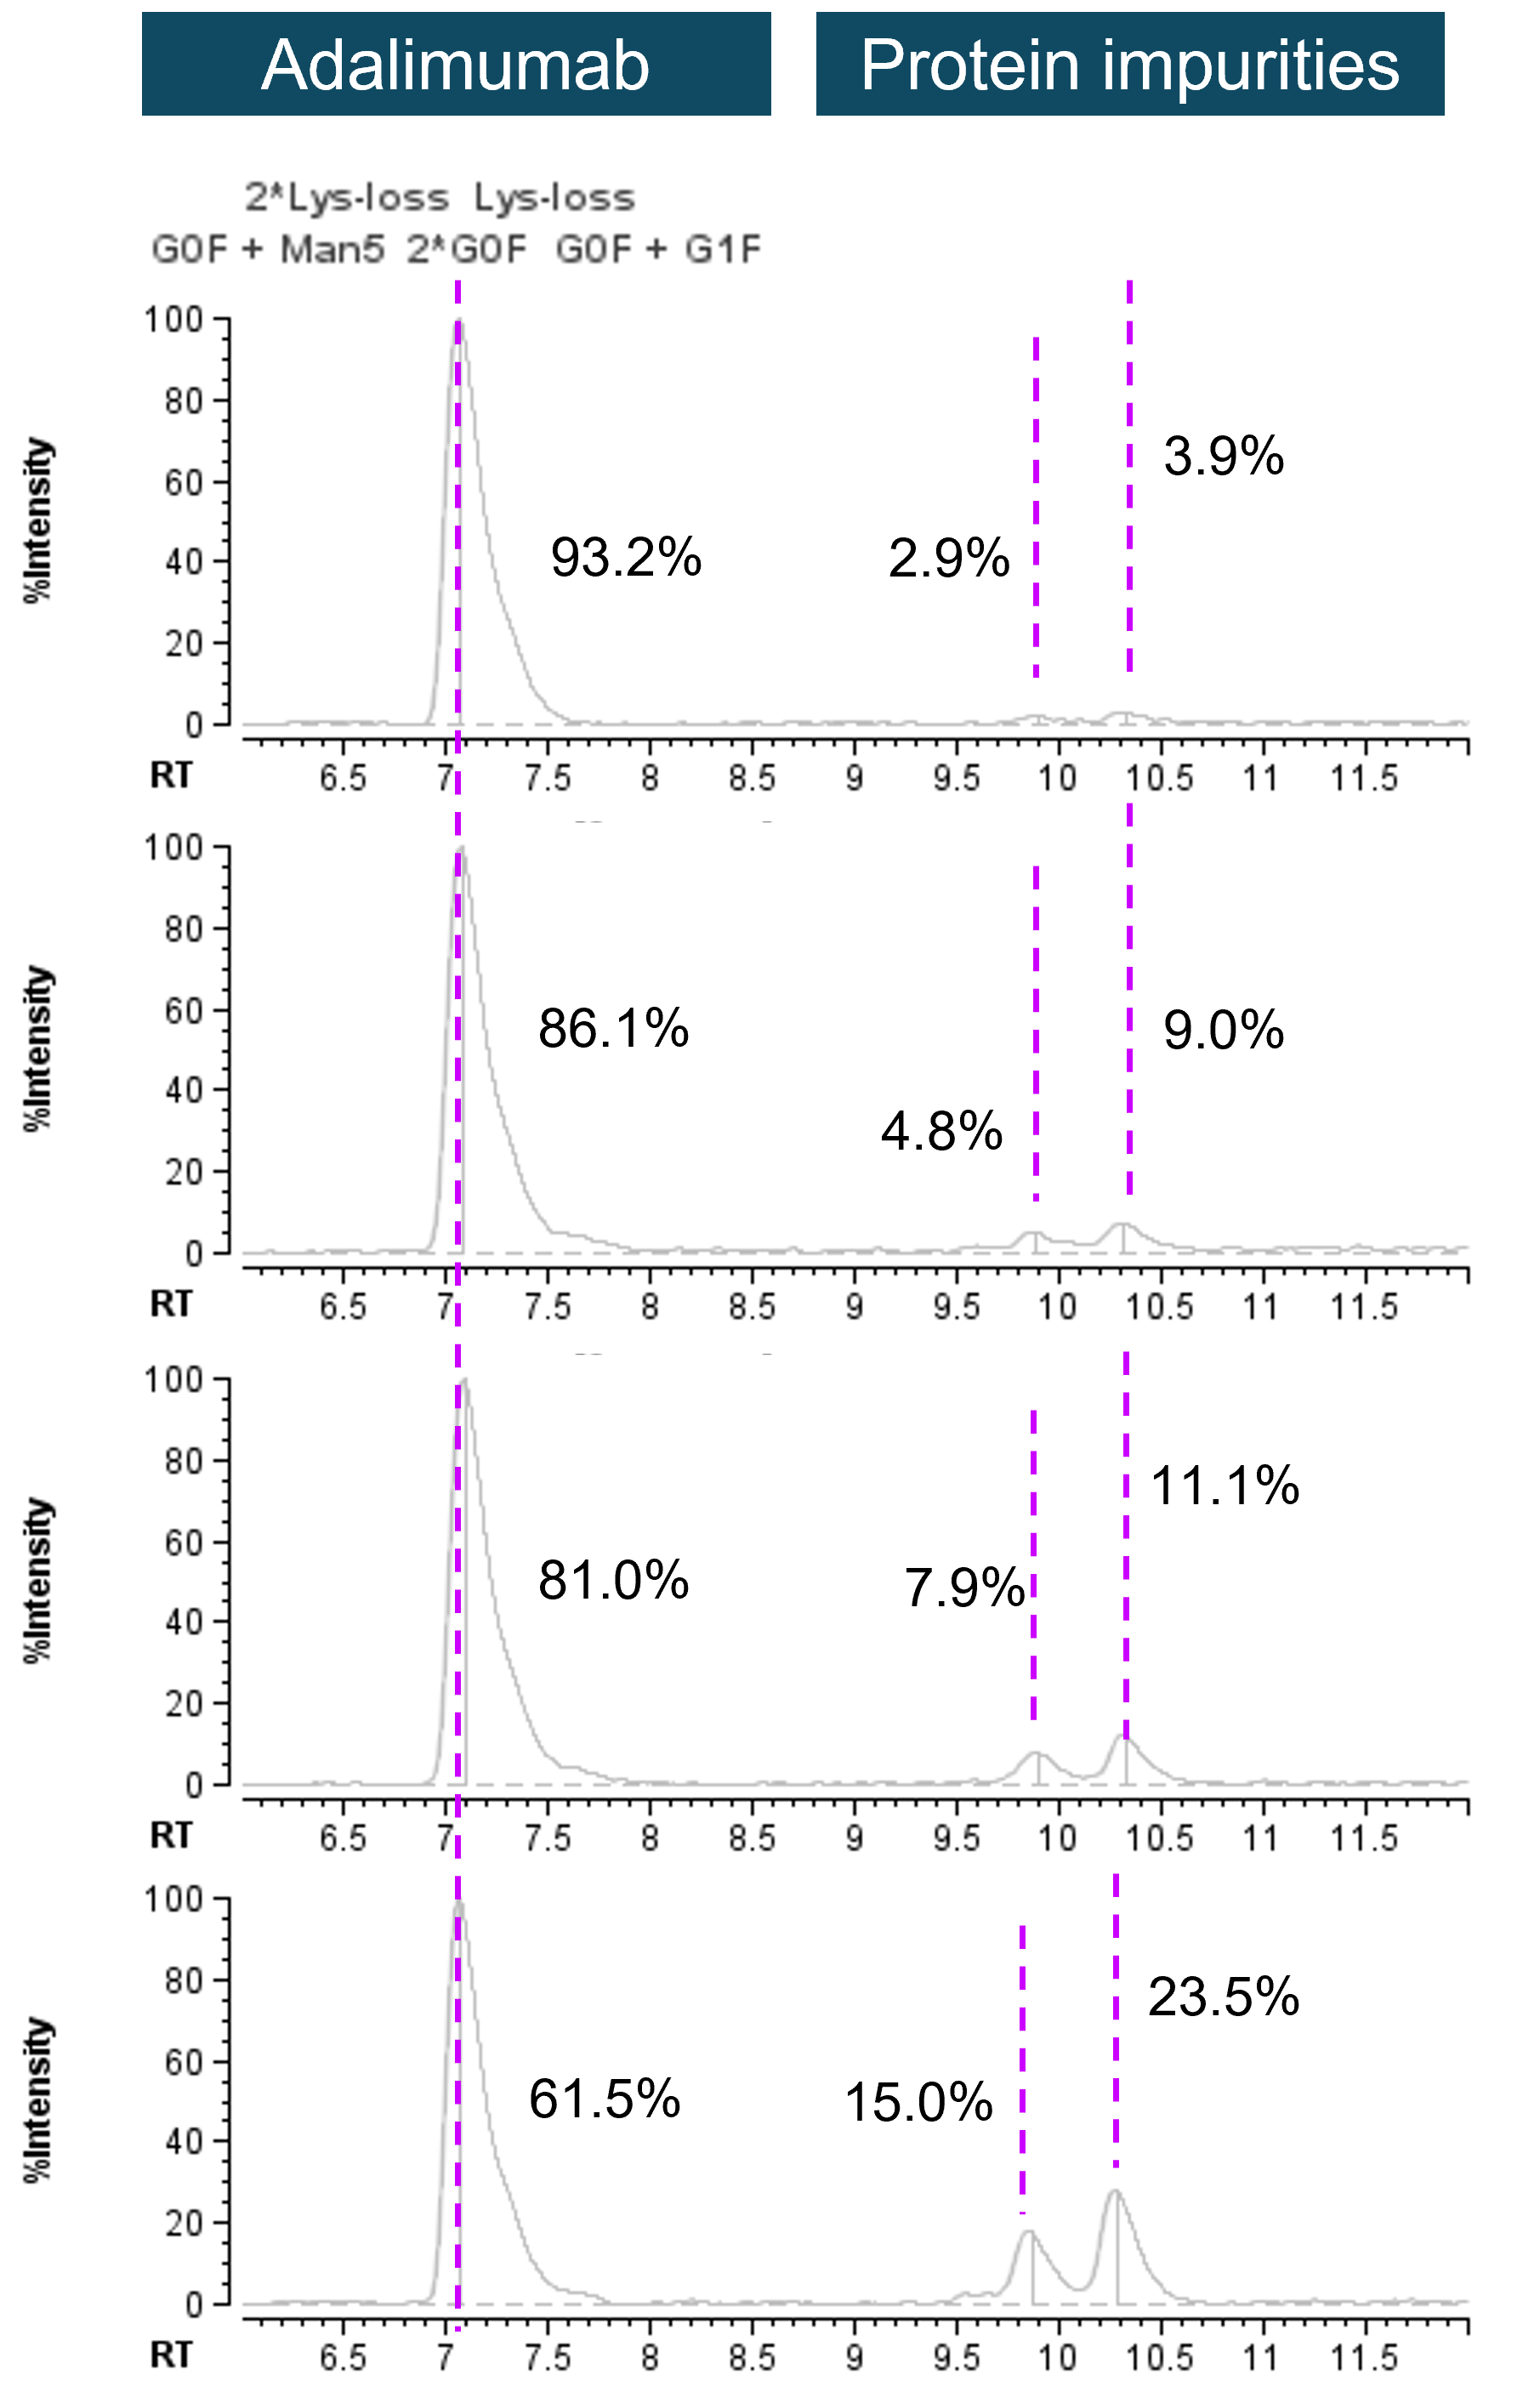
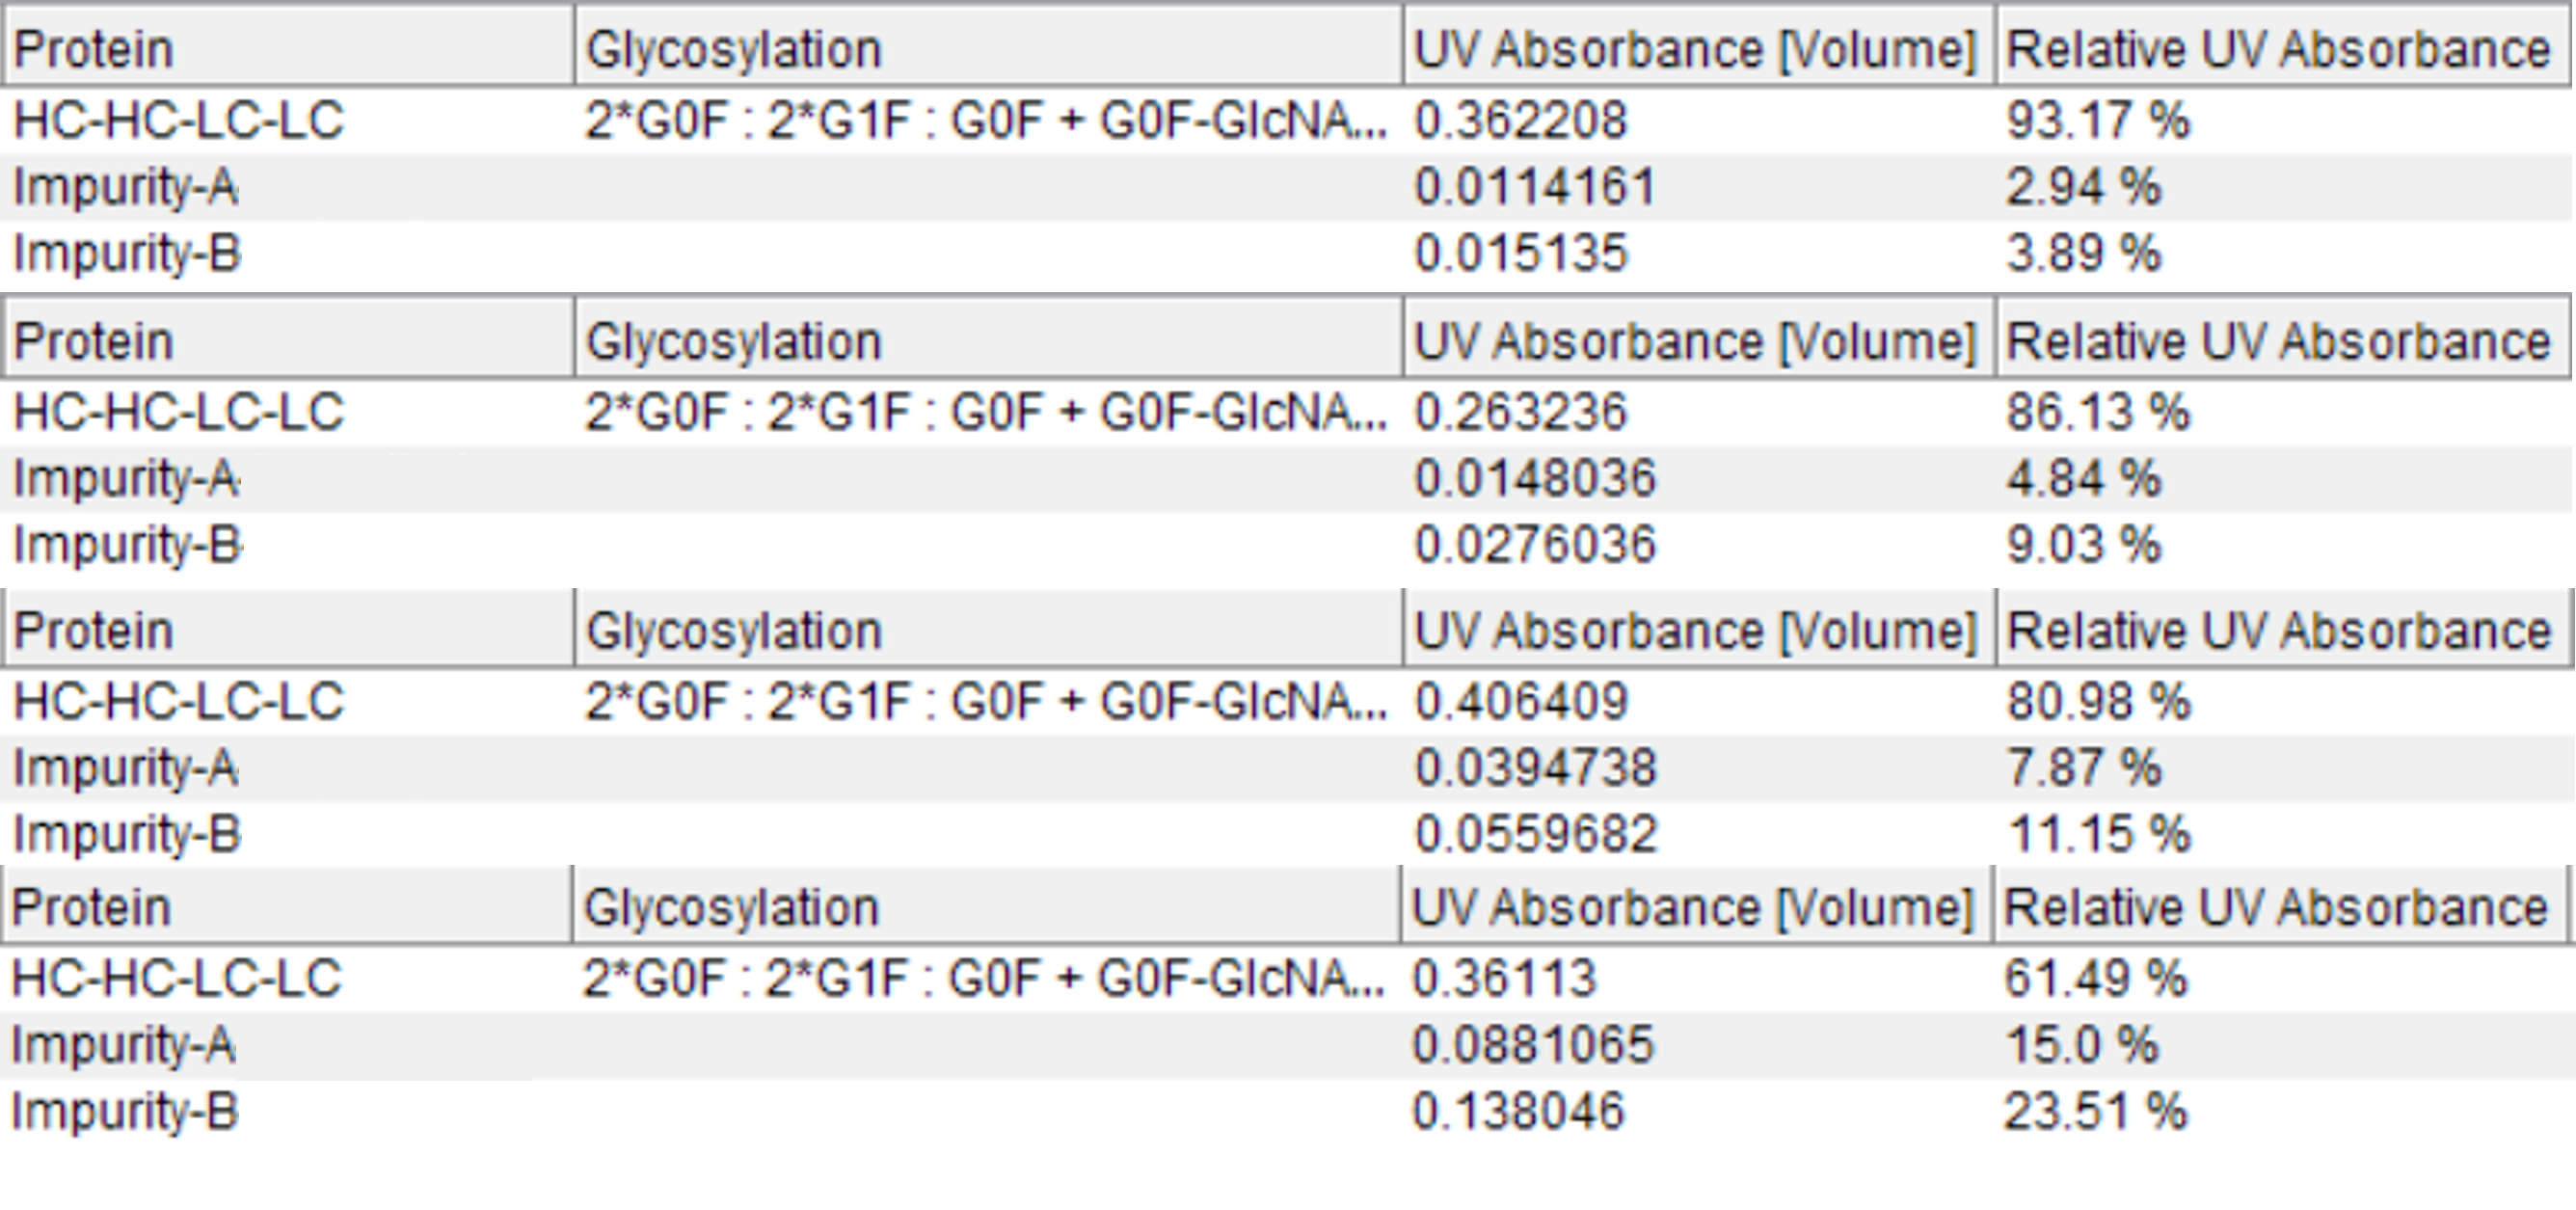
Accurate identification and quantification of impurities is indispensable to guarantee the product’s safety and quality in biopharma development pipeline. LC-UV-based detection is widely used in impurity profiling. When coupled to the highly accurate MS identification, users can benefit from flexibility and confidence in relative quantification and reliable identification. To demonstrate the hybrid LC-UV-MS methodology, intact adalimumab samples were spiked with different concentrations of β-lactoglobulin to mimic protein impurities. The previously discussed workflow was executed to process raw TOF MS data, obtaining protein identities and enabling retention time alignment and UV chromatogram annotations. Figure 4 shows the annotated UV chromatograms of adalimumab with increasing amounts of the protein impurities, which was observed as 2 distinct peaks in the UV chromatograms (Figure 4). Percentages in Figure 4 represent relative quantification results based on the UV data. These values were obtained with the automatic UV quantification within the software (Figure 5).
Figure 4. UV chromatograms of intact adalimumab spiked with different levels of protein impurities. UV data of mAb and spiked-in protein impurities were used for relative quantification of species as indicated by percentages.
Figure 5. Automatic quantification of protein species using UV data. The table from the Biologics Explorer software shows an entry per identified species based on MS information and the associated relative quantification based on UV detection.
Conclusion
- Increased confidence of peak identification of LC-UV chromatograms was achieved by linking high-quality deconvoluted MS data, highlighting the potential of LC-UV-MS in biopharma characterization and control processes
- Highly flexible and complementary UV-based quantification allows users to bypass quantification challenges linked to MS, such as, different ionization efficiencies
- The risk of missing protein impurities in protein therapeutics can be mitigated by powerful 3D visualization and deconvolution tools
References
- FDA. (2004). Guidance for Industry: PAT- A framework for innovative pharmaceutical development, and quality assurance. U.S. Department of Health and Human Services, Food and Drug Administration
 Click to enlarge
 Click to enlarge
 Click to enlarge
 Click to enlarge
 Click to enlarge
 Click to enlarge
 Click to enlarge
 Click to enlarge