Addressing an unmet need: Developing a new method for purity analysis of large-sized RNA drugs
Jane Luo1, Dawn Chen1, Tingting Li1, Shigeki J Miyake-Stoner2, Annie C Chou2, Jacqueline Posy2, Andrew Geall2, Kerstin Pohl1 and Sahana Mollah1
1SCIEX, USA; 2Replicate Bioscience, USA
Abstract
This technical note outlines the development of a new method for assessing the purity of a 16 kilobase (kb) self-replicating RNA (srRNA), a type of messenger RNA (mRNA), using capillary gel electrophoresis with laser-induced fluorescence detection (CGE-LIF). This method aims to overcome the difficulties of characterizing large RNA molecules, such as srRNA or self-amplifying RNA (saRNA). Due to their self-replicative properties, srRNA and saRNA vaccines require lower doses than conventional RNA vaccines, thus reducing the burden of manufacturing and enabling faster pandemic responses.1 However, these RNA molecules range from 9 to 16 kb in size. Traditional workflows, which are generally optimized for RNAs up to 6 or 9 kb, struggle with these large sizes. This technical note presents a new method developed by modifying the dsDNA 1000 gel and optimizing CGE-LIF conditions. These changes provide high-resolution separation (Figure 1) and reproducible purity analysis of a 16 kb srRNA. This development also paves the way for the characterization of other large-sized RNA vaccines and therapeutics.
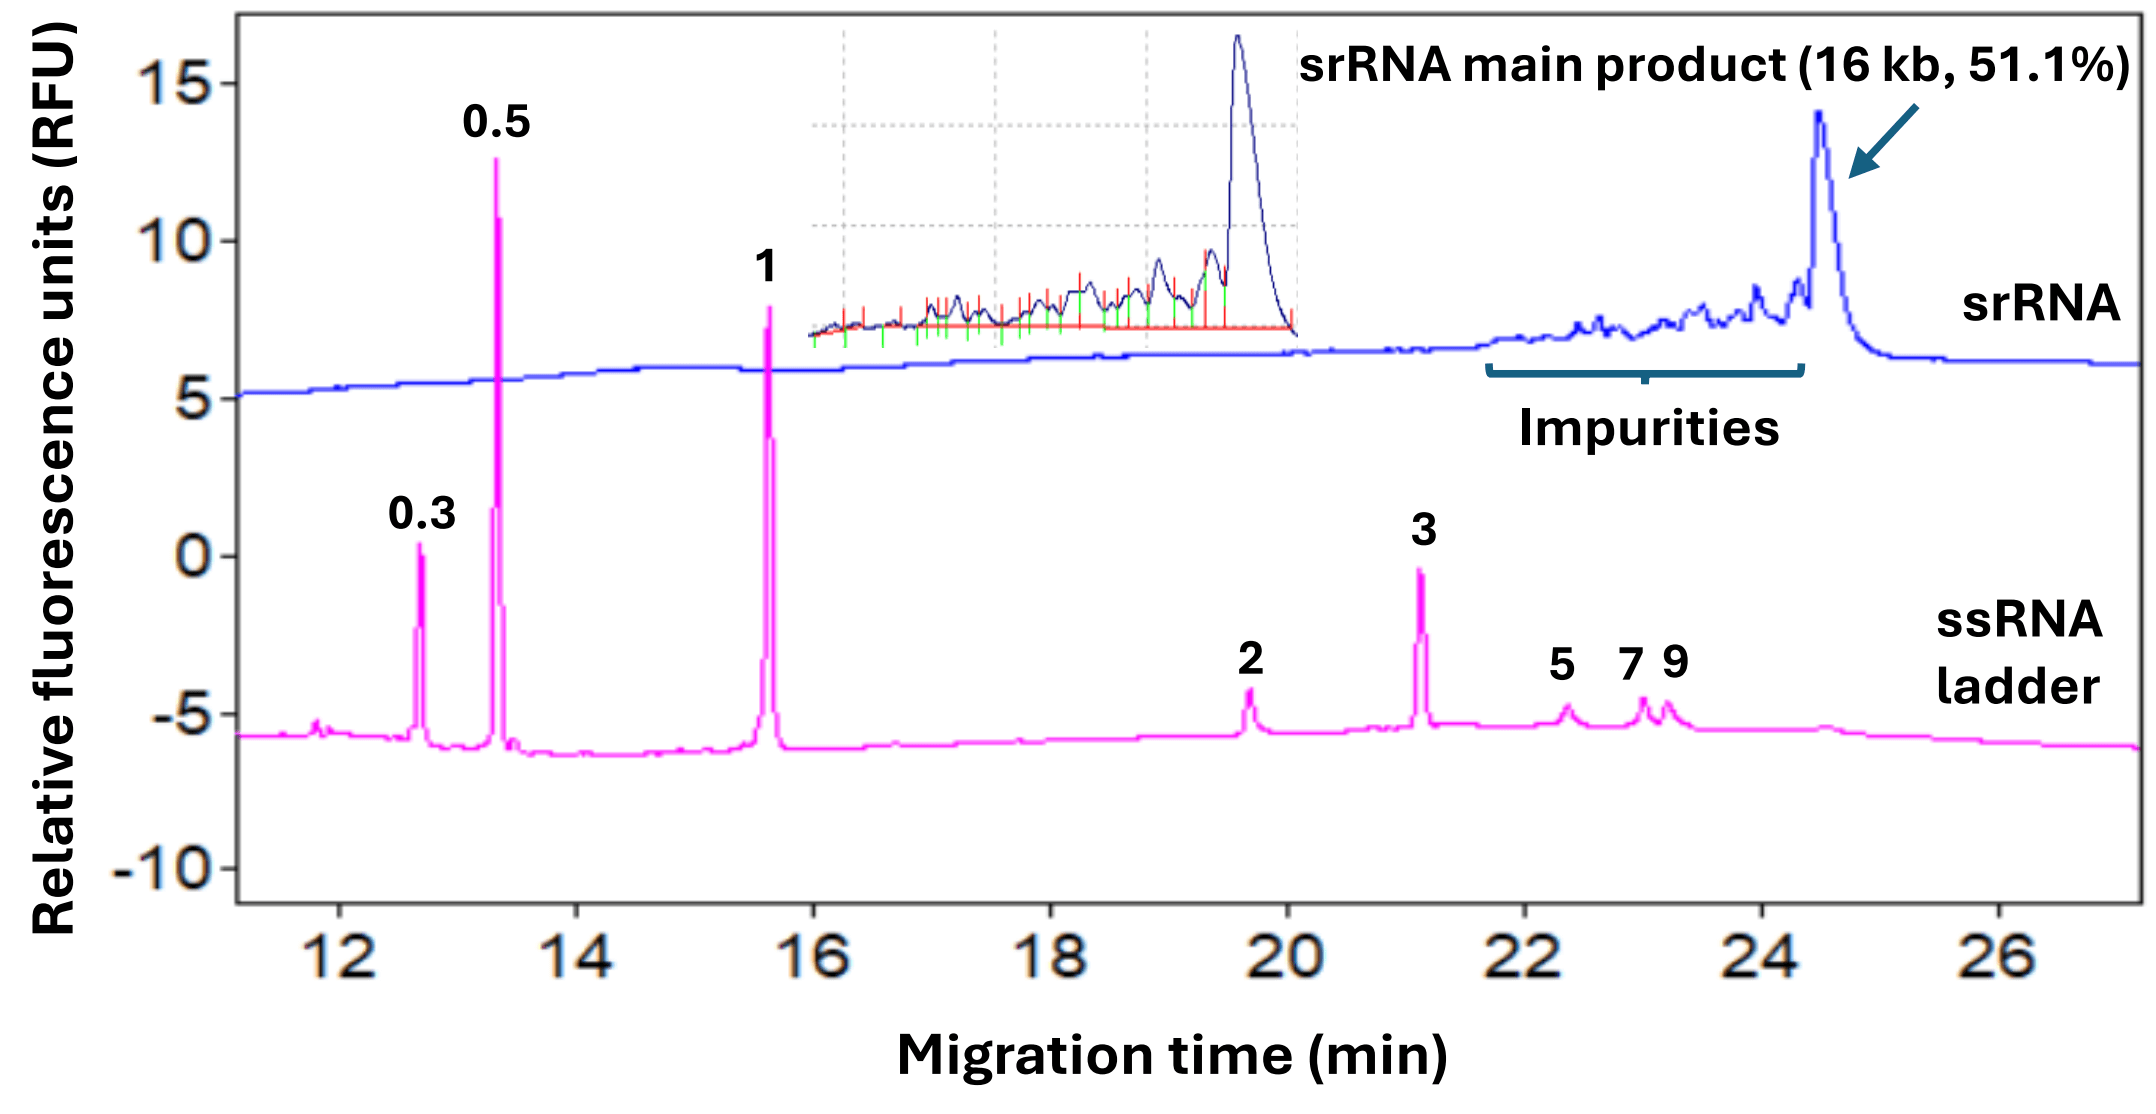
Figure 1: Purity analysis of a research-grade, 16 kb srRNA sample by CGE-LIF. High-resolution separation of the srRNA main product from its impurities was obtained using a denaturing dsDNA 1000 gel on the PA 800 Plus system. The sizes for the standards in the ssRNA ladder are labeled in kb. The purity of the srRNA main product was 51.1% for this sample. The inset shows the peak integration of the srRNA analysis.
Key features of the new method for analysis of large-sized RNA drugs
- New method for purity analysis of a 16 kb srRNA: Addresses the challenges in analyzing RNA up to 16 kb
- High-resolution separation of the main product from impurities: Enables reliable quantitation of srRNA purity
- Comparable purity results with electrokinetic and pressure injections of the 16 kb srRNA: Offers flexibility in srRNA analysis
- Excellent assay repeatability with both electrokinetic and pressure injection modes: Achieves relative standard deviations (RSDs) of <1.5% for migration time and corrected peak area percentage (CPA%) of the srRNA main product
- Simple modification of a kit-based method with coated capillary: Streamlines the operations and ensures consistent results
Introduction
The success of the mRNA vaccine against the SARS-CoV-2 virus during the COVID-19 pandemic has led to rapid advancements in the RNA vaccine space. Currently, there are 3 major types of RNA vaccines: conventional, base-modified and self-amplifying. In addition to the sequence encoding the protein of interest, saRNA vaccines contain viral sequences encoding an RNA replicase, enabling it to make copies of itself following cellular uptake. Therefore, saRNA vaccines can be delivered at a lower dose than conventional mRNA vaccines to achieve similar levels of immune responses. The srRNA vaccines are derived from second-generation vectors with synthetic optimization.2 Due to the requirement of including the coding sequences for the replicase, saRNA and srRNA vaccines have large sizes, ranging from 9 to over 16 kb. Current analytical methods that work well with 2 to 4 kb mRNA modalities have challenges in analyzing saRNA and srRNA vaccines. A recent publication described using CGE-LIF with a homebrew separation matrix to analyze a saRNA vaccine of 11.5 kb with some success.3 However, this type of method faces challenges associated with variations inherent in using homebrew separation matrices. In this technical note, a new method was developed by modifying the dsDNA 1000 gel and optimizing CGE-LIF conditions, providing high-resolution separation and reproducible purity analysis of a 16 kb srRNA using kit-based reagents.
Methods
Materials: The dsDNA 1000 kit (P/N: 477410) containing the DNA capillary (100 µm ID, 65 cm), the dsDNA 1000 gel buffer and other components was from SCIEX (Framingham, MA). The RNA 9000 Purity & Integrity kit (P/N: C48231) containing the ssRNA ladder, SYBR™ Green II RNA gel stain* and other components was from SCIEX. Sample loading solution (SLS, P/N: 608082), Universal Vials (P/N: A62251), Universal Vial Caps (P/N: A62250), PCR Microvials (P/N: 144709), CE Grade water (P/N: C48034), and NanoVial (P/N: 5043467) were from SCIEX. The urea (P/N: 29700), Nuclease-free water (NFW, P/N: AM9932) and 5X Tris-borate-EDTA (TBE) buffer (P/N: J63487.K3) were from Thermo Fisher Scientific (Waltham, MA). The 0.2 μm syringe filter (P/N: 4612) was from PALL (Port Washington, NY). The LABQUAKE rotator (model: 400100) was from Barnstead International (Dubuque, IA). The research-grade, 16 kb srRNA was from Replicate Bioscience (San Diego, CA).
Cartridge assembly: The DNA capillary (P/N: 477477) was installed per instructions on the kit insert (P/N: 726412) in the dsDNA 1000 kit. The total capillary length was 40.2 cm, with a length of 30 cm to the detection window. Since the inner wall of the DNA capillary is coated, the cartridge assembly should be carried out promptly. When the cartridge assembly is complete, the capillary ends must be immersed in liquid (water or buffer) to prevent the coating from drying out.
LIF calibration: To ensure a consistent response of the LIF detector throughout this study, the LIF detector was calibrated using the LIF Calibration Wizard and Performance test mix (P/N: 726022), following the instructions in the LIFluor EnhanCE user’s guide (P/N: 725824). The target relative fluorescence units (RFU) value was set at 62. This calibration was done whenever the capillary, LIF detector or laser was changed.
General conditions for CGE-LIF analysis of RNA: To minimize sample degradation, all samples, NFW and buffers were placed on ice before use. Filter tips were used for all liquid transfer steps.
Preparation of the denaturing dsDNA 1000 gel: A 100 mL stock of 8M urea solution was made by dissolving 48.1 grams of urea in deionized water without heat. The solution was filtered with a 0.2 μm syringe filter. The dsDNA 1000 gel was rehydrated by adding 20 mL of 8M urea to a bottle of the lyophilized dsDNA 1000 gel. After the gel bottle was securely capped, it was attached to a rotator and rotated in a cold room for about 72 hours. A solution of 1X TBE and 5.73M urea (1X TBE/5.73M urea solution) was made by adding 800 µL of the 5X TBE, 2865 µL of 8M urea and 335 µL of NFW in a 50 mL tube, inverting it gently 10 times and filtering it with a 0.2 μm syringe filter. The 8M urea solution, the 1X TBE/5.73M urea solution and the rehydrated dsDNA 1000 gel can be stored in small aliquots at 2–8°C for 1 month. Before sample analysis, the rehydrated dsDNA 1000 gel and the 1X TBE/5.73M urea solution were warmed to room temperature. The final gel (the denaturing dsDNA 1000 gel) was made by diluting the rehydrated dsDNA 1000 gel 4-fold with the 1X TBE/5.73M urea solution in a 50 mL tube and then filtering it with a 0.2 μm syringe filter. The denaturing dsDNA 1000 gel contained 6.3M urea and 1X TBE. Finally, 24 µL of the SYBR Green II RNA gel stain was added to 6 mL of the denaturing dsDNA 1000 gel in a 50 mL tube, mixed well by inverting 20 times and then transferred to the universal vials.
Sample preparation: In a 200 µL thin-walled PCR tube, 2.5 µL of the ssRNA ladder from the RNA 9000 Purity & Integrity kit was mixed with 100 µL of SLS, heated at 70°C for 5 minutes, then quickly chilled in an ice water bath for at least 5 min. Fifty µL was transferred to a microvial for CE analysis. For srRNA, 2 µL of stock 1 mg/mL srRNA was added to 98 µL of SLS (final concentration: 20 ng/µL) in a 200 µL thin-walled PCR tube. The mixture was heated at 65°C for 5 minutes or the indicated amount of time (Table 1). After chilling in an ice water bath for at least 5 min, 50 µL was transferred to a microvial for CE analysis. Alternatively, 15 µL was transferred to a nanovial for CE analysis.
Preparation of buffer trays: The buffer trays were set up according to vial positions in the time programs shown in Figure 2. Each water vial was filled with 1.5 mL of CE Grade water, each waste vial was filled with 1 mL of CE Grade water and each gel vial was filled with 1.5 mL of the denaturing dsDNA 1000 gel. Three sets of water dip vials were set up to ensure minimal sample carryover and better repeatability.
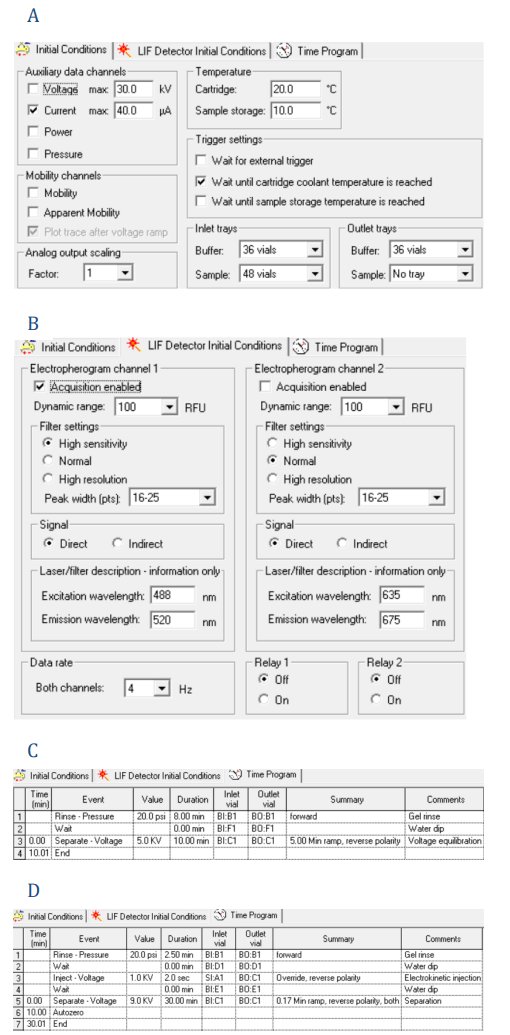 Click to enlarge
Figure 2: Parameter settings used in this study. Settings are shown for the initial conditions (A), LIF detection initial conditions (B), time programs for conditioning (C), separation with electrokinetic injection (D), separation with pressure injection (E) and shutdown (F).
Instrument and software: A PA 800 Plus system equipped with LIF detection and a solid-state laser with excitation wavelength at 488 nm and a 520 nm bandpass emission filter was from SCIEX. Data acquisition and analysis were performed using 32 Karat software v10.2.
Instrument setup: The “Initial Conditions” and “LIF Detector Initial Conditions” were set up as indicated in Figures 2A and 2B. The same initial conditions were used for all 4 methods: capillary conditioning, separation with electrokinetic injection, separation with pressure injection, and shut down, except the capillary temperature was set to 15°C for shut down. The time programs for the 4 methods are shown in Figures 2C–2F.
Results and discussion
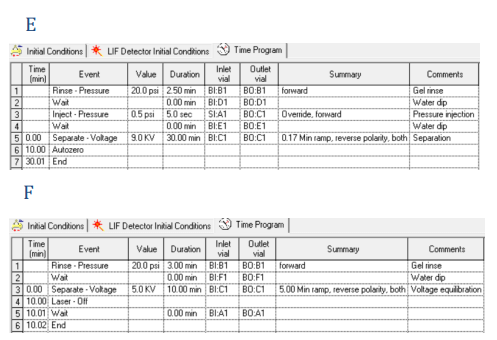
Optimization of the gel formulation: The dsDNA 1000 gel has been widely used for over 2 decades for sizing and purity analysis of dsDNA by CE under native conditions. Its popular applications include sizing analysis of linearized plasmid DNA, restriction profiling for plasmid integrity and analysis of host cell DNA in influenza and respiratory syncytial virus vaccines.4-5 This technical note explored its utility in analyzing large-sized single-stranded RNA. Due to the large size (16 kb) of the srRNA sample, the regular dsDNA 1000 gel needed to be diluted to achieve a realistic separation time. In addition, since large-sized RNAs, such as srRNA, contain higher-order structures under native conditions, a denaturant must be added to the gel to ensure the srRNA sample remains in the unfolded conformation during separation. Initial method development efforts included rehydrating the dsDNA 1000 gel in 8M urea instead of deionized water. This gel was diluted 3- or 4-fold so that the final formulation contained 7.4M urea and 1X TBE. The 4-fold dilution produced a slightly better resolution with a slightly faster migration time than the 3-fold dilution (data not shown). Further optimization included a titration of the urea concentration. When urea concentration was below 6M, an inconsistent peak profile with low resolution was observed, possibly due to a combination of changes in gel viscosity and refolding of the srRNA sample during separation (data not shown). In contrast, peak tailing appeared when the urea concentration was too high. As shown in Figure 3, when the urea concentration was reduced from 7.4M to 6.3M, the peak shape significantly improved. A concurrent increase in resolution was also observed. Therefore, the 6.3M urea concentration was used for later experiments. The final gel formulation, containing 1X TBE, 6.3M urea and a 4-fold dilution of the rehydrated dsDNA 1000 gel, was designated as the denaturing dsDNA 1000 gel.
Figure 3: Optimization of the urea concentration in the gel formulation. The srRNA sample was analyzed using rehydrated dsDNA 1000 gel containing either 7.4M (pink trace) or 6.3M (blue trace) urea. The sample was introduced at 2 kV for 2 seconds. The separation voltage was 5 kV.
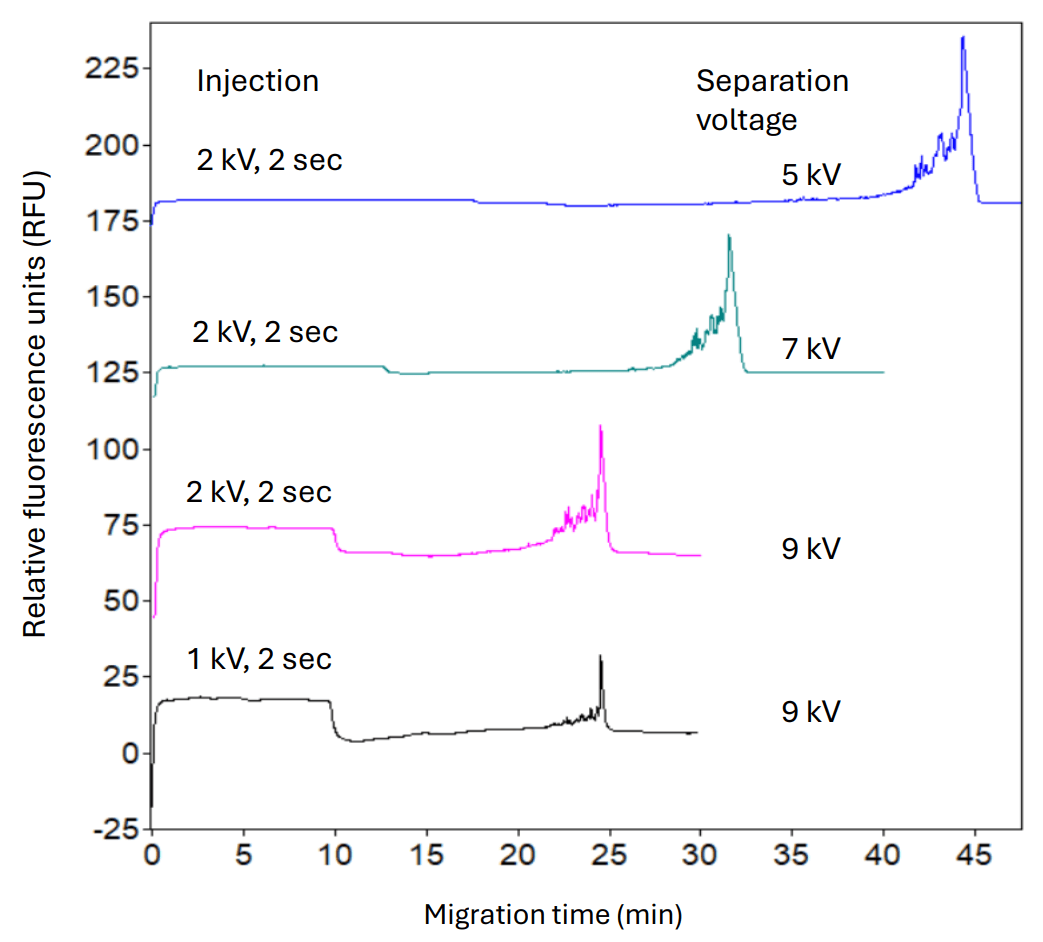
Selection of optimal separation voltage and sample injection conditions: Manufacturers in cell and gene therapy desire faster, high-resolution analytical methods. Decreasing urea concentration or increasing the capillary temperature to 30°C during separation improved migration time at the cost of reduced resolution (data not shown). Therefore, further optimization was performed by testing different separation voltage and sample injection conditions. As indicated in Figure 4, increasing the separation voltage from 5 kV to 7 kV and then to 9 kV gradually reduced the migration time of the srRNA main product peak from 44 minutes to 25 minutes. The peak shape was also improved, and better resolution was achieved between the srRNA main product peak and impurities. When the sample injection voltage was reduced from 2 kV to 1 kV, the peak shape and resolution were further improved. In summary, injecting the srRNA sample at 1 kV for 2 seconds and separating at 9 kV produced the best resolution between the srRNA main product peak and impurities.
Figure 4: Optimization of separation voltage and sample injection time. The srRNA sample was separated using the denaturing dsDNA 1000 gel on the PA 800 Plus system at different separation voltages or injection conditions. The optimal conditions to achieve the highest resolution were injecting at 1 kV for 2 seconds and separating at 9 kV.
Optimization of sample treatment conditions: Since the srRNA is prone to degradation, the heat treatment to unfold the higher-order structure must be gentle and effective. A quick time course experiment was done to test different incubation times at 65°C and their impact on the srRNA analysis. As shown in Table 1, the purity decreased when the incubation time was longer than 5 minutes. At 0 and 2 minutes of incubation time, the peak shape and resolution were not as consistent as at 5 minutes of incubation time (data not shown). Therefore, 5 minutes of incubation at 65°C was the optimal sample treatment condition.
Table 1: Optimization of sample treatment conditions. The srRNA sample was heated at 65°C for indicated amounts of time and quickly chilled in an ice-water bath before analysis on the PA 800 Plus system. The purity of the srRNA sample was measured using the CPA% of the main product peak.

High-resolution purity analysis of the srRNA under optimized conditions: The electropherogram at the top of Figure 1 was obtained with the srRNA sample using the optimized conditions. The srRNA sample was treated at 65°C for 5 minutes before injection at 1 kV for 2 seconds and separation at 9 kV by CGE-LIF in the denaturing dsDNA 1000 gel. The srRNA main product was well separated from the impurities, facilitating data analysis for purity assessment. This separation quality was an advantage, as the impurities in the same sample separated by agarose gel electrophoresis were detected as smears that were poorly separated from the main product (data not shown). The CPA% of the main product was 51.1% by CGE-LIF. This purity level was consistent with the expectations for a research-grade srRNA sample. The lower trace in Figure 1 displays the electropherogram obtained with the ssRNA ladder, showing the high-resolution separation of the standard fragments, except for the 7 kb and 9 kb standards. Based on our experience, the resolution between these 2 standard fragments did not closely correlate to the resolution between the srRNA main product and its impurity peaks. The optimal conditions were selected solely based on results obtained with the srRNA sample.
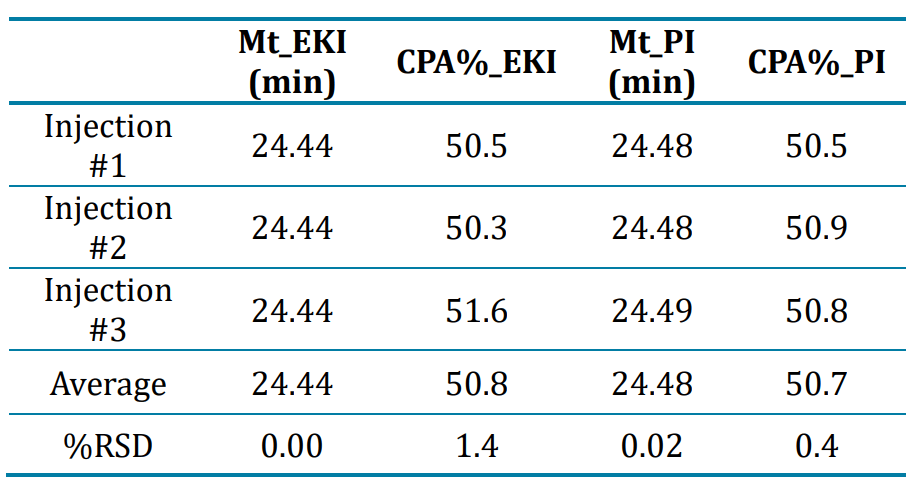
Excellent assay repeatability of srRNA analysis by CGE-LIF with electrokinetic and pressure injections: Assay repeatability was tested by 3 consecutive injections at 1 kV for 2 seconds from the same srRNA sample vial. Results in Figure 5A showed consistent peak profiles between all 3 injections. The migration times of the srRNA main product were identical in the 3 injections and the CPA% values for the main product were consistent for the 3 injections (Table 2), demonstrating excellent assay repeatability. Furthermore, another repeatability test was performed by 3 consecutive pressure injections at 0.5 psi for 5 seconds from the same srRNA sample vial. Results summarized in Figure 5B and Table 2 displayed consistent peak profiles, migration times and CPA% values of the srRNA main product, showcasing excellent assay repeatability with pressure injection. The signal obtained with pressure injection at 0.5 psi for 5 seconds was higher than that obtained with electrokinetic injections at 1 kV for 2 seconds of the same srRNA sample, possibly due to different amounts of the sample injected under the 2 conditions. However, the purity obtained from both injection modes was comparable. Therefore, users have the flexibility to choose either injection mode based on the characteristics of their samples. For example, pressure injection might be more suitable for in-process development samples than electrokinetic injection because a consistent amount of sample can be injected by pressure injection regardless of sample ionic strength. Furthermore, various sample stacking techniques can be explored when higher sensitivity is needed.
Figure 5: Excellent assay repeatability of srRNA analysis by CGE-LIF with electrokinetic (A) and pressure (B) injections. The srRNA sample was injected from the same sample vial for 3 consecutive injections by either electrokinetic (1 kV, 2 seconds) or pressure (0.5 psi, 5 seconds) injection and analyzed on the PA 800 Plus system with a neutral capillary cartridge and the denaturing dsDNA 1000 gel. The bracket shows the impurities. The srRNA purity, determined as the CPA% of the main product, is indicated above each electropherogram.
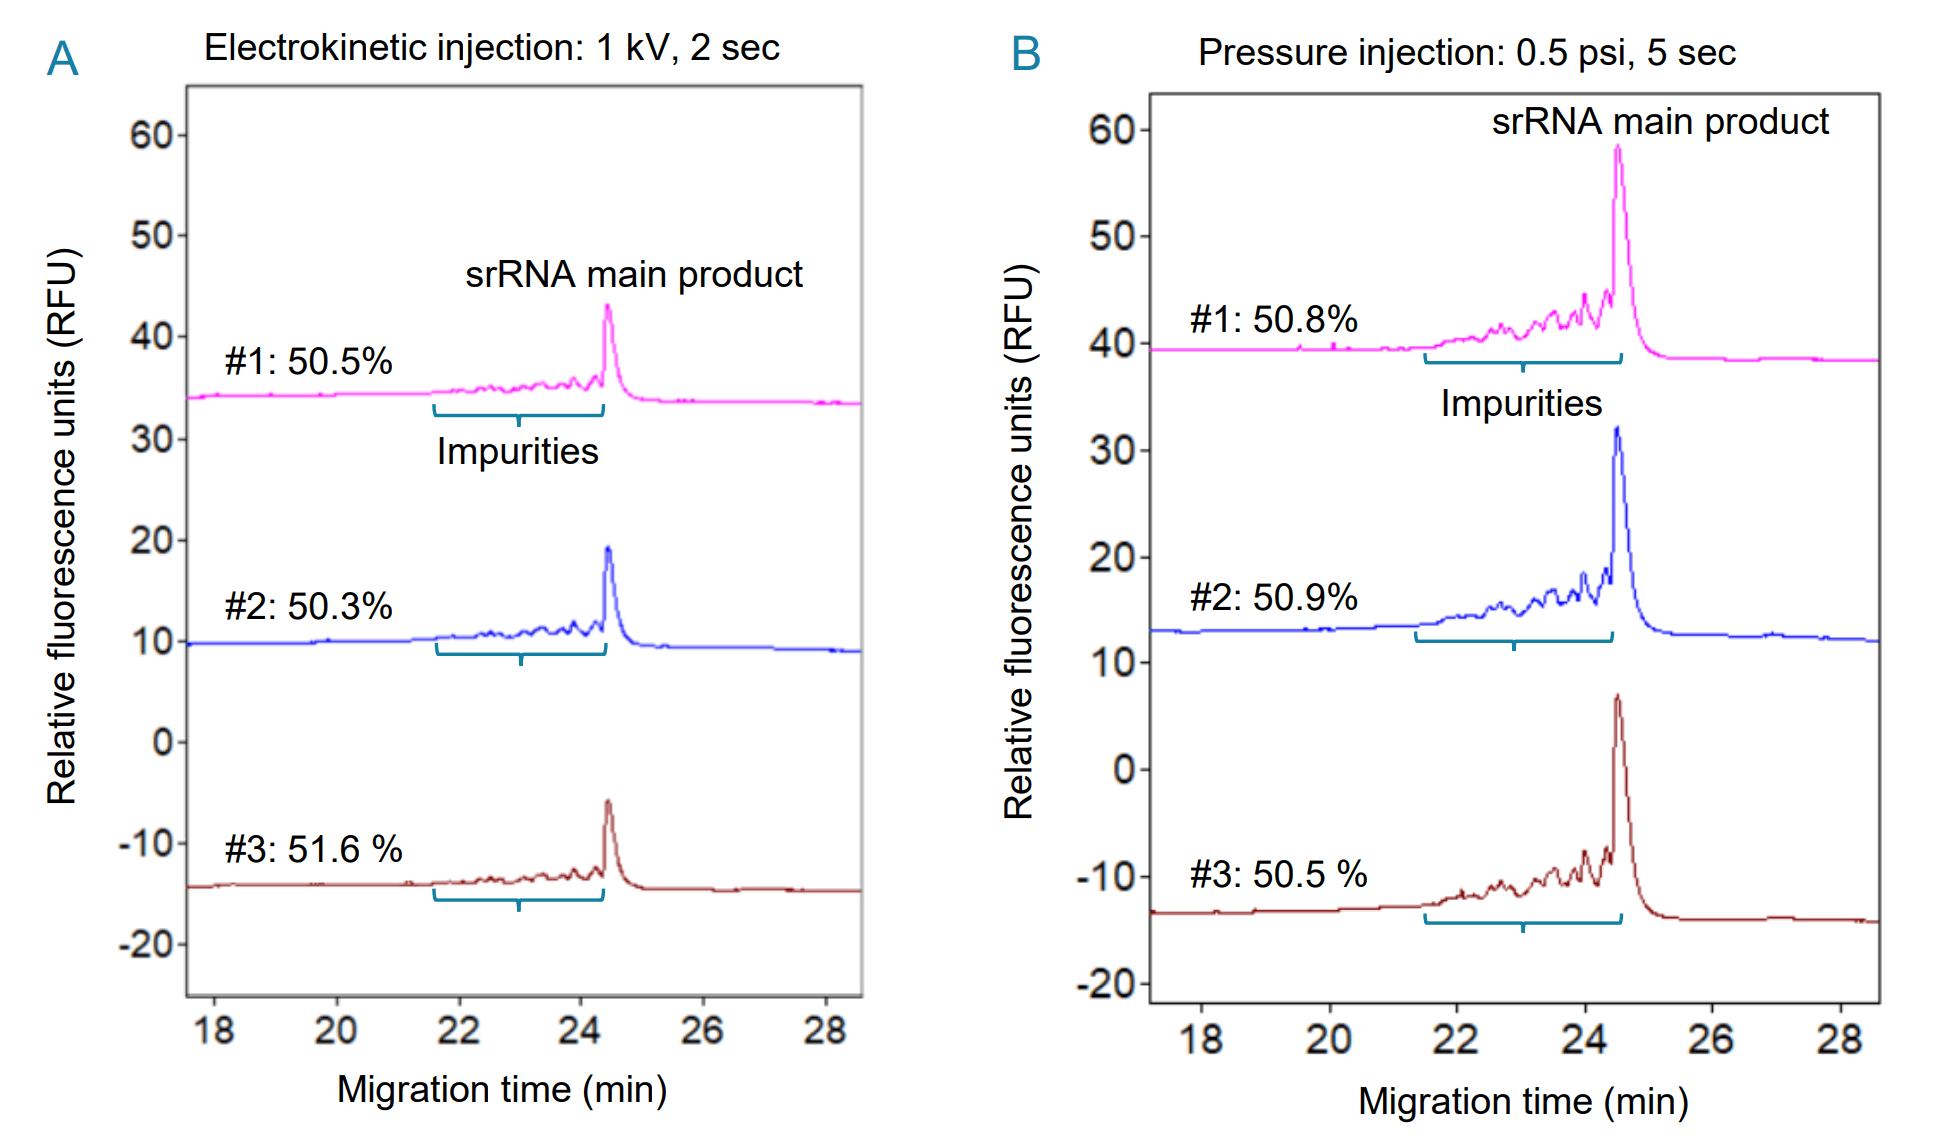
Table 2: Summary of repeatability results obtained with 3 injections of the same srRNA sample by electrokinetic injection (EKI) or pressure injection (PI). Migration time (Mt) is listed in minutes (min). CPA% and %RSD are listed in percentage (%).
Conclusions
- A new CGE-LIF method was developed for the purity analysis of a 16 kb srRNA on the PA 800 Plus system, offering new tools to address challenges in analyzing large-sized RNA vaccines and therapeutics
- An optimized gel formulation suitable for analysis of a 16 kb srRNA was developed by a simple modification of a kit-based gel, enabling consistent assessment of srRNA quality
- Similar results were obtained with electrokinetic and pressure injections, providing flexibility in srRNA analysis
- High assay repeatability was demonstrated with RSDs in migration time and CPA% of <1.5% for the main srRNA product in multiple injections
References
- Blakney AK et al. An update on self-amplifying mRNA vaccine development. Vaccines. 2021 9(2):97.
- Aliahmad, et al. Next generation self-replicating RNA vectors for vaccines and immunotherapies. Cancer Gene Therapy. 2023 30:785-793.
- Myatt DP et al. Biophysical characterization of the structure of a SARS-CoV-2 self-amplifying RNA (saRNA) vaccine. Biol Methods Protoc. 2023 8(1):bpad001.
- Luo J et el. Accurate analysis of double stranded DNA over an extended size range. 2019 SCIEX Technical Note. RUO-MKT-02-9967-A.
- Shen X et al. Size analysis of residual host cell DNA in cell culture-produced vaccines by capillary gel electrophoresis. 2013 Biologicals 41:201-208.