Approach for routine detection and quantitation of host cell proteins in NIST mAb using Zeno SWATH DIA
Remco van Soest1 and Patrick Pribil2
1SCIEX USA; 2SCIEX Canada
Abstract
This technical note demonstrates a data-independent acquisition (DIA) MS approach that allows for the identification and relative quantitation of host cell proteins (HCPs) in a monoclonal antibody (mAb) sample. Using a 20-minute analytical flow LC-MS method, 172 HCPs were identified and quantified with a coefficient of variation (CV) ≤ 20% in NIST mAb, a humanized IgG1κ antibody standard expressed in mouse cells. The number of quantifiable HCPs increased to 269 using a more sensitive 45-minute nanoflow method (Table 1). This DIA-based approach can be used to check for the presence of HCPs, including low level and new HCPs, in antibody preparations for optimizing batch antibody purification, which is critical for biotherapeutic efficacy and better treatment outcomes.
Table 1: Host cell protein groups identified and quantified in NIST mAb.
Key features of the identification and relative quantitation of host cell proteins in NIST mAb using Zeno SWATH DIA
- Using a 45-minute nanoflow LC gradient, 399 HCPs were identified (269 quantified with CVs ≤ 20%)
- 172 HCPs were identified and quantified with CVs ≤ 20% in NIST mAb using a 20-minute analytical flow gradient and Zeno SWATH DIA
- HCPs reported at levels as low as 0.012 ppm in published literature were detected and quantified with a CV ≤ 20%
- Zeno SWATH DIA data allows for both identification and sensitive quantification of HCPs
- Fast, easy library-free processing of DIA data using DIA-NN software, giving both qualitative and quantitative results
Introduction
Since 1985, almost 200 mAbs have been approved to treat various diseases such as cancers, autoimmune diseases, and inflammatory conditions.1 Although mAb products are extensively purified in the manufacturing process, they are typically generated using mouse or hamster cell lines and contain contaminating proteins from the host cell line. It is critical to characterize HCPs during purification and in the final product and screen for possible adverse effects during treatment for patient safety. For example, HCPs can cause immunogenic reactions or affect the mAb stability.2 While an enzyme-linked immunosorbent assay (ELISA) is the most commonly used method to measure HCPs, it only reports the total amount of HCPs, giving no information on which proteins are detected and their individual concentrations. In addition, ELISA tests only detect the proteins they are designed for, increasing the risk of relying on ELISAs only for process optimization and ensuring product quality. Conversely, mass spectrometry (MS) can identify HCPs without bias and allows for quantitation of the individual HCPs detected. This technical note demonstrates the comprehensive identification and quantitation of HCPs using Zeno SWATH DIA on the ZenoTOF 7600 system.
Methods
Samples and reagents: NIST mAb standard antibody (lot 14HB-D-002) was acquired from the National Institute of Standards and Technology. The UPS2 Proteomics Dynamic Range Standard, consisting of 48 human proteins spanning 5 orders of dynamic range, was purchased from Sigma. Recombinant trypsin and dithiothreitol were purchased from Millipore Sigma.
Sample preparation: 2 mg of the NIST mAb was digested following a 2-hour native digestion protocol as described in the literature.2 For the analytical flow experiment, one vial of UPS2, 50 pmol to 0.5 fmol per protein, was added to the mAb sample. After digestion and removal of the mAb, the protein concentration (expressed as the original mAb concentration) was 4 µg/µL. For nanoflow LC-MS analysis, the sample was diluted further with 0.1% formic acid in water to 1 µg/µL.
Nanoflow chromatography: The samples were analyzed using a Waters ACQUITY M-class system in trap and elute nanoflow LC mode. A Waters nanoEase M/Z Symmetry C18 100 Å, 5 µm 180 µm x 20 mm trap column was used in combination with an ACQUITY HSS T3 1.8 µm 100 Å 75 µm x 25 cm nanoLC column. 10 µL of the diluted 1 µg/uL sample (10 µg on column) was loaded on the trap from a 20 µL loop using 4 minutes for loading at 10 µL/min with 0.1% formic acid in water. A 45-minute gradient at 300 nL/min from 1-33%B was run for the separation, using 0.1% formic acid in water as mobile phase A and 0.1% formic acid in acetonitrile as mobile phase B. The column and trap were washed at 80% B for 5 minutes and re-equilibrated at 1% B for 25 minutes. The column temperature was maintained at 50°C. Five replicate injections were made.
Analytical chromatography: The samples were analyzed using an ExionLC AD system. A Waters ACQUITY HSS T3 1.8 µm 100 Å, 2.1 mm x 100 mm column was used. 50 µL of the 4 µg/µL sample was injected (200 µg on column). A 20-minute gradient at 200 µl/min from 5-35%B was run for the separation, using 0.1% formic acid in water as mobile phase A and 0.1% formic acid in acetonitrile as mobile phase B. The column was washed at 80% B for 5 minutes and re-equilibrated at 5% B for 6 minutes. The column temperature was maintained at 50°C. Five replicate injections were made.
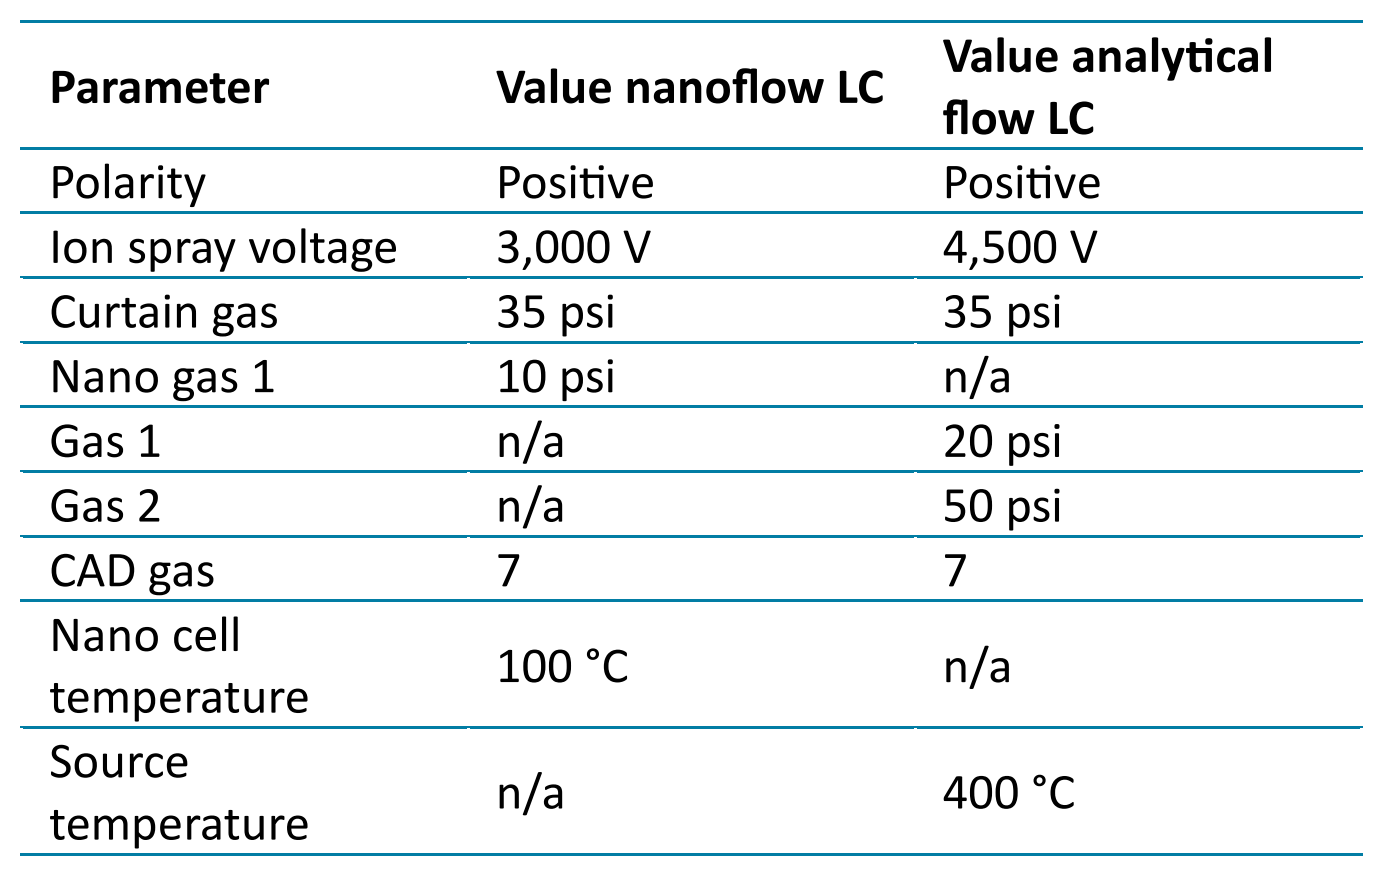
Table 2: OptiFlow Turbo V ion source parameters
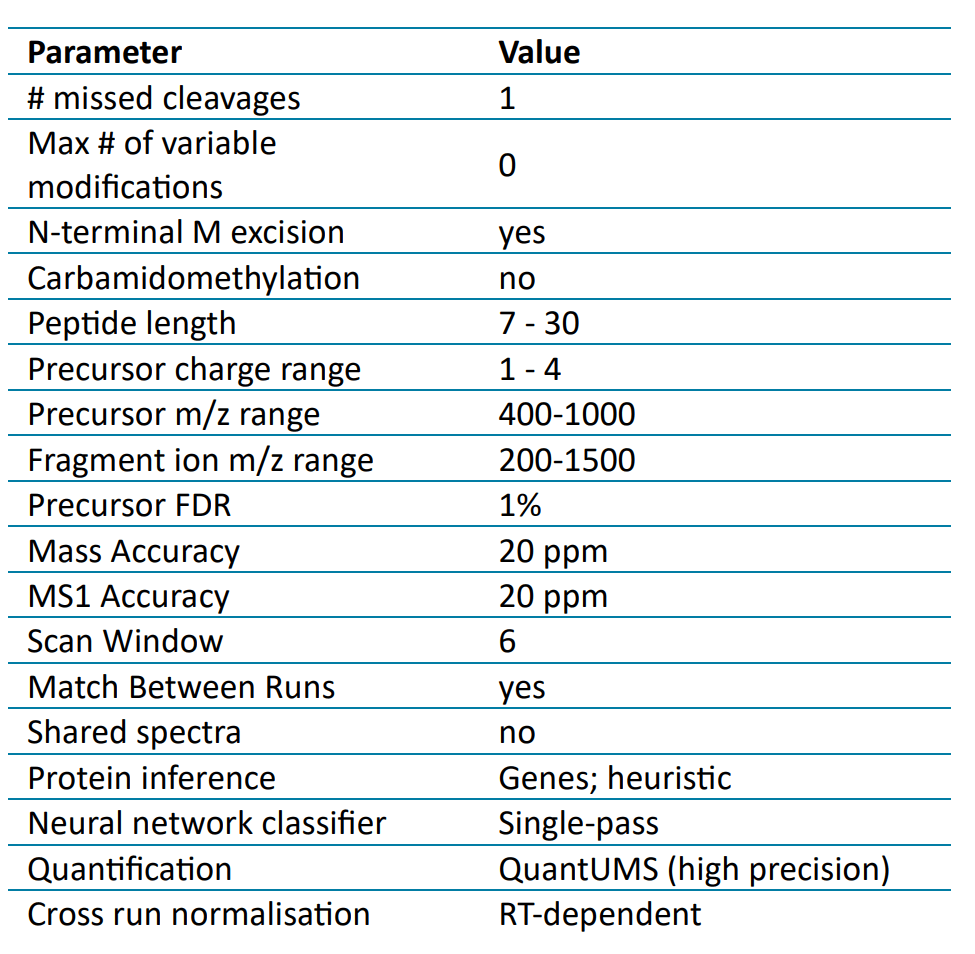
Table 3: MS method parameters
Mass spectrometry: The ZenoTOF 7600 system was used with an OptiFlow Turbo V source in either nanoflow or analytical flow mode. SCIEX OS 3.3.1 software was used for instrument control and data acquisition. Source parameters are listed in Table 2. Zeno SWATH DIA data, unless otherwise specified, was acquired using the parameters listed in Table 3. Scan time was 1.6 s for nanoflow-LC-MS and 1.3 s for analytical flow LC-MS, ensuring a minimum of 6 points across the chromatographic peaks.
Data processing: Data was processed using DIA-NN 1.9 software. 3,4 Library-free searches were performed on 5 replicates using a UniProt-reviewed mouse protein database to which the UPS2 human spike-in proteins were added. Search parameters used, unless otherwise specified, are listed in Table 4. Proteins were filtered at a Global Protein Group Q value of 0.01. The Analytics module of SCIEX OS software version 3.3.1 was used for the quantitation of HCPs as well.
Table 4: DIA-NN search parameters
Identification of HCPs in NIST mAb
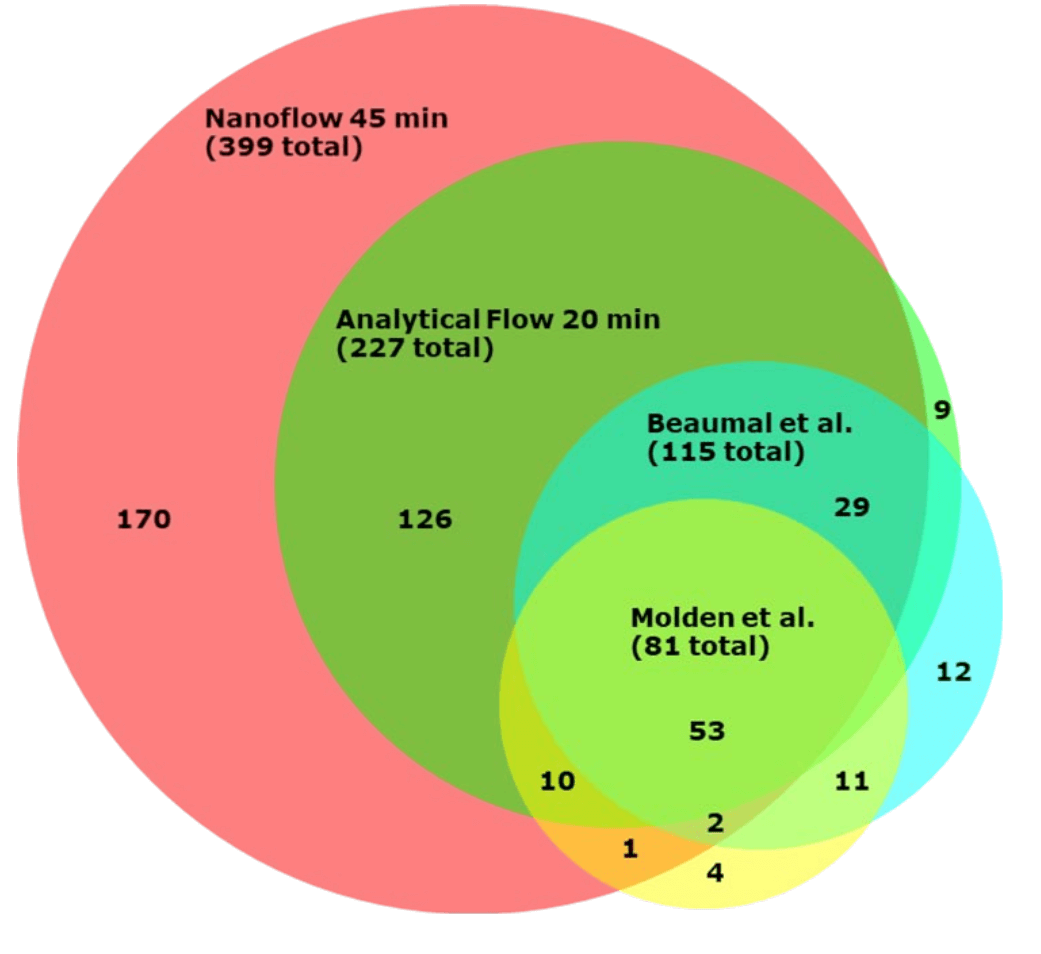
With the nanoflow trap and elute method, injecting the equivalent of 10 µg NIST mAb digest, a total of 399 mouse proteins were identified, 361 of which were identified in all 5 replicate injections.
Although nanoflow LC typically identifies the largest number of HCPs, a shorter analytical flow method is preferable for more routine testing or process development purposes. Using a 20-minute gradient, 209 HCPs were identified in all 5 replicates.
Figure 1 compares the overlap of HCPs identified between our nanoflow and analytical flow methods and two data sets reported in the literature. Almost all HCPs identified using the analytical flow method were also identified with nanoflow. There was significant overlap with HCPs reported in the literature.6,7 An even higher number of HCPs, 590 at 1% FDR, was reported recently by Feng Yang et al.5 This data was, however, acquired using a much longer (172 min) nanoflow gradient method and utilized a DDA approach, which is less suitable for quantitation than DIA approaches.
Figure 1: Proportional Venn diagram showing the overlap of HCPs identified using the nanoflow and analytical flow methods and two data sets reported in the literature.6,7,8 Note that there was an additional overlap of 8 HCPs between the nanoflow method and the data reported by Beaumal et al., not shown in this Venn diagram.
Quantitation of identified HCPs using DIA-NN
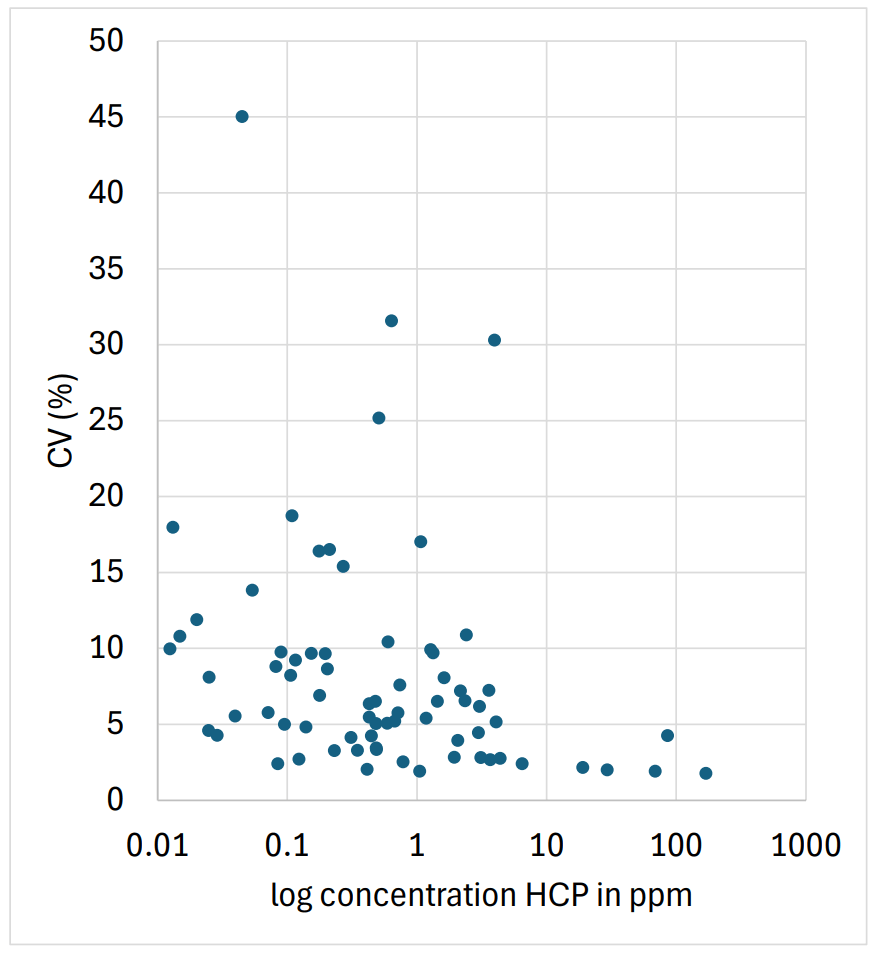
Table 1 shows that many identified HCPs were quantifiable with CVs ≤ 20%. Figure 2 shows the CVs of HCPs measured with analytical flow as a function of their concentration in ppm in the NIST standard antibody as reported in the literature.7 CVs for the HCPs reported to be at 5 ppm or higher was better than 5%, while even at concentrations as low as 0.01 ppm, most HCPs could be quantified with CVs below 20%.
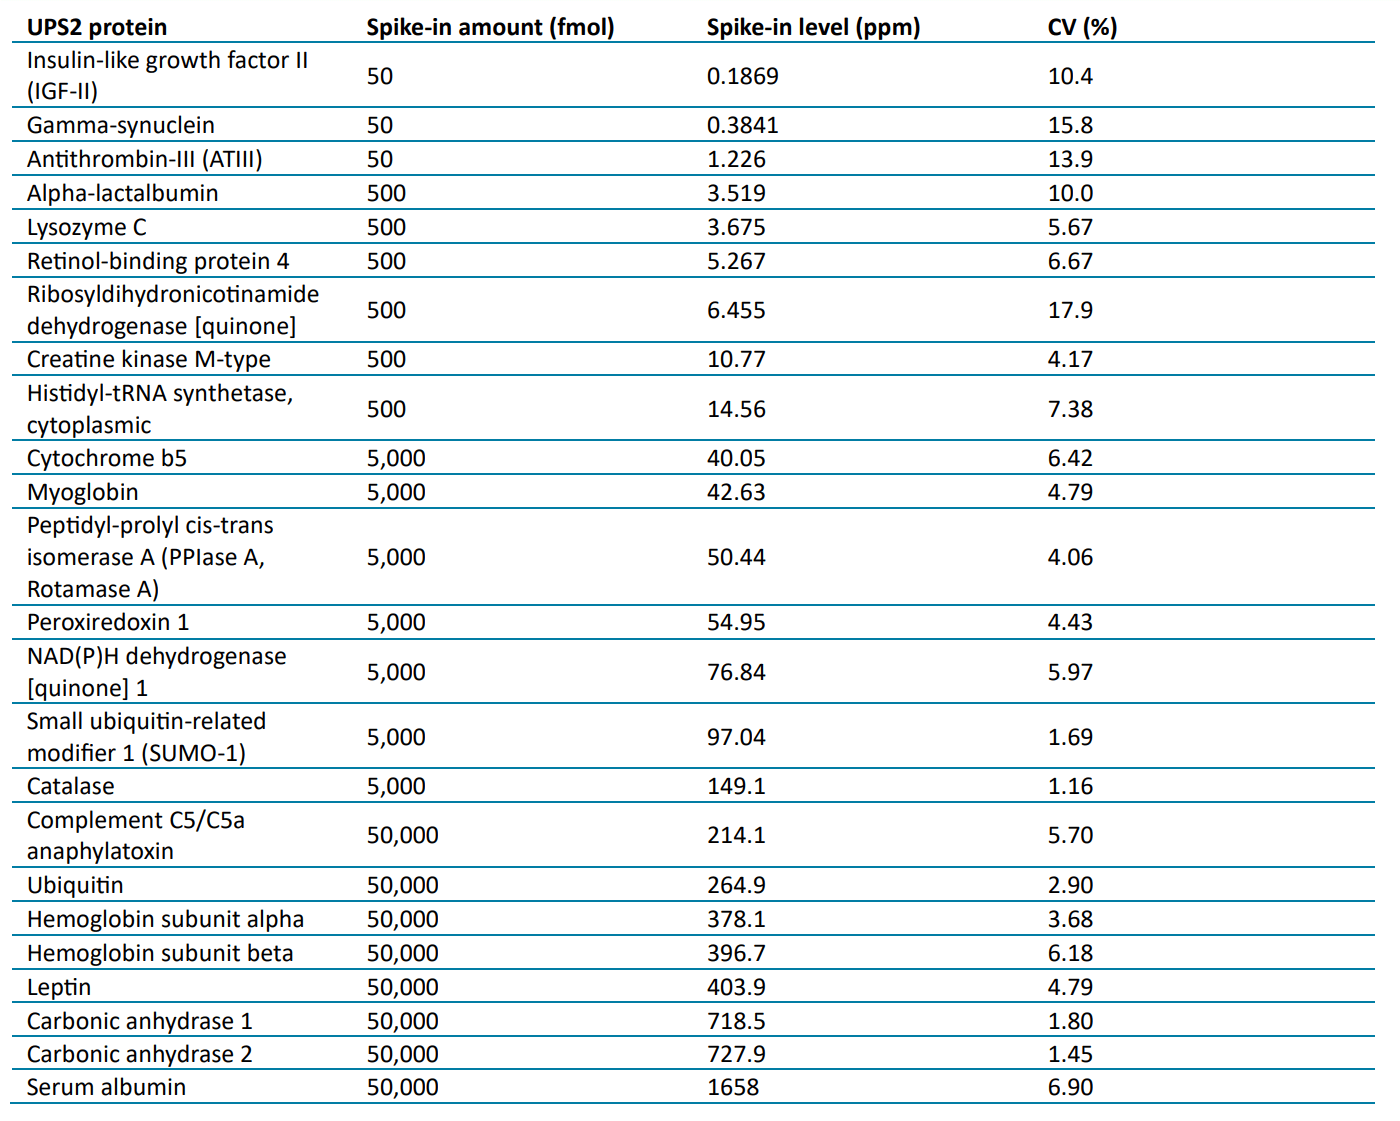
Table 5 lists the USP2 proteins spiked into NIST mAb identified in all five replicates using the analytical flow method. All the highest, 50,000 fmol, spike-in level proteins were identified, while most of the proteins at the 5,000 fmol and 500 fmol levels and three of the proteins at the 50 fmol level were identified. All identified proteins were quantified using the DIA-NN software with CVs ≤ 20%. The relative amounts of these identified proteins were from 0.19 to 1,658 ppm, covering 4 orders of magnitude.
Figure 2: %CV distribution of quantified HCPs as a function of the ppm concentration reported in the literature.7
Quantitation of HCPs using SCIEX OS software
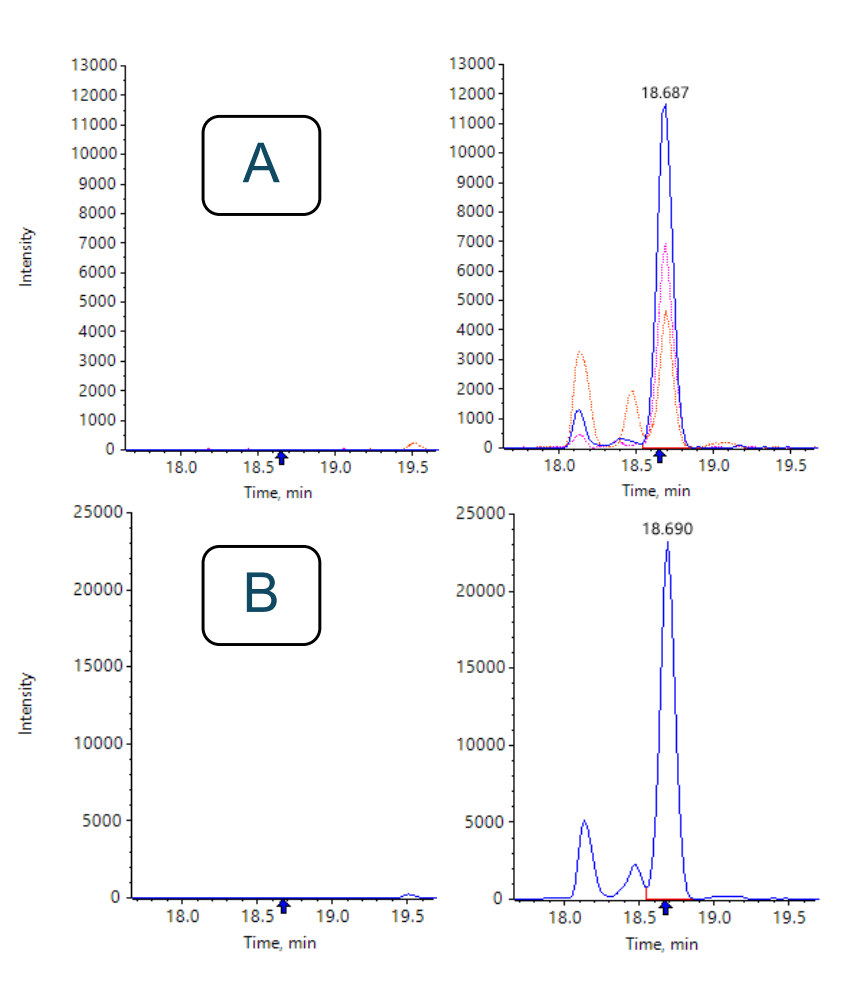
Once specific HCPs have been identified using DIA-NN, quantitation using one or several peptides of any HCP can be performed with enhanced speed and precision from the same DIA data using SCIEX OS software. SCIEX OS software allows for quantitation using a single peptide fragment, or by summing multiple fragments. Figure 3 shows the XICs of three fragments and their sum for the most intense peptide, GLIDGFPR, of UMP-CMP kinase, an HCP with a literature-reported concentration of 0.4 ppm.7 The CV of the summed area for this peptide was 10.6%.
Figure 3: Example of quantitation of the HCP UMP-CMP kinase using SCIEX OS. Figure A shows the overlaid top 3 XICs, fragment ions y6, y5 and y4, of the peptide GLIDGFPR in a blank digest (left) and NIST mAb digest (right). Figure B shows the summed XIC in the blank (left) and NIST mAb digest (right). The CV of the summed area for this peptide was 10.6%.
Table 5: UPS2 spiked-in proteins identified using the analytical flow LC method with Zeno SWATH DIA.
Conclusion
- Zeno SWATH DIA, using the ZenoTOF 7600 system, is a robust and sensitive method for routinely identifying and quantifying host cell proteins (HCPs). Using a 20- minute analytical flow gradient, 172 HCPs were identified and quantified in a NIST mAb standard, demonstrating a high degree of speed and precision
- Using a 45-minute nanoflow gradient and Zeno SWATH DIA, 399 HCPs were identified, with 269 of these quantifiable with a CV ≤ 20% across 5 replicate injections
- The HCPs identified and quantified in this work using both analytical flow and nanoflow methods show excellent correlation with previous results published in the literature, highlighting the effectiveness of Zeno SWATH DIA as a tool for monitoring the production of biotherapeutics
- Quantitation using Zeno SWATH DIA gives excellent precision at the lowest HCP concentrations
References
- The Antibody Society.
https://www.antibodysociety.org/antibody-therapeuticsproduct-data/
- Regina Kufer, Markus Haindl, Harald Wegele and Stefanie Wohlrab (2019). Evaluation of Peptide Fractionation and Native Digestion as Two Novel Sample Preparation Workflows to Improve HCP Characterization by LC−MS/MS. Anal. Chem. 2019, 91, 9716−9723.
https://pubs.acs.org/doi/10.1021/acs.analchem.9b01259
- Demichev et al., Nature Methods, 2020,
https://www.nature.com/articles/s41592-019-0638-x
- Kistner et al. (2023), biorxiv,
https://doi.org/10.1101/2023.06.20.545604
- Feng Yang et al. (2022). Versatile LC–MS-Based Workflow with Robust 0.1 ppm Sensitivity for Identifying Residual HCPs in Biotherapeutic Products. Anal. Chem. 2022 94 (2), 723-731. https://pubs.acs.org/doi/abs/10.1021/acs.analchem.1c03 095
- Rosalyn Molden et al. (2021). Host cell protein profiling of commercial therapeutic protein drugs as a benchmark for monoclonal antibody-based therapeutic protein development. mAbs, 13(1). https://www.tandfonline.com/doi/full/10.1080/19420862.2 021.1955811
- Corentin Beaumal, Alain Beck, Oscar Hernandez-Alba and Christine Carapito. (2023). Advanced mass spectrometry workflows for accurate quantification of trace-level host cell proteins in drug products: Benefits of FAIMS separation and gas-phase fractionation DIA. Proteomics, 23, e2300172.
https://doi.org/10.1002/pmic.202300172
- T Hulsen. (2022). DeepVenn -- a web application for the creation of area-proportional Venn diagrams using the deep learning framework Tensorflow.js. arXiv preprint arXiv:2210.04597. https://arxiv.org/abs/2210.04597
 Click to enlarge
 Click to enlarge
 Click to enlarge
 Click to enlarge
 Click to enlarge
 Click to enlarge
 Click to enlarge
 Click to enlarge