Characterization of adeno-associated virus (AAV) capsid proteins using microflow LC-MS/MS
Lingsheng Chen2, Tingting Li3, Tie Gao2, Ji Luo2, Lihai Guo2, Xiang Li1, Hongxu Chen2
1National Institutes for Food and Drug Control, The Key Laboratory of Biotechnology Product Test Method and Its Standardization of The Ministry of Health, Beijing, China; 2SCIEX, China; 3SCIEX, USA
Abstract
This technical note demonstrates a sensitive, robust, and high throughput approach for characterizing AAV2 capsid protein utilizing the microflow liquid chromatography-tandem mass spectrometry (LC-MS/MS). Near 100% sequence coverage of the low-concentration AAV2 capsid protein (8×10¹¹ GC/mL) was achieved and more than 30 post-translational modification (PTM) sites were identified, including deamidation, oxidation, and acetylation. This method offers an analytically rigorous solution for sensitive and high-quality characterization of AAVs and other biological products with low abundance.
Key features of AAV characterization using the microflow LC coupled with SCIEX ZenoTOF 7600 system
- Ultra-high sensitivity characterization: The combination of microLC and the ZenoTOF 7600 system results in nearly 100% amino acid sequence coverage analysis of low-concentration AAV capsid proteins and confident identification and quantitation of low-abundance PTMs
- Powerful EAD for differentiation of isomers: EAD fragmentation technology possesses the unique capability of differentiating amino acid isomers, offering in-depth and precise characterization
- Streamlined and easy-to-use: Automated data acquisition using SCIEX OS software and data analysis using optimized workflow templates in the Biologics Explorer software enable rapid and routine characterization of AAV capsid proteins
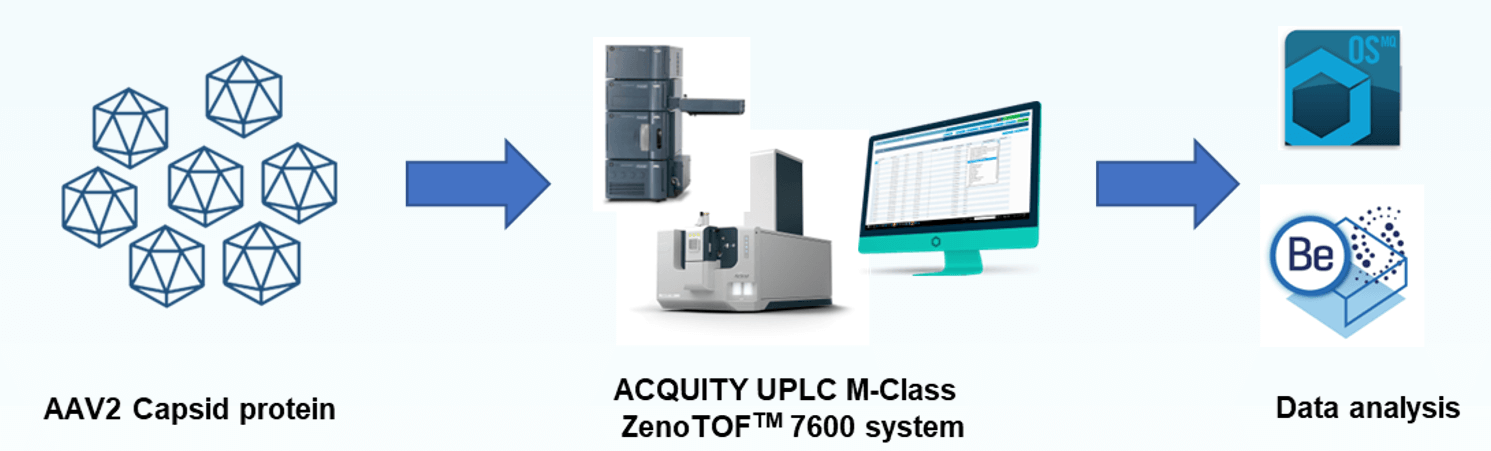
Figure 1. Workflow of characterization of AAV2 capsid proteins. The AAV2 samples were pretreated, including denaturation, reduction, and alkylation for peptide mapping analysis. The peptides were analyzed with ACQUITY UPLC M-Class (Waters) coupled with ZenoTOF 7600 system (SCIEX). Data were acquired using SCIEX OS software, version 3.0. Data analysis was performed using Biologics Explorer software, version 2.0.2 (SCIEX)
Introduction
AAV has become widely used in clinical gene therapy due to its low immunogenicity, minimal genotoxicity, persistent gene expression across various tissue types, prolonged duration of action, and ease of production.1 The AAV virus, a member of the parvovirus family, is non-enveloped and comprised of capsid proteins and single-stranded DNA of about 4.7kb in size. AAVs of different serotypes are assembled from 3 different capsid viral proteins (VP): VP1 (~80 kDa), VP2 (~65 kDa), and VP3 (~60 kDa)) in a molar ratio of approximately 1:1:10, forming an icosahedral structure.2 Besides protecting the viral genome, the capsid protein plays a crucial role in mediating receptor binding, virus escape, and transporting viral DNA to target cells. Changes in the capsid protein sequence or PTMs can affect the targeting and infectivity of viral vectors.3 Therefore, monitoring the quality attributes of AAV vectors is of great significance to ensure the effectiveness and safety of AAV drugs used in human gene therapy. Compared with therapeutic proteins, most AAV samples have low protein concentrations (0.01-0.1mg/mL), and the amount of samples available for analysis is limited, posing a significant challenge to AAV characterization analysis.4 The microflow LC/MS-MS system, known for its high-throughput, robust analytical performance, and good sensitivity, is widely used in proteomics and biological product characterization analysis.5
In this study, the microflow LC-MS/MS) technology was employed for the characterization of low-concentration AAV2 capsid proteins (8×10¹¹ GC/mL). The peptide mapping analysis, conducted using data-dependent acquisition (DDA) technology, achieved nearly 100% sequence coverage of the AAV2 capsid proteins. Simultaneously, over 30 PTM sites were identified, with their relative quantitation measured. High-quality secondary mass spectrometry data were obtained through collision-induced dissociation (CID) technology, enabling complete matching of amino acid sequences. Electron activated dissociation (EAD) technology was also applied to differentiate amino acid isomers. The microflow LC system, coupled with the ZenoTOF 7600 system, delivered not only high-throughput and robust analysis but also demonstrated superior sensitivity, providing crucial technical support for the characterization and analysis of biological product samples with low concentration.
Methods
Sample information: AAV2 samples with a physical titer of 8×10¹¹ GC/mL, equivalent to a protein concentration of 0.005 mg/mL.
Sample preparation: The Filter-Aided Sample Preparation (FASP) method was employed, where AAV2 samples were incubated with 7M guanidine hydrochloride and 20 mM dithiothreitol at 56 °C for 45 minutes. Subsequently, 50 mM of iodoacetamide (IAM) was added, and the reaction was carried out at room temperature in the dark for 30 minutes. Trypsin digestion was performed overnight at 37 °C. The reaction was terminated with a 1% formic acid solution, and the sample was ready for LC-MS/MS analysis.
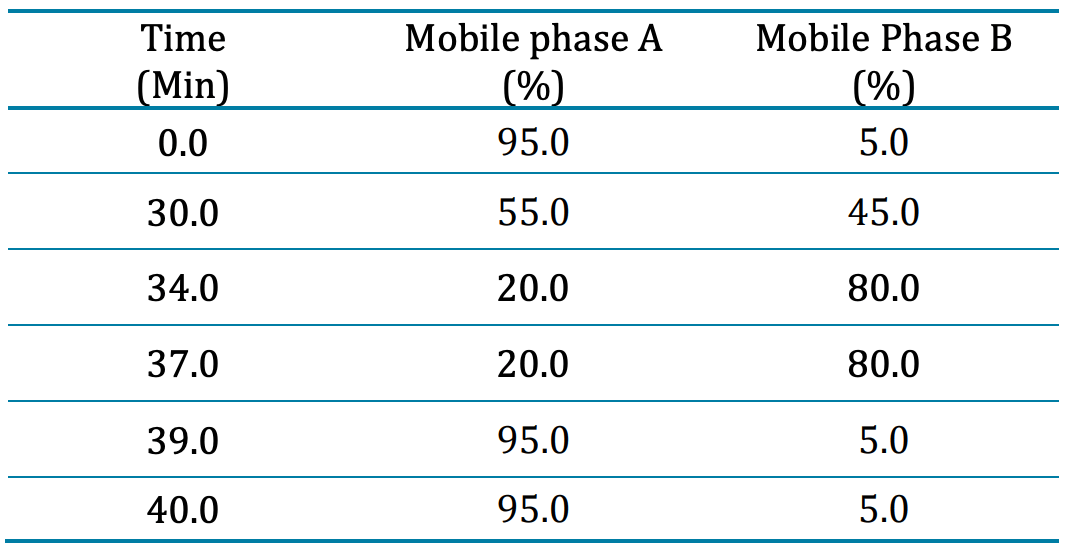
Chromatography: The Waters ACQUITY M-Class ultra-high-performance liquid chromatography (UPLC) system was used with a Kinetex XB-C18 column (0.3×150 mm, 2.6 μm, 100 AÅ , Phenomenex) and a Micro Trap C18 (0.3×10 mm, 100 AÅ , 51μm, Phenomenex) trap column. The mobile phase A consisted of 0.1% formic acid and 2% acetonitrile, while mobile phase B comprised 0.1% formic acid and 98% acetonitrile. The column temperature was set to 40 °C. The LC gradient for separation is shown in Table 1. The injection volume for intact analysis was set to 1 µL, equalling about 1 µg of protein on column.
Table 1: Chromatographic gradient for peptide mapping of AAV2 capsid proteins.
Mass spectrometry: LC-MS data was acquired by SCIEX OS software, version 3.0 using the ZenoTOF 7600 system. Peptide mapping analysis was performed using DDA mode for data acquisition. The electrospray ionization source was set in positive ion mode. The key mass spectrometry acquisition parameters are listed in Tables 2 and Table 3.
Table 2: Source and gas parameters.
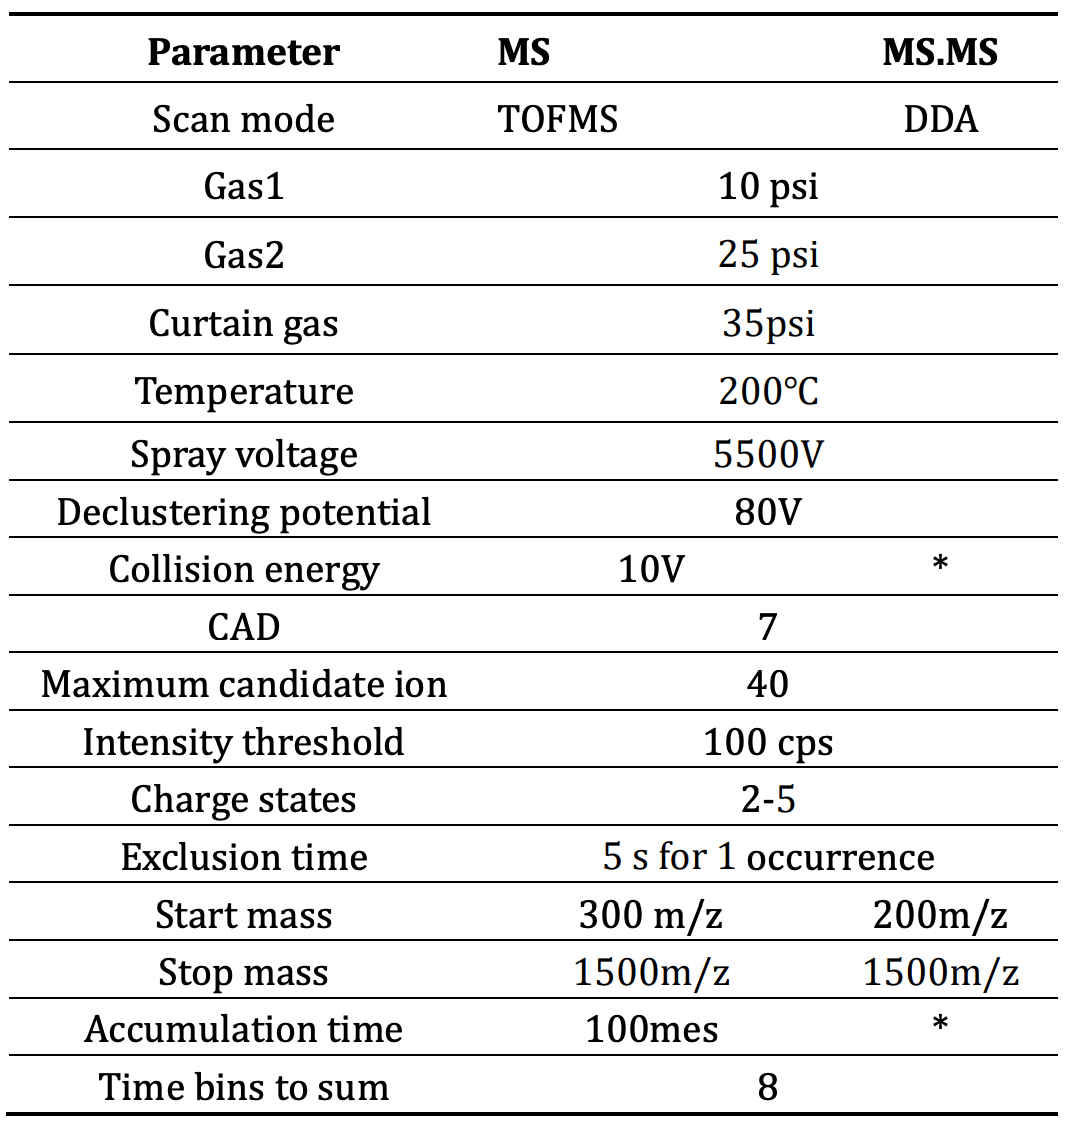
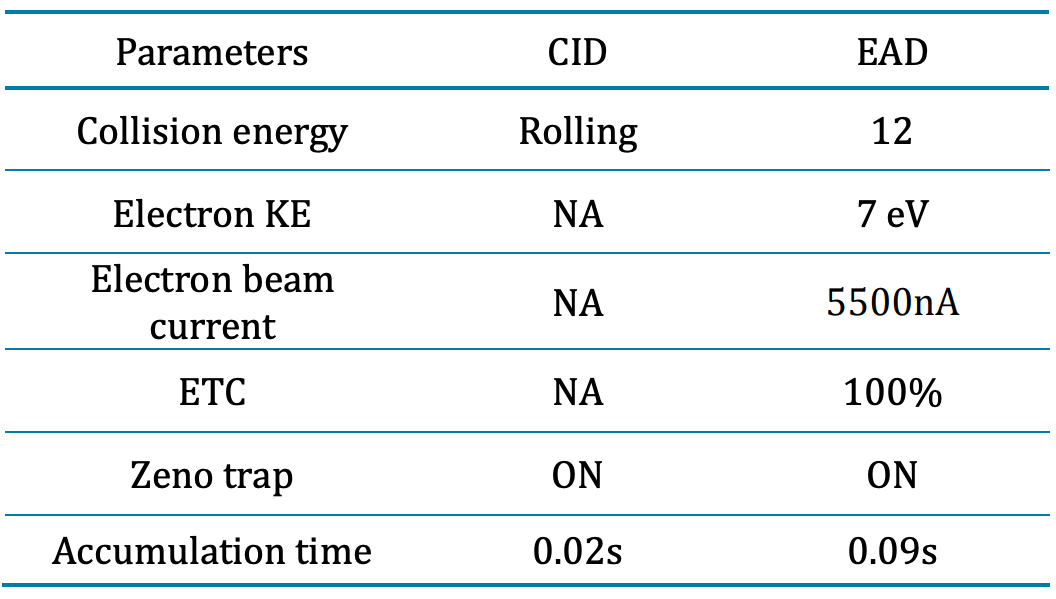
Table 3: CID and EAD mass spectrometry parameters.
Data processing: Peptide mapping was performed using Biologics Explorer software, version 2.0.2 (SCIEX) for database searching against AAV2 capsid protein sequences. MS tolerance was set at 5 ppm for precursor ions and 20 ppm for fragmentation ions. Carboxymethyl (C) was designated as a fixed modification, and deamidation (NQ), oxidation (M), acetylation (N-term), lysloss (Protein C-terminal K), Gln -> pyro-Glu (N-term Q), Phospho (STY) and Acetyl (N-term) were set as variable modifications. The relative abundance of PTMs was calculated based on the ratio of the peak area of the PTM peptide to the total peak area of the peptide containing the PTM sites.
Results and discussion
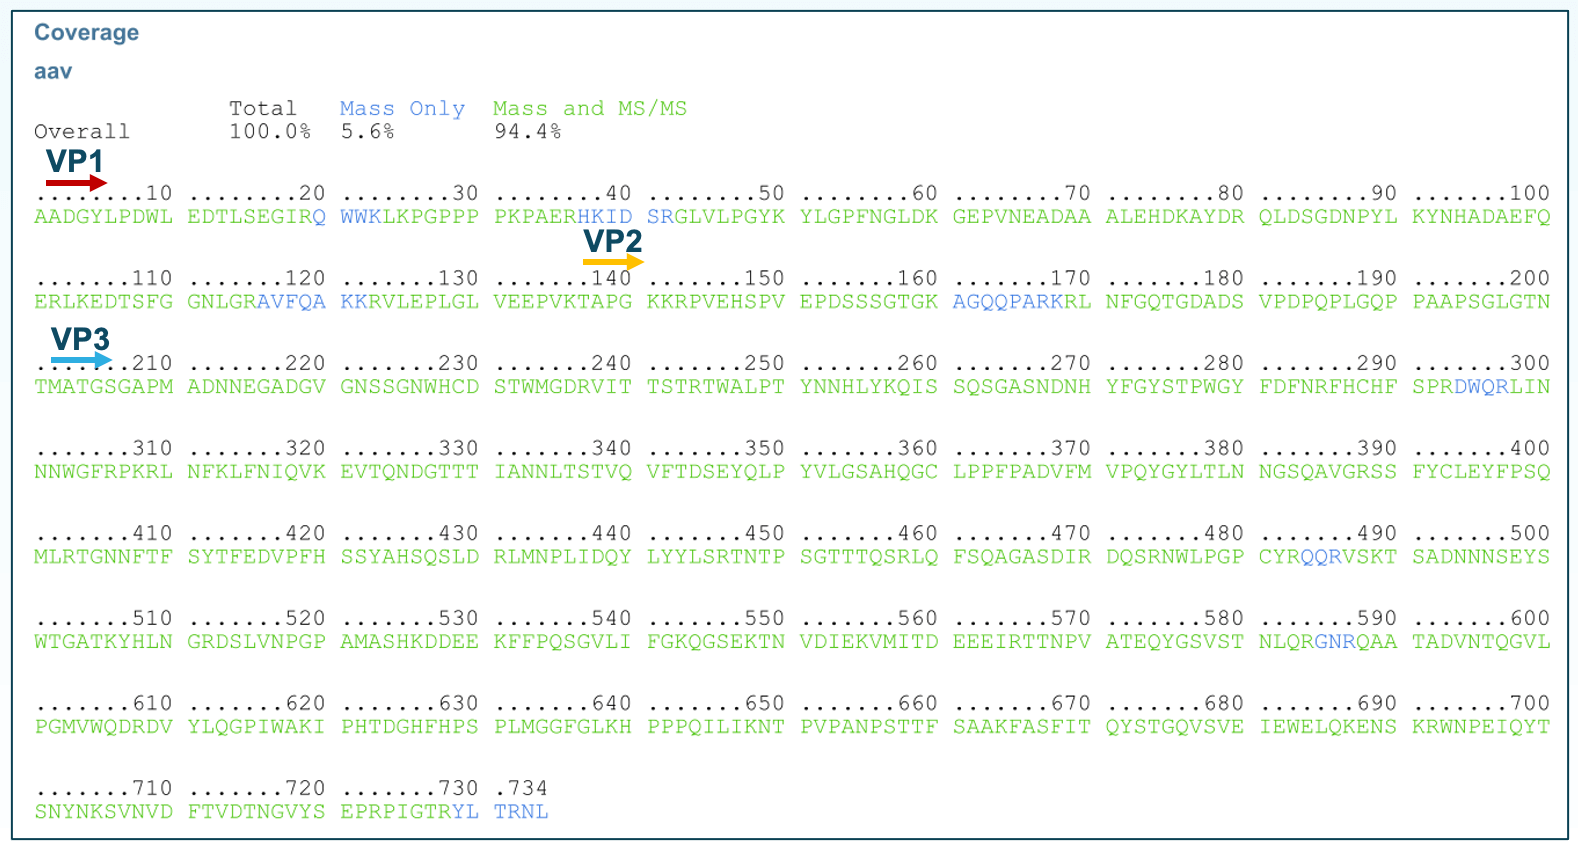
AAV2 Capsid Protein Sequence Coverage Analysis: The ZenoTOF 7600 system, equipped with the Zeno™ trap, increases the duty cycle to greater than 90%, reducing ion loss and achieving heightened MS/MS sensitivity. In combination to the microflow LC system, known for its stability, high throughput, and excellent sensitivity, the analysis of low-concentration AAV2 samples was conducted. The enhanced sensitivity resulted in high-quality MS/MS spectra. Through database search, nearly 100% sequence coverage of AAV2 capsid protein was achieved supported by 94.4% from MS/MS data and an additional 5.6% from TOF-MS data (Figure 2). Of these sequences, 95% were matched using MS/MS, while the remaining 5% were matched using MS data.
Figure 2. Sequence coverage of AAV2 VPs. Near-complete sequence coverage, with 5.6% from TOF-MS and 94.4% from MS/MS, was achieved through a single trypsin digest injection of the AAV2 sample.
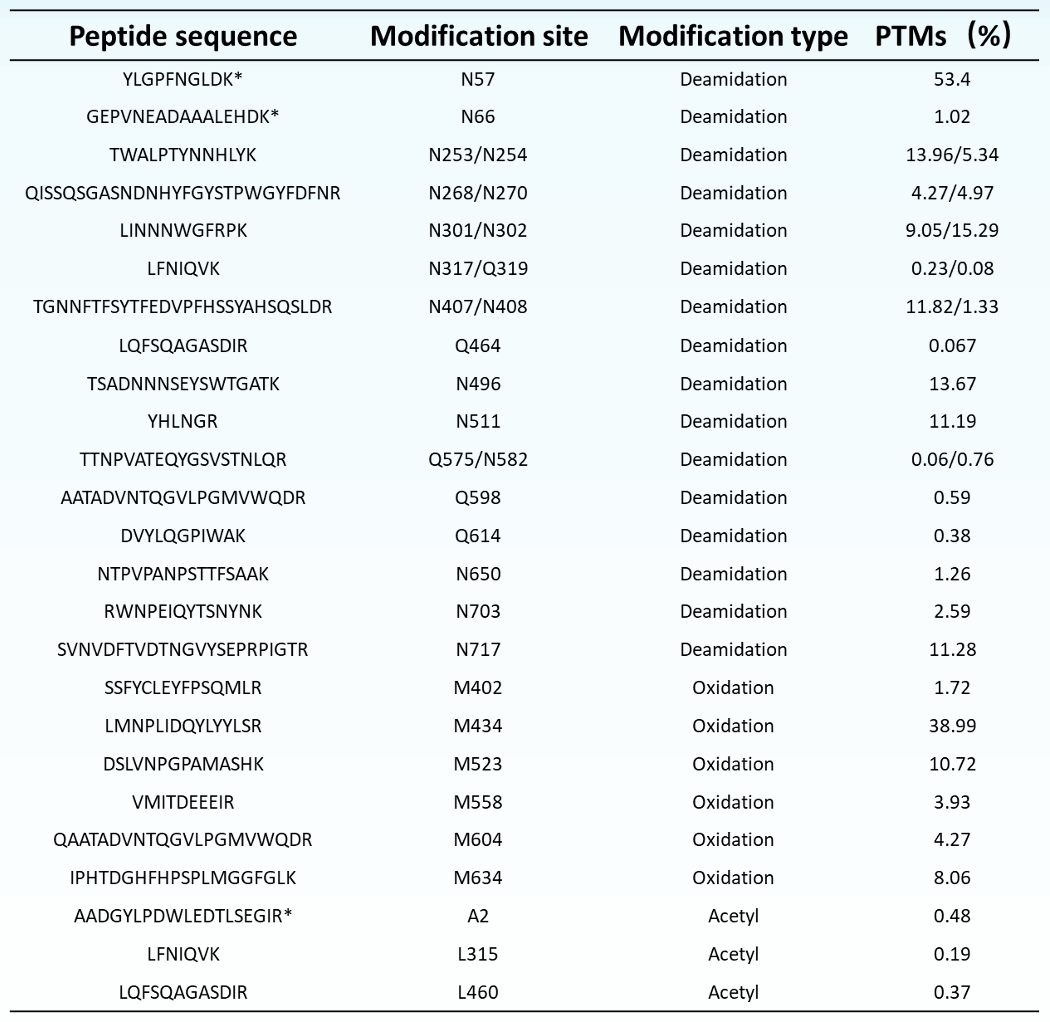
PTMs analysis of AAV2 capsid proteins: The Biologics Explorer software utilizes a pre-established analysis workflow to identify different types of post-translational modifications (PTM) through database searching. This process enables rapid and efficient identification, as well as quantitative analysis, of PTM sites. Utilizing the Biologics Explorer software for analysis, more than 30 modification sites were identified in the AAV2 viral proteins (Table 4), including deamidation, oxidation, and acetylation modifications. Of these, 11 PTMs with relative abundances less than 1% were identified, including deacetylation modifications at N317, Q319, Q464, and acetylation modifications at A2 and L315.
Table 4. List of PTMs identified in AAV2 capsid proteins.
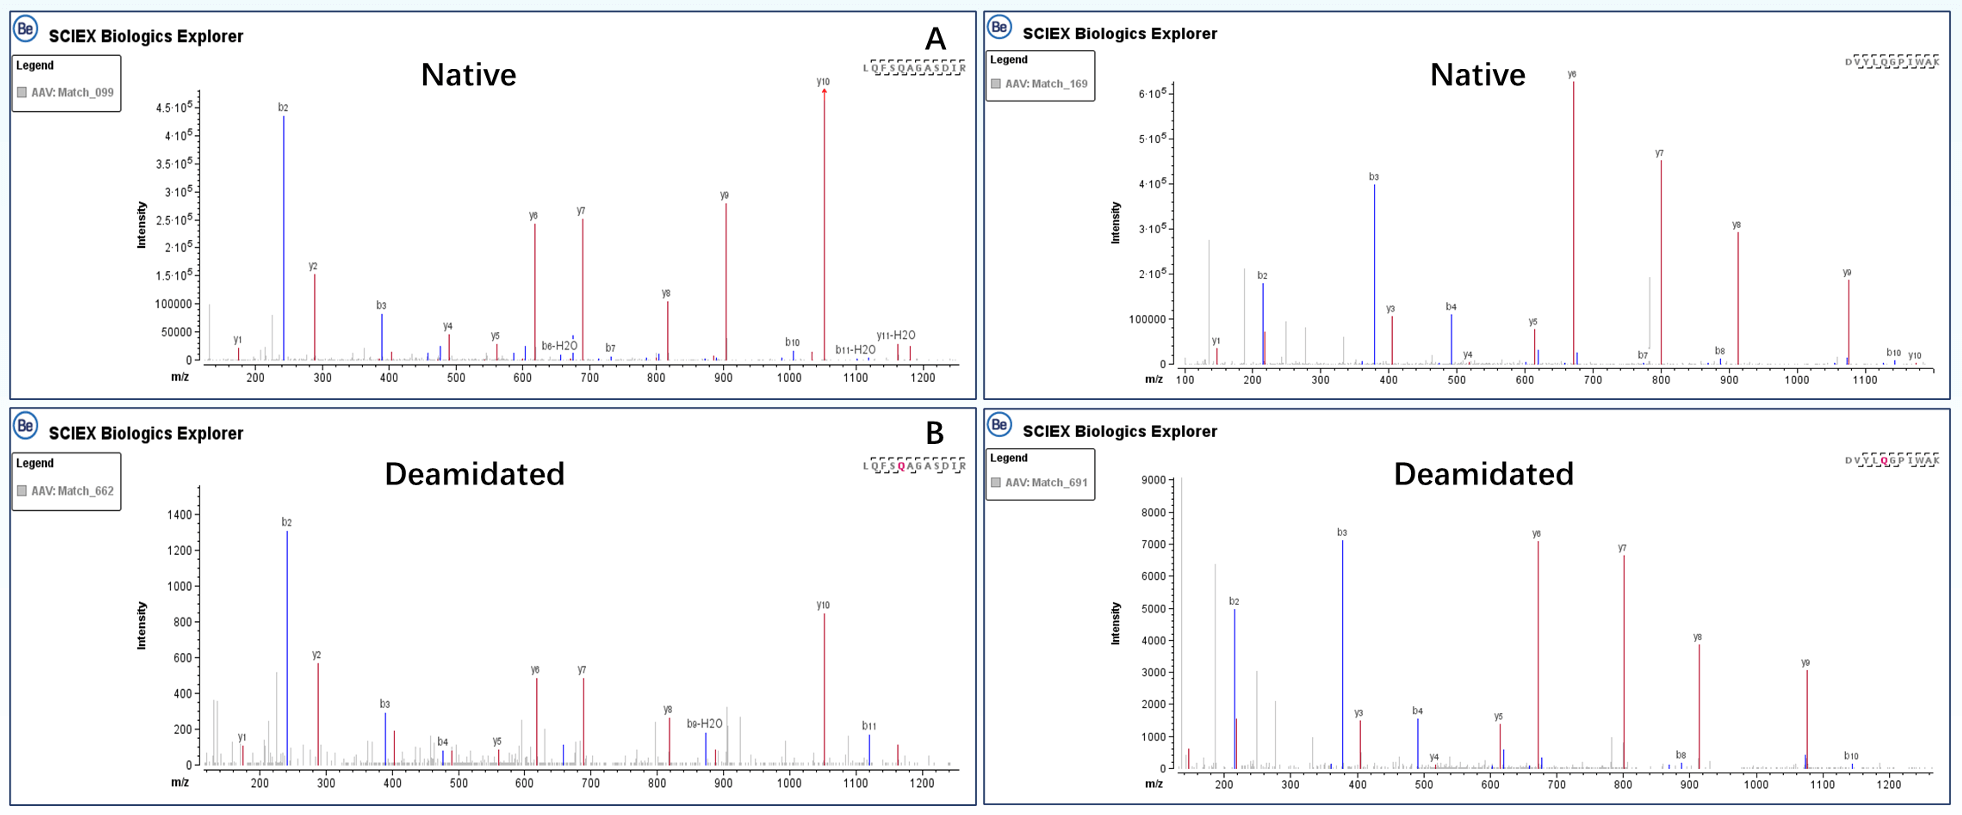
By utilizing a highly sensitive Microflow LC system and the Zeno trap technology, we not only achieved the analysis of lowabundance PTMs, but also obtained high-quality MS/MS spectra for comprehensive peptide mapping. Figure 3 displays the extracted ion chromatograms (XICs) of native and deamidated forms of peptides, LQFSQAGASDIR (Figure 3A) and DVYLQGPIWAK (Figure 3B), at positions 464 and 614, respectively. The deamidated forms of these peptides were present at relative abundances of 0.07% (LQFSQAGASDIR) and 0.38% (DVYLQGPIWAK), respectively. Figure 4 shows the MS/MS spectra of the peptides in CID mode, where the complete matching of b and y fragment ions enabled confident identification of the peptide sequences. Additionally, the deamidation modification sites of these peptides were accurately confirmed based on the m/z of y8 ions (LQFSQAGASDIR) and b5/y7 ions (DVYLQGPIWAK).
Figure 3. Extracted ion chromatograms of Native and Deamidated forms of the peptides. A. Peptide LQFSQAGASDIR; B. Peptide BDVYLQGPIWAK
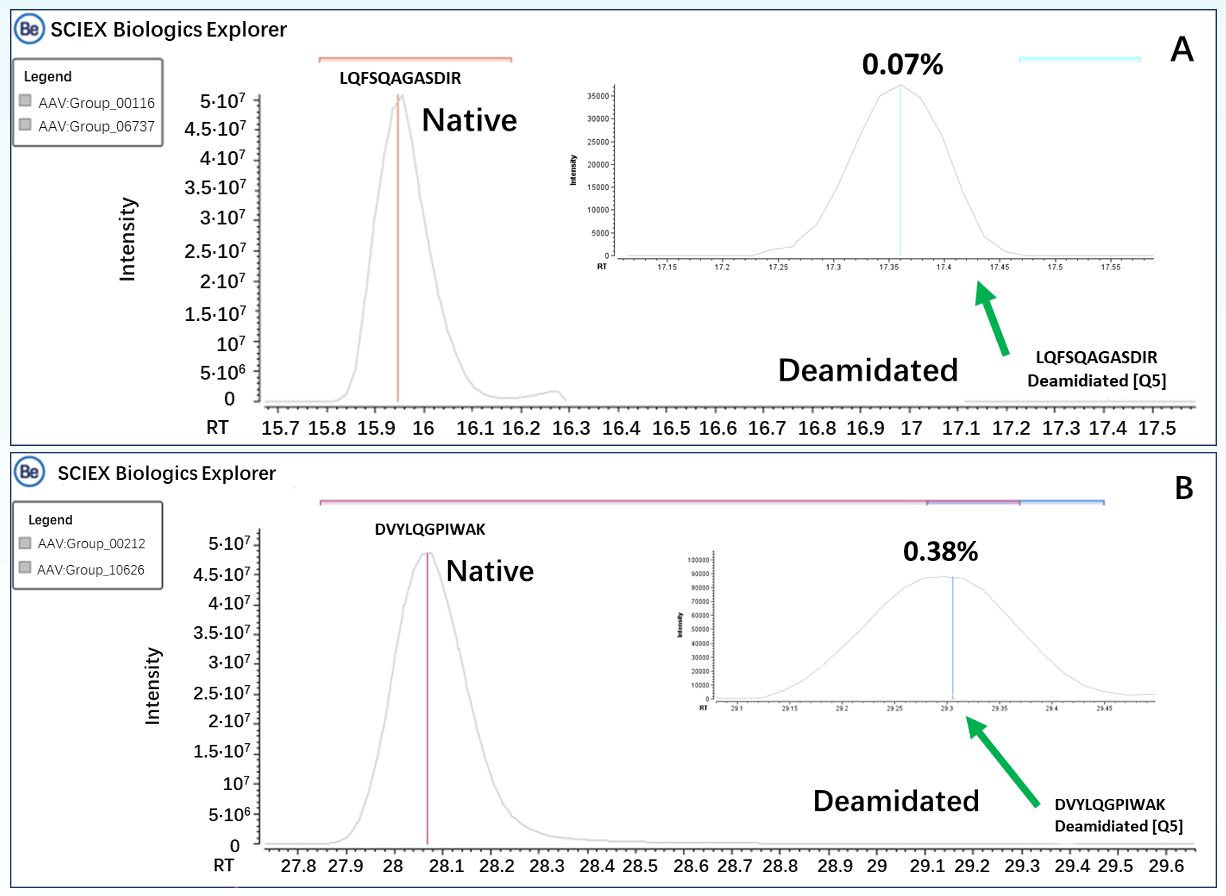
Figure 4. CID MS/MS spectra of native and deamidated species. MS/MS spectra of the peptide LQFSQAGASDIR Native (A) and Deamidated (B) forms. Secondary mass spectra of the peptide DVYLQGPIWAKB. Native (C) and Deamidated (D) forms.
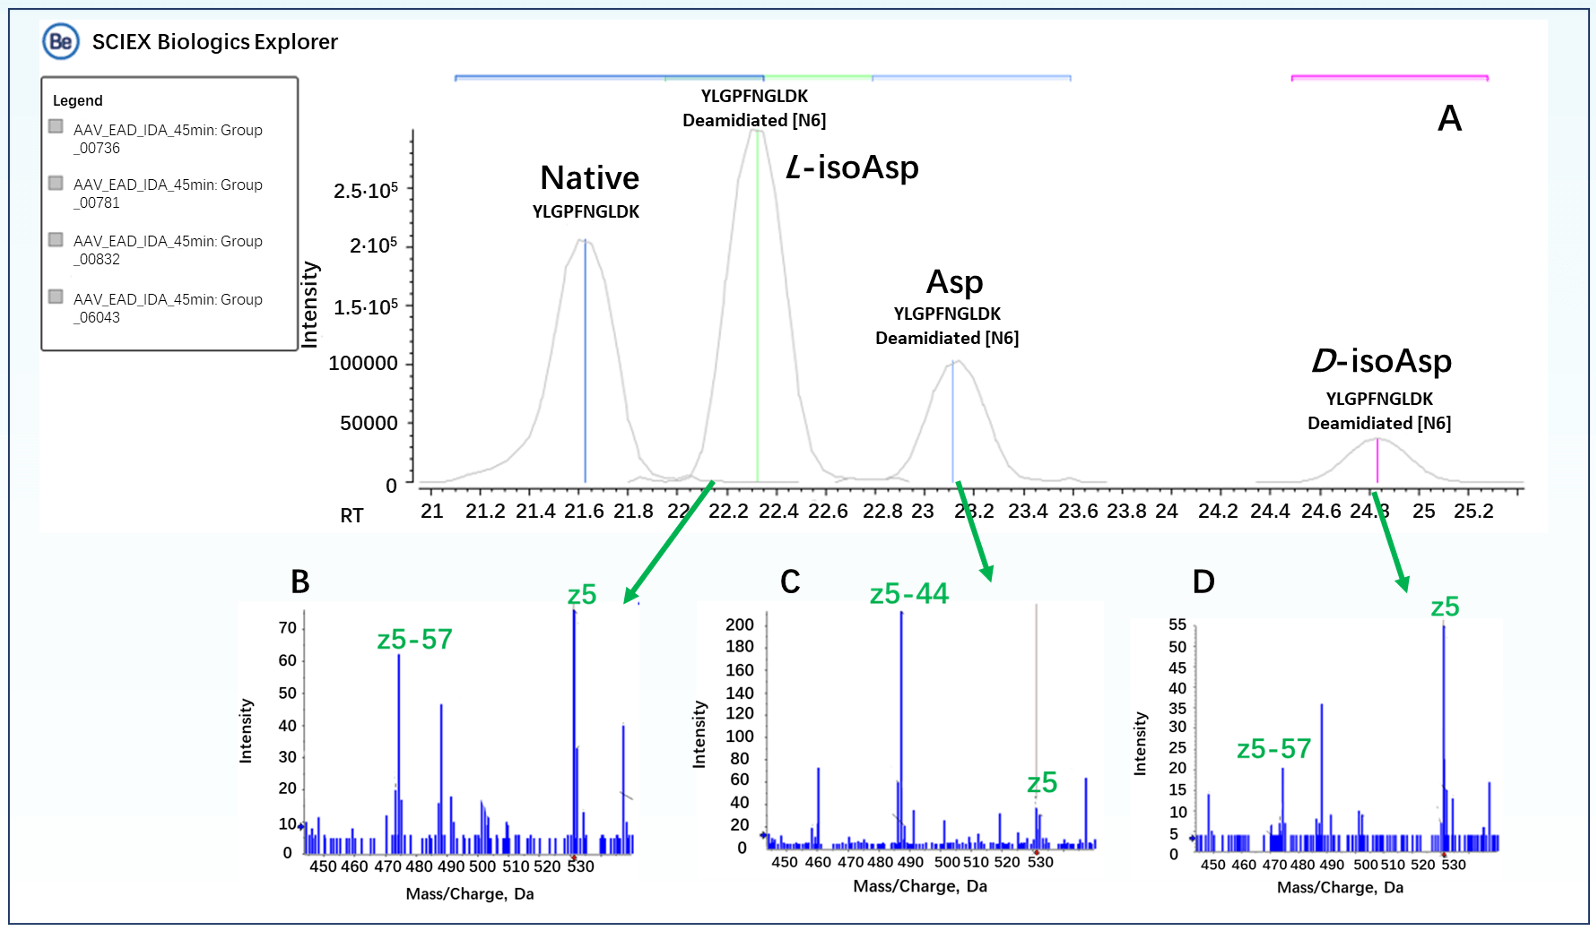
Protein deamidation involves the side-chain deamidation of asparagine residues, forming aspartic acid (Asp) or isoaspartic acid (isoAsp). Differentiating between Asp and isoAsp isomers in AAV vectors is crucial, as it can influence the assembly and transduction efficiency of the capsid protein, as well as affect its tissue tropism and interaction with the immune system.6 CID is a commonly used mass spectrometry fragmentation technique that provides amino acid sequence confirmation. However, it is challenging to distinguish between isomers such as Asp and soaps. In contrast, EAD technology generates characteristic diagnostic fragment ions, facilitating the differentiation of amino acid isomers.7 The peptide YLGPFNGLDK exists in 3 deamidation modification forms on N57, as shown in the EAD MS/MS spectra (Figure 5B, D).
Based on the m/z values of the z5-57 fragment, the peaks at retention times of 22.3 min and 24.8 min correspond to the isoAsp forms of the peptide YLGPFNGLDK. The detection of the respective signature fragment z5-44 confirmed that the peak at 23.1 min corresponded to the Asp form of the peptide (Figure 5C). According to literature reports, the relative abundance of the L-isoAsp form is higher.8, 9
Figure 5. Signature EAD fragments of 3 deamidated species of YLGPFNGLDK peptide with N57 modification. The 3 deamidated species of peptide YLGPFNGLDK in the XIC (A) were identified as the Asp or isoAsp isomer based on the detection of their respective signature fragments, for example z5 - 57 for isoAsp (B and D) and z5 - 44 for Asp6 (C).
Conclusion
- The microflow LC system possesses stable, high-throughput, and highly sensitive characteristics. Combined with the ZenoTOF 7600 system, it successfully performed amino acid sequence coverage analysis for low-sample AAV2 capsid proteins, achieving almost 100% coverage, incorporating TOF-MS information, and 94.4% coverage with MS/MS data.
- The Zeno trap technology significantly enhances the sensitivity of MS/MS spectra. Coupled with CID fragmentation technology, results in high-quality MS/MS data, ensuring high confidence and complete matching of amino acid sequences.
- EAD fragmentation technology accurately identifies posttranslational modification sites and differentiation of amino acid isomers, offering an in-depth and precise characterization analysis of biopharmaceuticals.
- The Biologics Explorer software offers convenient and streamlined analytical tools, enabling rapid and automated analysis, including intact molecular weight, peptide mapping, and identification and relative quantitation of post-translational modification sites.
References
- Leszek Lisowski., Szun Szun Tay., & Ian Edward Alexander. Adeno-associated virus serotypes for gene therapeutics. Current Opinion in Pharmacology.2016. 24, 59–67.
- R.J. Samulski, N. Muzyczka. AAV-mediated gene therapy for research and therapeutic purposes. Annual Review of Virology. 2014.1: 427– 451.
- Jin X, Liu L, Nass S, et al. Direct Liquid Chromatography/ Mass Spectrometry Analysis for Complete Characterization of Recombinant Adeno-Associated Virus Capsid Proteins. Human Gene Therapy Methods. 2017. 28(5):255-267.
- Guapo F, Strasser L, S Millán-Martı́n, et al. Fast and efficient digestion of adeno associated virus (AAV) capsid proteins for liquid chromatography mass spectrometry (LC-MS) based peptide mapping and post translational modification analysis (PTMs). Journal of Pharmaceutical and Biomedical Analysis. 2022. 207:114427.
- Vowinckel J, Zelezniak A, Bruderer R, et al. Cost-effective generation of precise label-free quantitative proteomes in high-throughput by microLC and data-independent acquisition. Scientific Report. 2018, 8(1):4346.
- April R, Giles, Joshua J, et al. Deamidation of Amino Acids on the Surface of Adeno-Associated Virus Capsids Leads to Charge Heterogeneity and Altered Vector Function[J]. Molecular therapy.2018. 26(12): 2848–2862.
- Differentiation of aspartic and isoaspartic acid using electron activated dissociation (EAD). SCIEX technical note RUO-MKT-02-12550-B.
- Comparative analysis of intact AAV8 capsid proteins derived from SF9 and HEK293 cell lines. SCIEX technical note RUOMKT-02-12917-A.
- Marine Morvan and Ivan Miksik. Recent advances in chiral analysis of proteins and peptides. Separations. 2021. 8(8): 112.