Abstract
This technical note demonstrates an intact mass analysis of multiple protein therapeutics, including monoclonal antibodies (mAbs) and antibody-drug conjugates (ADCs) through the coupling of size exclusion chromatography (SEC) with native mass spectrometry (nMS) on the ZenoTOF 7600 system.
Protein therapeutics is a rapidly growing industry for treating serious illnesses like cancer, autoimmune diseases, etc. Mabs and ADCs are a few examples of protein therapeutics on the market today. MAbs are one of the most successful biotherapeutics for treating autoimmune diseases and multiple cancers1. ADCs are mAbs covalently coupled with cytotoxic payloads or other types of drugs through linkers predominantly attached to cysteine or lysine amino acid residues2. Due to the addition of the payload and linker, ADCs show an increased heterogeneity compared to their parent mAbs.
In this study, the ZenoTOF 7600 system was optimized for native intact mass analysis to ensure efficient transmission of molecular ions while avoiding dissociating their intact structure. The method provided accurate intact mass measurements for all proteins, relative quantitation of therapeutic size variants and average drug-to-antibody (avDAR) assessment of ADCs.
Key features of the analysis of mAbs and ADCs under native SEC-MS analysis
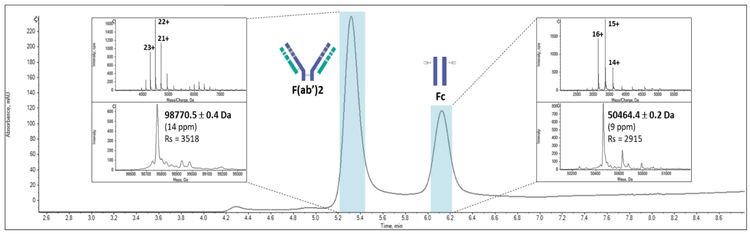
- Accurate mass measurements of intact proteins and IdeS-cleaved antibodies subunits under native conditions (Figure 1)
- Identification and relative quantitation of mAb high, and low molecular weight species (HMWS, LMWS)
- Drug load distribution (DLD) and average DAR (avDAR) assessment of ADCs under native conditions
- Maintenance of non-covalent interactions between heavy and light chain subunits (HC-HC and HC-LC) of cysteine-conjugated ADCs
- Detection and identification of low abundant DAR species
Introduction
For native intact mass analysis, SEC with volatile aqueous buffers, such as ammonium acetate, allows scientists to perform online buffer exchange of the samples3. This approach reduces sample preparation, can be used to relatively quantify the size variants (HMWS and LMWS) related to therapeutic proteins, and can be used to determine the avDAR at the intact level for ADCs. In ADC development, the avDAR and the drug load distribution (DLD) are two critical quality attributes (CQA) that must be fully characterized, assessed, and monitored. NMS has shown several advantages compared to reversed-phase liquid chromatography (RPLC) conditions for the analysis of mAbs and ADCs. For instance, nMS results in lower charged species, leading to a narrower charge state distribution with a better m/z spacing between consecutive MS signals, allowing an enhanced separation and identification of all the coexisting species. Furthermore, nMS analysis allows to maintain the non-covalent interactions between the different entities which is of utmost importance in the analysis of cysteine-linked ADCs to provide information about the intact scaffold of the protein.
Methods
Sample preparation: The stock solutions (1–60 µg/µL) of mAbs (atezolizumab, bevacizumab, ipilimumab, trastuzumab) and ADCs (brentuximab vedotin and trastuzumab emtansine) were diluted in water to a concentration of 5 µg/µL. Deglycosylation was performed on ADCs by incubating the ADC at a 1:1 ratio with a 20 units/µL solution of IgGZero enzyme for 30 minutes at 37°C. IdeS digestion was performed by incubating the protein at a 1:1 ratio with a 20 units/µL solution of resuspended IdeS for 30 minutes at 37°C.
Chromatography: Samples were separated using a Waters Acquity UPLC I-Class HPLC system and a Waters Acquity BEH SEC column (4.6 mm x 150 mm, 200 Å, 1.7 µm, P/N: 186005225). The column temperature was held at 40°C. The 12- minute separations were performed isocratically at 250 µL/min using 100mM ammonium acetate. The flow reached the spectrometer between 2 and 7 minutes.
Mass spectrometry: The mass spectrometer was a ZenoTOF 7600 system (SCIEX) equipped with the OptiFlow interface. The system was calibrated with a positive electrospray ionization calibration solution (P/N: 5049910, SCIEX). The TOF calibration gave an error of less than ±0.9 ppm for the MS mass check and less than ±0.7 ppm for the MS/MS mass check. Full scan TOF spectra were acquired over a range of 1000–10000 m/z with an accumulation time of 2 s using a spray voltage of 4500 V. Experimental parameters used for native analysis are listed in Table 1.


Analysis of mAbs
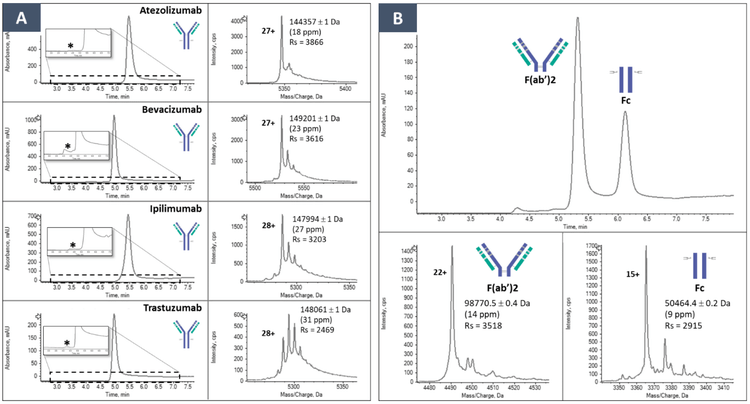
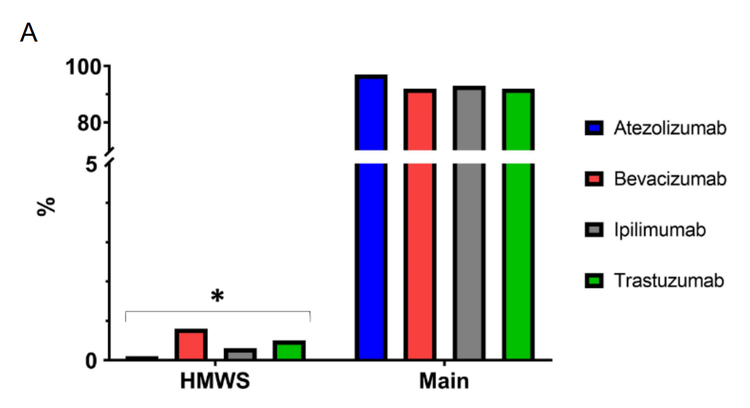
The capabilities of the ZenoTOF 7600 system for native SEC-MS analyses were benchmarked using 4 different therapeutic mAbs at intact and subunit levels. At the intact level, multiple peaks in the 4–7-min chromatographic window were detected for each mAb (Figure 2A). The first peak eluting at approximately 4 min corresponds to the dimeric form of each mAb while the most intense peaks observed between 5.0–5.5 minutes correspond to the monomeric mAbs. HMWS were identified and relatively quantified at low levels (<1%), as shown in Figure 3. However, signals corresponding to LMWS were not detected. The MS signal of the main chromatographic peaks encompass the glycosylation profiles of the 4 intact mAbs that were detected and identified with good mass accuracies (<30 ppm) and resolution (2500–3900, Figure 2A).
Native SEC-MS was performed at the subunit level of the mAbs upon enzymatic digestion with Immunoglobuline degraded enzyme from Streptococcus pyogenes (IdeS) (Figure 2B). Under these conditions, the Fc and F(ab’)2 subunits are separated and characterized with similar performances in terms of resolution (2500–3500) and mass accuracy (<17 ppm).
Analysis of ADCs
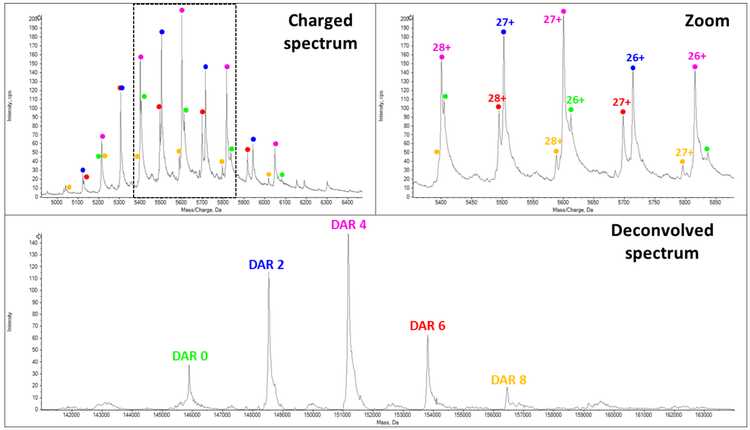
Analysis of ADCs often leads to more complex and heterogeneous spectra because of the co-existence of different DAR populations. Due to this heterogeneity, overlapping of different DAR species are frequently observed within the MS dimension. In this context, the ZenoTOF 7600 system was employed for the analysis of 2 different reference compounds: a cysteine-linked ADC (brentuximab vedotin, BV) and a lysinelinked ADC (trastuzumab emtansine, T-DM1). The analysis of BV, within which the drug payloads are conjugated on the cysteine residues involved in inter-chain disulfide linkages, requires careful optimization of the MS experimental parameters, as the whole protein scaffold is maintained by non-covalent interactions.
The MS spectrum of BV (Figure 4) highlights that efficient transmission of all the intact DAR species was successfully achieved using optimized instrument conditions. No ADC dissociation (release of light chain, Lc) was observed during the acquisition. Additionally, the MS spectrum exhibits well-resolved MS peaks, allowing the detection and identification of all the different DAR populations (0, 2, 4, 6 and 8), leading to an avDAR calculation of 3.7± 0.1, close to the value found by hydrophobic interaction chromatography4 .
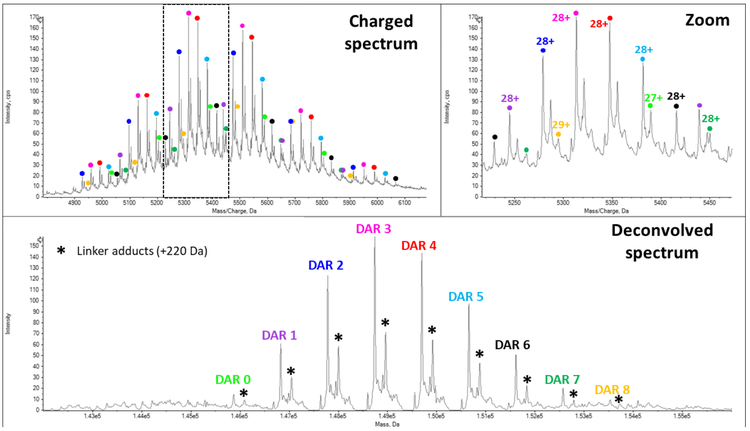
In T-DM1, the lysine residues are conjugated, leading to a highly heterogeneous and complex ADC, requiring high resolution and sensitivity to detect the different DAR populations.
The MS spectrum of T-DM1 (Figure 5) demonstrates the coexistence of several DAR populations ranging from 0 to 8 payloads. A more detailed view of the data allows the detection of low abundant species, such as the DAR 8. The drug load distribution is shown in the deconvolved spectrum with the DAR3 population as the most intense signal. The analysis allowed to afford experimental masses with mass accuracies lower than 30 ppm. According to the relative intensities of all the different species, the avDAR of T-DM1 was 3.5 ± 0.1 which was in good agreement with previous publications5 .
Conclusion
- The ZenoTOF 7600 system provides the required instrumental conditions to perform native MS analysis of therapeutic mAb-derived proteins
- Molecular ions with low charge states are efficiently transmitted, allowing the detection and identification of HMWS, and LMWS of mAbs with high mass accuracy and high resolution
- More complex and labile mAb-derived proteins such as ADCs can be confidently characterized allowing the accurate assessment of DLD and determination of avDAR
- The sensitivity and resolution of the ZenoTOF 7600 system facilitate the detection and identification of low-abundant DAR species, enabling a more comprehensive characterization of the ADC DAR landscape
- The ZenoTOF 7600 system provides efficient molecular ionn transmission while reducing potential non-covalent interaction dissociation
References
- Lu R. et al. (2020). Development of therapeutic antibodies for the treatment of diseases. Journal of Biomedical Science, 27 article number 1.
- Wagner-Rousset, E. et al. (2014). Antibody-drug conjugate model fast Characterization by LC-MS following IdeS Proteolytic Digestion. MAbs, 6(1), 173-184.
- Rosati, S. et al. (2014). Detailed mass analysis of structural heterogeneity in monoclonal antibodies using native mass spectrometry. Nat Protoc, 9(4), 967-976.
- Sarrut, M. et al. (2016). Analysis of antibody-drug conjugates by comprehensive on-Line two-dimensional hydrophobic interaction chromatography x reversed phase liquid chromatography hyphenated to high resolution mass spectrometry. II- Identification of sub-units for the characterization of even and odd load drug species.Journal of Chromatography B, 1032, 91–102.
- Marcoux, J. et al. (2015). Native Mass Spectrometry and ion mobility characterization of trastuzumab emtansine, a lysine-linked antibody drug conjugate. Protein Science, 24 (8), 1210–1223.